Gli avvisi personalizzati e la visualizzazione dei dati consentono di identificare e prevenire rapidamente malfunzionamenti dell'hardware, interruzioni e ogni tipo di problema di prestazioni.
I vostri server sono la linfa vitale della vostra azienda. Dall'hosting di siti web all'esecuzione di applicazioni critiche, non potete permettervi tempi di inattività. Con il software di monitoraggio dello stato del server di Paessler PRTG, potete stare tranquilli sapendo che i vostri server sono sani e pronti all'azione.
Diagnosticare i problemi di rete monitorando continuamente lo stato dell'hardware del server. Mostra l'utilizzo della CPU, la velocità delle ventole, lo stato dell'alimentazione, l'utilizzo delle risorse, l'utilizzo e lo spazio su disco e altre metriche chiave in tempo reale. Visualizzate i dati di monitoraggio in grafici e dashboard chiari per identificare più facilmente i problemi. Ottenete la Panoramica necessaria per risolvere problemi di malfunzionamento dei server, memoria insufficiente e altri problemi del server.
Monitoraggio dell'hardware in PRTG

Albero dei dispositivi dell'intera configurazione di monitoraggio

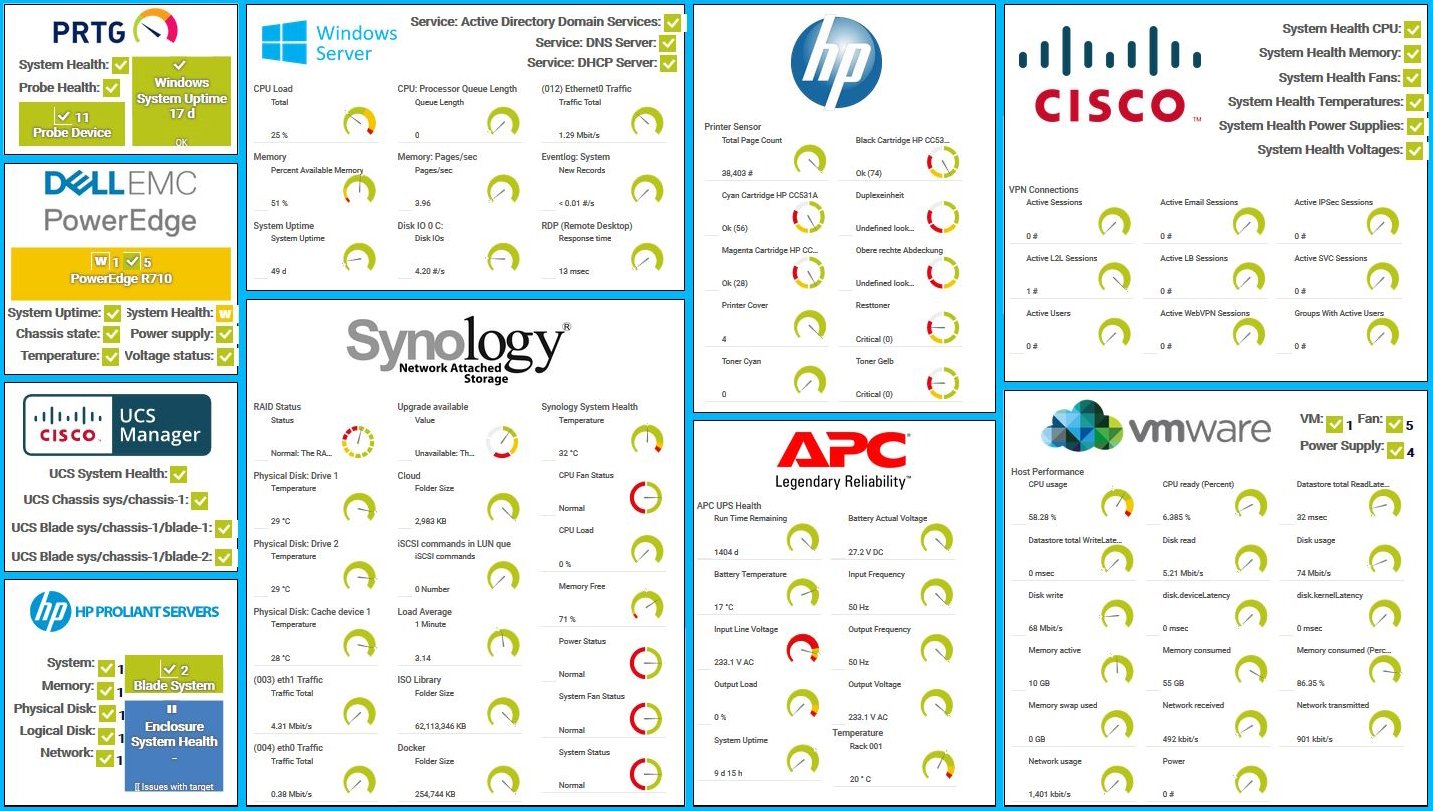
Dashboard PRTG personalizzato per tenere sotto controllo l'intera infrastruttura IT

Grafico dei dati di traffico in tempo reale in PRTG
Monitoraggio dell'hardware in PRTG
Albero dei dispositivi dell'intera configurazione di monitoraggio
“Monitor di rete vincente sotto tutti i punti di vista”
“La vera bellezza di PRTG sta nelle infinite possibilità che offre”
“PRTG Network Monitor
è molto difficile da superare”
Niente più crash inaspettati, niente più congetture. Con PRTG, saprete esattamente cosa sta succedendo ai vostri server, 24 ore su 24, 7 giorni su 7.
Le dashboard personalizzabili e in tempo reale del PRTG consentono di visualizzare la salute dei server a modo proprio. Create un unico pannello di vetro che evidenzi solo le metriche che vi interessano, nascondendo il rumore.
Con i dashboard flessibili, gli schemi di colore personalizzati, le opzioni di layout e i grafici interattivi di PRTG, si passa meno tempo a cercare i dati e più tempo ad agire su di essi.
Il sistema di monitoraggio di PRTG funziona perfettamente con i dispositivi dei migliori fornitori e produttori come Dell, HPE, IBM e Cisco Cisco.
IT supporta SNMP, WMI e altri protocolli, offrendo la flessibilità necessaria per monitorare ambienti misti. E sistemi operativi? Nessun problema. Microsoft Windows, Linux, Ubuntu, PRTG è in grado di gestirli.
Non cambiate strumento. PRTG consolida il monitoraggio in un'unica piattaforma. Non c'è bisogno di strumenti di monitoraggio separati per monitorare i server on-premise, le macchine virtuali nel cloud, i dischi rigidi o la salute delle applicazioni: è tutto qui.
Indipendentemente dal fatto che siano fisici, virtuali o nel cloud, PRTG offre una visione unificata della vostra infrastruttura server, in modo da vedere tutto in un unico posto.
Ricevere avvisi a modo vostro. SMS, e-mail, notifiche push: siete voi a decidere come e quando volete essere informati. E il percorso di escalation degli avvisi del PRTG assicura che la persona giusta venga informata.
Le soglie di attivazione degli avvisi e degli errori personalizzabili vi permettono di definire cosa fa scattare un avviso, in modo che vi vengano notificati solo i problemi più importanti.
PRTG è dotato di oltre 250 tipi di sensori nativi per il monitoraggio dell'intero ambiente on-premises, cloud e cloud ibrido. Dai un'occhiata ad alcuni esempi qui sotto!
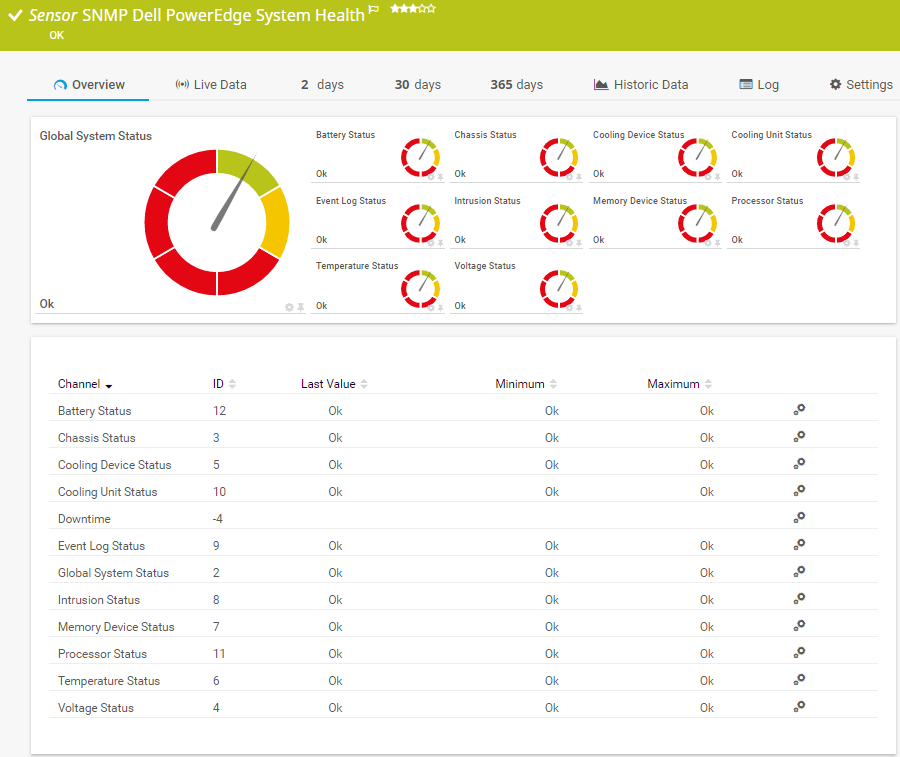
Il sensore SNMP Dell PowerEdge System Health monitora lo stato di salute del sistema di un server Dell PowerEdge. Può mostrare quanto segue:
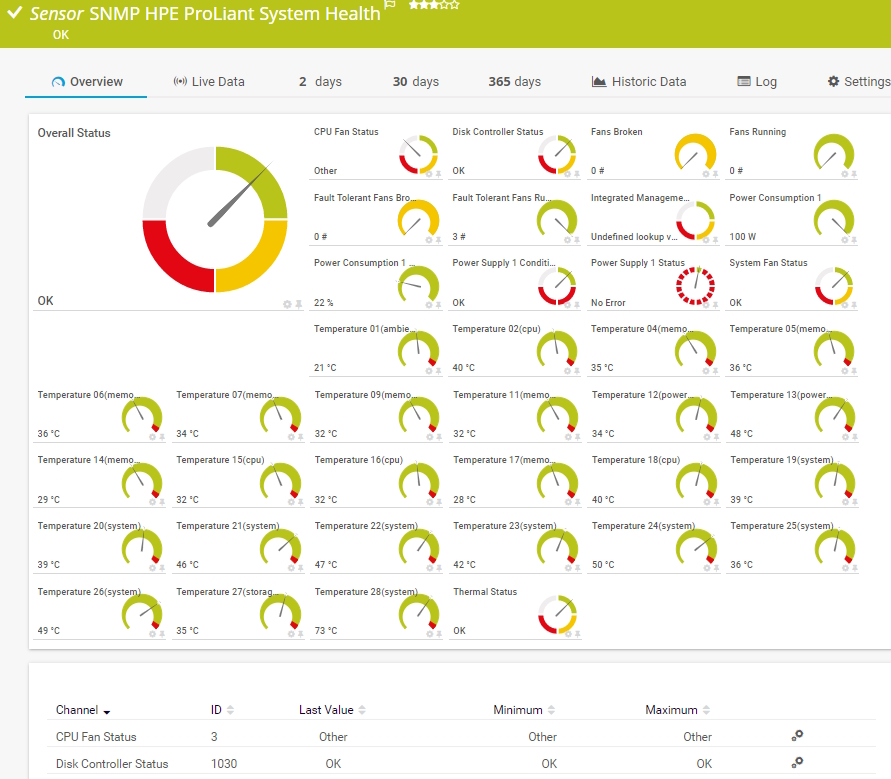
Il sensore SNMP HPE ProLiant System Health monitora la salute del sistema di un server HPE ProLiant. Può mostrare quanto segue:
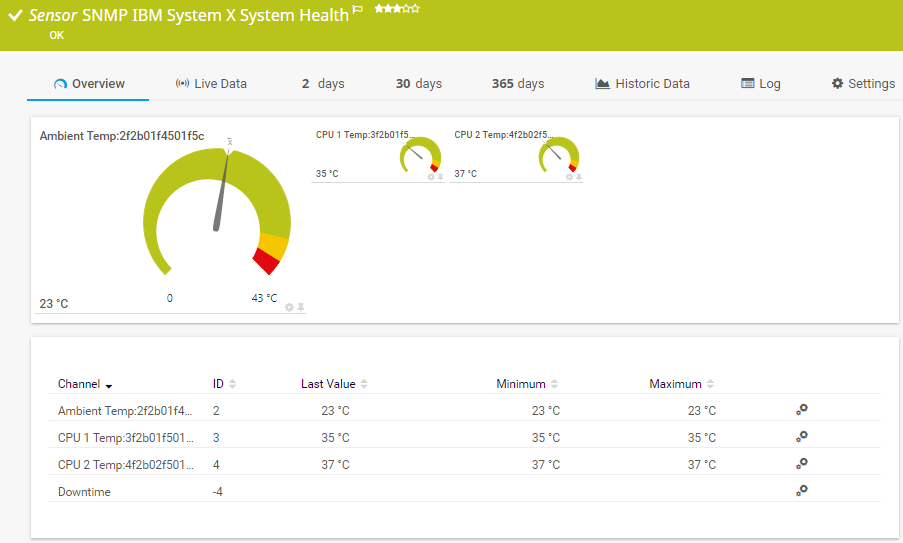
Il sensore SNMP IBM System X System Health monitora la salute del sistema di un dispositivo IBM. Può mostrare quanto segue:
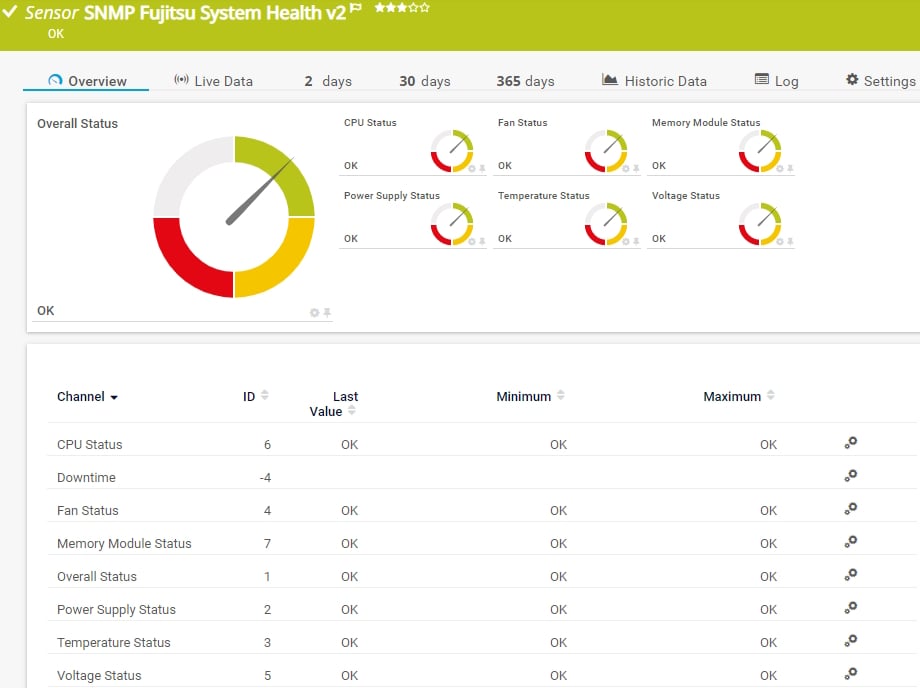
Il sensore SNMP Fujitsu System Health v2 monitora lo stato di un server Fujitsu PRIMERGY tramite l'integrated Remote Management Controller (iRMC) Il sensore può funzionare anche su altri dispositivi Fujitsu che dispongono di un iRMC, come i server PRIMEQUEST, alcuni sistemi di storage della linea di prodotti ETERNUS e le workstation CELSIUS in rack. Può mostrare quanto segue:
Consulta il manuale di PRTG per un elenco di tutti i tipi di sensore disponibili.

Gli avvisi personalizzati e la visualizzazione dei dati consentono di identificare e prevenire rapidamente i problemi di salute e di prestazioni dell'hardware.
Configurate PRTG in pochi minuti e utilizzatelo su quasi tutti i dispositivi mobili.

Essendo uno dei leader nel settore del monitoraggio IT, Paessler è diventato anche un partner autorizzato Dell per la creazione di soluzioni integrate nell'ecosistema tecnologico Dell.
Cosa significa per te?
Grazie alla collaborazione con fornitori IT innovativi, Paessler libera sinergie per creare nuovi e ulteriori vantaggi per i suoi clienti.

La combinazione dell'ampio set di funzioni di monitoraggio di PRTG con la garanzia di rete automatizzata di IP Fabric crea un nuovo livello di visibilità e affidabilità della rete.
Rhebo e PRTG offrono una soluzione di monitoraggio completa per gli ambienti IT e OT: dal monitoraggio delle condizioni fino al rilevamento di anomalie e minacce.

UVexplorer si integra perfettamente con PRTG per offrire una scoperta rapida e accurata della rete, un inventario dettagliato dei dispositivi e una mappatura automatica della rete alla piattaforma PRTG.
Notifiche in tempo reale significano una risoluzione più rapida dei problemi, in modo da poter agire prima che si verifichino problemi più gravi.
Software di monitoraggio della rete – Versione 24.4.102.1351 (November 12th, 2024)
Disponibile il download della versione per Windows e della versione cloud-based PRTG Hosted Monitor
Inglese, tedesco, spagnolo, francese, portoghese, olandese, russo, giapponese e cinese semplificato
Dispositivi di rete, larghezza di banda, server, applicazioni, ambienti virtuali, sistemi remoti, IoT e molto altro
Scegli l'abbonamento a PRTG Network Monitor più adatto a te

Il monitoraggio dello stato di salute dei server è un monitoraggio delle prestazioni dei cervelli della rete, che fornisce una Panoramica completa dello stato e delle prestazioni dei singoli server. IT comprende anche il monitoraggio dei parametri hardware, delle condizioni esterne della sala server e di vari dati di monitoraggio dei server e dei rack di server. Con un controllo dello stato di salute del server, è possibile prevenire i tempi di inattività tenendo sotto controllo elementi del server come il carico della CPU e l'uso della memoria, le ventole, gli alimentatori e il consumo, la temperatura dei vari componenti e molti altri importanti gauge.
La maggior parte delle aziende fa grande affidamento su un'infrastruttura IT stabile. Di conseguenza, i tempi di inattività possono causare molti problemi seri. Quando i vostri server si guastano, la vostra attività si ferma. A seconda della sua durata, i tempi di inattività possono anche causare perdite significative nelle vendite. Questo vale soprattutto se le vendite e le acquisizioni avvengono tramite il sito web dell'azienda. Anche la soddisfazione dei clienti può risentirne se i servizi desiderati non sono disponibili a causa di problemi al server.
Il monitoraggio dello stato di salute del server consente di prevenire le interruzioni, identificando i potenziali guasti prima che si aggravino. In questo modo si prevengono i tempi di inattività, si migliorano le prestazioni del server e si rende felice l'utenza.
PRTG fornisce un monitoraggio dello stato e delle prestazioni dei server tenendo conto di tutti i componenti che contribuiscono a un'infrastruttura server sana. Oltre ai singoli servizi e applicazioni, PRTG tiene d'occhio anche i componenti hardware. A tal fine, distribuisce sensori di salute del sistema preconfigurati, adatti a una varietà di produttori diversi.
Questi sensori utilizzano principalmente SNMP per interrogare i dati rilevanti di sistemi come NetApp, Buffalo, Cisco, Dell, HP, IBM, Juniper, LenovoEMC, QNAP, SonicWall e Synology. PRTG riconosce anche i server virtuali VMware, Citrix e Hyper-V e li incorpora nel suo monitoraggio.
Sì. Con le sonde remote, PRTG può monitorare i server di più siti da una dashboard centrale. Traccia i server locali, cloud e ibridi in un unico posto. Con la crescita dell'infrastruttura, cresce anche PRTG. IT è in grado di monitorare più server semplicemente aggiungendo altri sensori. Non sono necessari aggiornamenti.
Veloce. Davvero veloce. Scaricatelo, eseguite il setup e lasciate che lo strumento di auto-discovery trovi i vostri dispositivi. La funzione di auto-discovery di PRTG acquisisce l'intera infrastruttura server in pochi secondi e rileva automaticamente tutti i dispositivi di rete raggiungibili tramite ping. Il monitoraggio dei server avviene in un tempo inferiore a quello necessario per ordinare una pizza.
In PRTG, i “sensori” sono gli elementi base del monitoraggio. Un sensore monitora solitamente un valore misurato nella tua rete (ad esempio, il traffico di una porta switch, il carico della CPU di un server o lo spazio libero di un’unità disco). In media, occorrono circa 5-10 sensori per ogni dispositivo o un sensore per ogni porta switch.
Paessler ha condotto prove in oltre 600 dipartimenti IT in tutto il mondo per mettere a punto il suo software di monitoraggio di rete più vicino alle esigenze dei sysadmin. Il risultato è che più del 95% degli intervistati consiglierebbe PRTG – o lo ha già fatto.

Paessler PRTG è utilizzato da aziende di tutte le dimensioni. Gli amministratori di sistema adorano PRTG perché rende il loro lavoro molto più semplice.
Ampiezza di banda, server, ambienti virtuali, siti Web, servizi VoIP - PRTG tiene d'occhio la tua intera rete.
Tutti hanno esigenze di monitoraggio diverse. Ecco perché ti lasciamo provare PRTG gratuitamente. Inizia oggi stesso la tua prova.