Gli avvisi personalizzati e la visualizzazione dei dati consentono di identificare e prevenire rapidamente i problemi di velocità e latenza della rete.
Mantenete la vostra organizzazione in carreggiata e la vostra rete stabile quando utilizzate il nostro strumento di monitoraggio dei tempi di risposta. Paessler PRTG si concentra sul mantenimento di prestazioni ottimali per i vostri server, siti web e database, monitorando attentamente i loro tempi di risposta e informandovi immediatamente di eventuali cambiamenti, in diversi modi.
Ottenete informazioni sui tempi di risposta di tutti i componenti critici della rete da un'unica dashboard. Monitorate, ad esempio, i tempi di caricamento del vostro sito web, del server web e delle applicazioni web da tutto il mondo, il tempo necessario per eseguire le query del database o la velocità di lettura e scrittura dei dischi rigidi.
Andate oltre il monitoraggio a livello superficiale con la capacità del PRTG di effettuare analisi a lungo termine dei tempi di risposta. Scoprite le tendenze e gli schemi delle prestazioni della rete su periodi di tempo prolungati con un'analisi approfondita dei dati sui tempi di risposta.
Rimanete informati con gli avvisi immediati di PRTG in caso di degrado delle prestazioni. Improvvisi picchi nei tempi di risposta o graduali cali di efficienza dei server saranno facilmente individuabili, dandovi gli strumenti per mitigare rapidamente questi problemi.
Individuate e risolvete i colli di bottiglia della vostra rete con PRTG. Una rete in crescita non deve essere un punto dolente. Identificando le aree di congestione o di ritardo, è possibile prendere decisioni informate sugli aggiornamenti della rete o sulle modifiche alla configurazione per migliorare le prestazioni complessive.
Diagnosticare i problemi di rete monitorando continuamente i tempi di risposta di dispositivi, applicazioni e server. Mostra i tempi di risposta di picco, i tempi di risposta medi e altre metriche chiave delle prestazioni in tempo reale. Visualizzate i dati di monitoraggio in grafici e dashboard chiari per identificare più facilmente i problemi. Ottenete la visibilità necessaria per risolvere la lentezza della rete e altri problemi di prestazioni.

Grafico dei dati di traffico in tempo reale in PRTG

Albero dei dispositivi dell'intera configurazione di monitoraggio

Dashboard PRTG personalizzato per tenere sotto controllo l'intera infrastruttura IT
Grafico dei dati di traffico in tempo reale in PRTG
Albero dei dispositivi dell'intera configurazione di monitoraggio
“Monitor di rete vincente sotto tutti i punti di vista”
“La vera bellezza di PRTG sta nelle infinite possibilità che offre”
“PRTG Network Monitor
è molto difficile da superare”
PRTG è dotato di oltre 250 tipi di sensori nativi per il monitoraggio dell'intero ambiente on-premises, cloud e cloud ibrido. Dai un'occhiata ad alcuni esempi qui sotto!
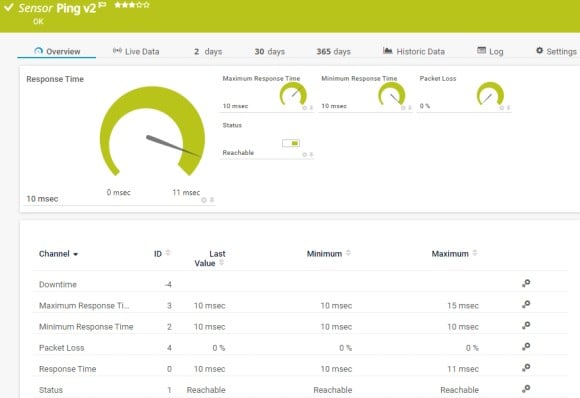
Il sensore Ping v2 invia una richiesta di eco ICMP (Internet Control Message Protocol) (“ping”) dal sistema sonda al dispositivo principale per monitorarne la disponibilità. Può mostrare quanto segue:
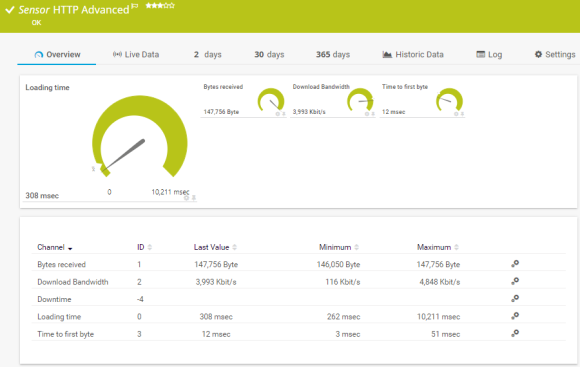
Il sensore HTTP Advanced monitora il codice sorgente di una pagina web utilizzando HTTP. Supporta l'autenticazione, il controllo dei contenuti e altri parametri avanzati. Può mostrare i seguenti dati:
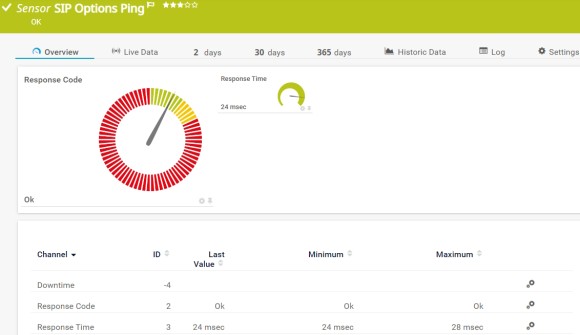
Il sensore SIP Options Ping monitora la connettività a un server SIP (Session Initiation Protocol) utilizzando le opzioni SIP “ping”. Il sensore invia richieste di autenticazione e di opzioni al server SIP. Può mostrare quanto segue:
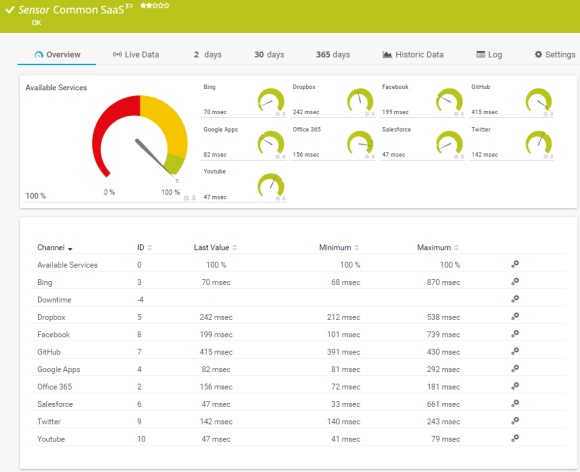
Il sensore Common SaaS monitora la disponibilità di diversi fornitori di Software-as-a-Service (SaaS). Può mostrare quanto segue:
Consulta il manuale di PRTG per un elenco di tutti i tipi di sensore disponibili.

Gli avvisi personalizzati e la visualizzazione dei dati consentono di identificare e prevenire rapidamente i problemi di velocità e latenza della rete.
PRTG si configura in pochi minuti e può essere utilizzato su un'ampia gamma di dispositivi mobili.

Grazie alla collaborazione con fornitori IT innovativi, Paessler libera sinergie per creare nuovi e ulteriori vantaggi per i suoi clienti.

La combinazione dell'ampio set di funzioni di monitoraggio di PRTG con la garanzia di rete automatizzata di IP Fabric crea un nuovo livello di visibilità e affidabilità della rete.

Siemon e Paessler uniscono la tecnologia degli edifici intelligenti e il monitoraggio avanzato e fanno sì che la tua visione di edifici e data center intelligenti diventi realtà.

UVexplorer si integra perfettamente con PRTG per offrire una scoperta rapida e accurata della rete, un inventario dettagliato dei dispositivi e una mappatura automatica della rete alla piattaforma PRTG.
Notifiche in tempo reale significano una risoluzione più rapida dei problemi, in modo da poter intervenire prima che si verifichino problemi più gravi.
Software di monitoraggio della rete – Versione 24.4.102.1351 (November 12th, 2024)
Disponibile il download della versione per Windows e della versione cloud-based PRTG Hosted Monitor
Inglese, tedesco, spagnolo, francese, portoghese, olandese, russo, giapponese e cinese semplificato
Dispositivi di rete, larghezza di banda, server, applicazioni, ambienti virtuali, sistemi remoti, IoT e molto altro
Scegli l'abbonamento a PRTG Network Monitor più adatto a te

Il monitoraggio del tempo di risposta è una pratica di misurazione delle prestazioni che valuta il tempo necessario a un sistema o a un'applicazione per rispondere alla richiesta di un utente. IT prevede il monitoraggio della durata tra l'avvio di una richiesta e la ricezione della risposta corrispondente.
Il monitoraggio dei tempi di risposta è fondamentale per identificare i colli di bottiglia delle prestazioni, ottimizzare l'efficienza del sistema e garantire un'esperienza di monitoraggio positiva per gli utenti, poiché tempi di risposta più rapidi portano a una maggiore soddisfazione e coinvolgimento e riducono i tempi di inattività e le interruzioni delle operazioni aziendali.
In assoluto, PRTG è in grado di monitorare i tempi di risposta di varie applicazioni oltre che dei dispositivi di rete, fornendo una visione olistica delle prestazioni della rete.
Sì, PRTG è in grado di monitorare i tempi di risposta dei servizi basati sul cloud, garantendo una copertura completa degli ambienti on-premise e cloud.
PRTG identifica le cause principali dei tempi di risposta lenti, come l'elevato carico della CPU o i colli di bottiglia della larghezza di banda, consentendo azioni mirate per ottimizzare le prestazioni della rete.
Sì, è possibile personalizzare i valori di soglia per gli avvisi in PRTG, consentendo di definire ciò che costituisce un tempo di risposta anomalo per il vostro ambiente di rete specifico.
In PRTG, i “sensori” sono gli elementi base del monitoraggio. Un sensore monitora solitamente un valore misurato nella tua rete (ad esempio, il traffico di una porta switch, il carico della CPU di un server o lo spazio libero di un’unità disco). In media, occorrono circa 5-10 sensori per ogni dispositivo o un sensore per ogni porta switch.
Paessler ha condotto prove in oltre 600 dipartimenti IT in tutto il mondo per mettere a punto il suo software di monitoraggio di rete più vicino alle esigenze dei sysadmin. Il risultato è che più del 95% degli intervistati consiglierebbe PRTG – o lo ha già fatto.

Paessler PRTG è utilizzato da aziende di tutte le dimensioni. Gli amministratori di sistema adorano PRTG perché rende il loro lavoro molto più semplice.
Ampiezza di banda, server, ambienti virtuali, siti Web, servizi VoIP - PRTG tiene d'occhio la tua intera rete.
Tutti hanno esigenze di monitoraggio diverse. Ecco perché ti lasciamo provare PRTG gratuitamente. Inizia oggi stesso la tua prova.