PRTG Manual: SNMP Dell PowerEdge System Health Sensor
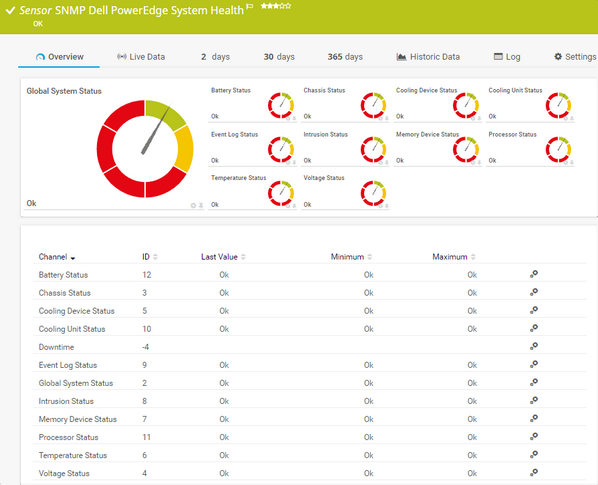
The SNMP Dell PowerEdge System Health sensor monitors the system health of a Dell PowerEdge server via the Simple Network Management Protocol (SNMP).
For a detailed list and descriptions of the channels that this sensor can show, see section Channel List.
- Dutch: SNMP Dell PowerEdge Systeemstatus
- French: Dell PowerEdge état du système (SNMP)
- German: SNMP Dell PowerEdge Systemzustand
- Japanese: SNMP Dell PowerEdge システムの正常性
- Portuguese: Saúde do sistema Dell PowerEdge (SNMP)
- Russian: Работоспособность системы Dell PowerEdge по SNMP
- Simplified Chinese: SNMP Dell PowerEdge 系统健康状况
- Spanish: Salud de sistema Dell PowerEdge (SNMP)
Consider the following remarks and requirements for this sensor:
Remark |
Description |
|---|---|
Dell OpenManage Server Administrator or iDRAC 7 |
This sensor requires Integrated Dell Remote Access Controller (iDRAC) 7 or the Dell OpenManage Server Administrator (OMSA) on the target system.
|
IPv6 |
This sensor supports IPv6. |
Performance impact |
This sensor has a very low performance impact. |
Lookups |
This sensor uses lookups to determine the status values of one or more channels. |
Knowledge Base |
|
The sensor has the following default tags that are automatically predefined in the sensor's settings when you add the sensor:
- dell
- snmpdell
- snmpdellsystemhealthsensor
- systemhealth
For more information about basic sensor settings, see section Sensor Settings.
Dell PowerEdge System Health Specific
Setting |
Description |
|---|---|
Chassis |
The chassis that this sensor monitors. |
Channel Mask |
The channel mask that describes which channels are available. |
Data Source |
The interface that PRTG uses to get monitoring data. This is either Dell OMSA or iDRAC. |
Setting |
Description |
|---|---|
Primary Channel |
Select a channel from the list to define it as the primary channel. In the device tree, PRTG displays the last value of the primary channel below the sensor's name. The available options depend on what channels are available for this sensor.
|
Graph Type |
Define how this sensor shows different channels:
|
Stack Unit |
This setting is only visible if you select Stack channels on top of each other above. Select a unit from the list. PRTG stacks all channels with this unit on top of each other. By default, you cannot exclude single channels from stacking if they use the selected unit. However, there is an advanced procedure to do so. |
By default, all of these settings are inherited from objects that are higher in the hierarchy. We recommend that you change them centrally in the root group settings if necessary. To change a setting for this object only, click ![]() under the corresponding setting name to disable the inheritance and to display its options.
under the corresponding setting name to disable the inheritance and to display its options.
For more information, see section Inheritance of Settings.
Which channels the sensor actually shows might depend on the target device, the available components, and the sensor setup.
Channel |
Description |
|---|---|
Ampere Status |
The ampere status
|
Battery Status |
The battery status
|
Chassis Status |
The chassis status
|
Cooling Device Status |
The cooling device status
|
Cooling Unit Status |
The cooling unit status
|
Downtime |
In the channel table on the Overview tab, this channel never shows any values. PRTG uses this channel in graphs and reports to show the amount of time in which the sensor was in the Down status. |
Global System Status |
The global system status
|
Intrusion Status |
The intrusion status
|
Memory Device Status |
The memory device status
|
Power Supply Status |
The power supply status
|
Power Unit Status |
The power unit status
|
Processor Status |
The processor status
|
Temperature Status |
The temperature status
|
Voltage Status |
The voltage status
|
KNOWLEDGE BASE
Why does my Dell PowerEdge System Health sensor show a power unit status error after iDRAC update?
What do I need to monitor Dell servers?
I can't add Dell PowerEdge sensors to PRTG. What can I do?
What security features does PRTG include?
My SNMP sensors don’t work. What can I do?


