Custom alerts and data visualization let you quickly identify and prevent all kinds of network downtime issues.
Unscheduled downtime is not only annoying but can also have a negative impact on your business if left unattended. That’s why it’s so important to understand the root cause of an outage. Only then can you develop successful monitoring strategies. Paessler PRTG is your all-in-one network monitoring tool to address different downtime issues.
Every system administrator knows that hardware components like CPUs, RAM, and routers are frequent culprits of downtime.
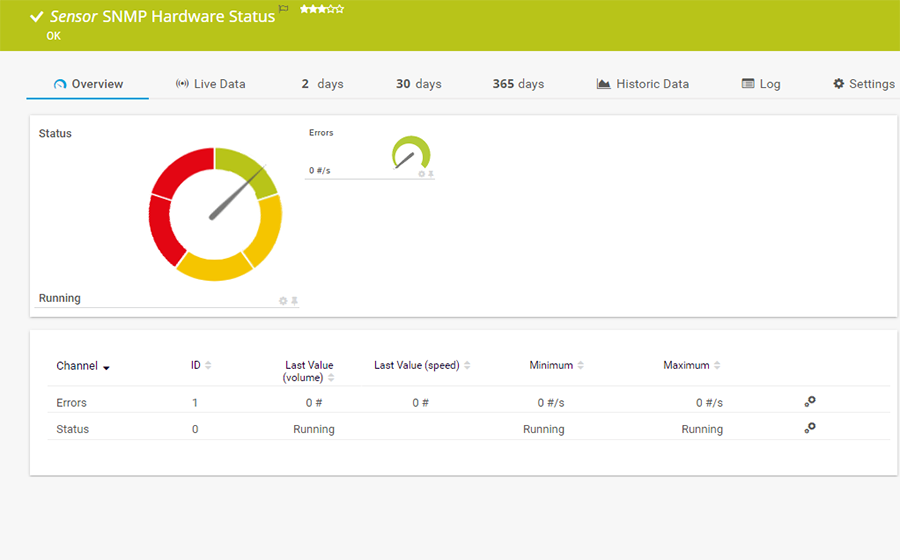
PRTG provides you with different sensors like the SNMP CPU Load sensor, the SNMP Memory sensor, or the SNMP Hardware Status sensor, so you can quickly identify and fix hardware issues.
Network attacks, for example DDoS, malware, or ransomware, are unfortunately regular events that can cause some serious downtime if you don’t detect them in time.
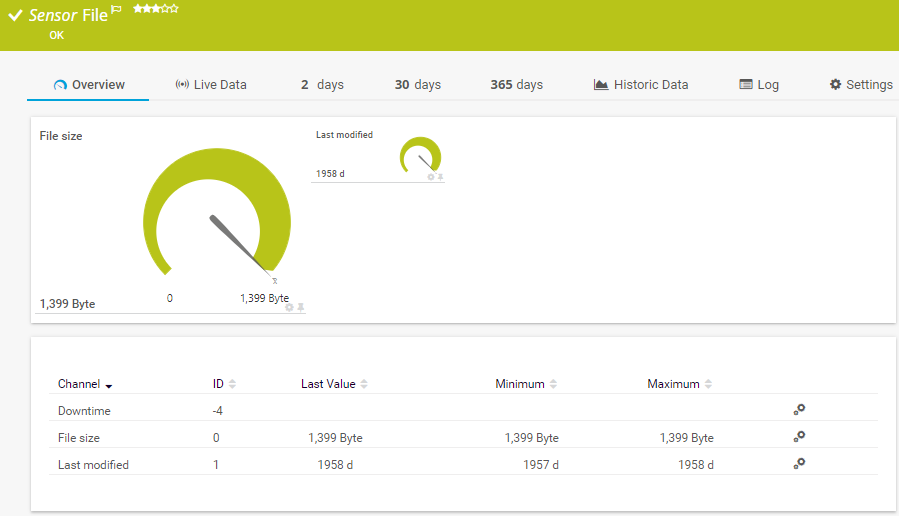
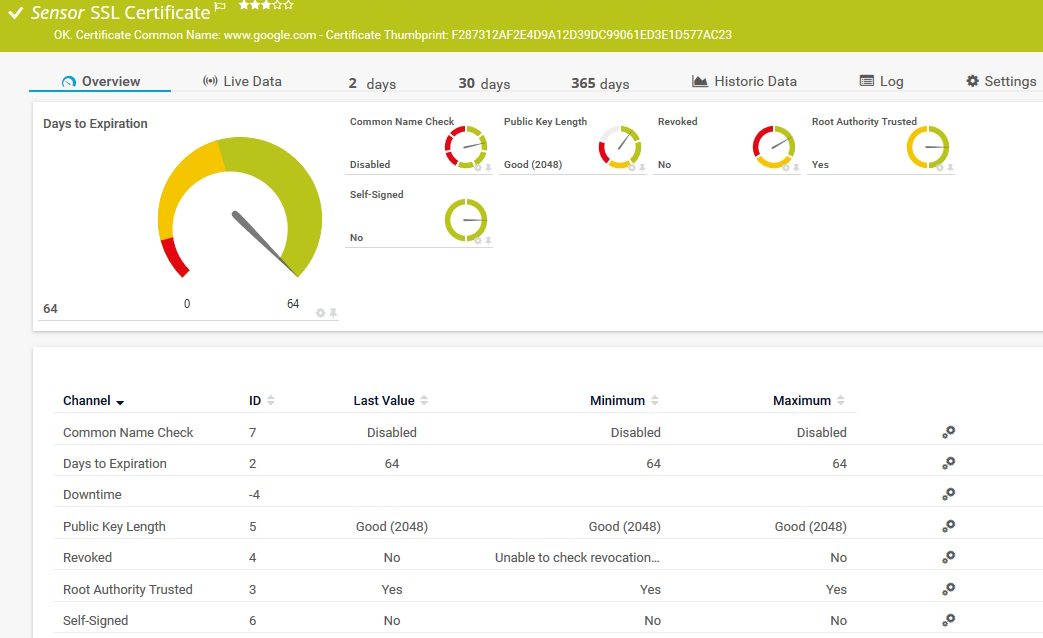
Deploying the File sensor to check your system files for suspicious changes, the SNMP Traffic sensor to recognize unusual bandwidth activity, or the SSL Certificate sensor to check if your certificates are up to date, help you detect and respond to threats effectively.
Full storage disks are not only incredibly annoying and slow down work processes, they can also lead to unexpected infrastructure downtime.
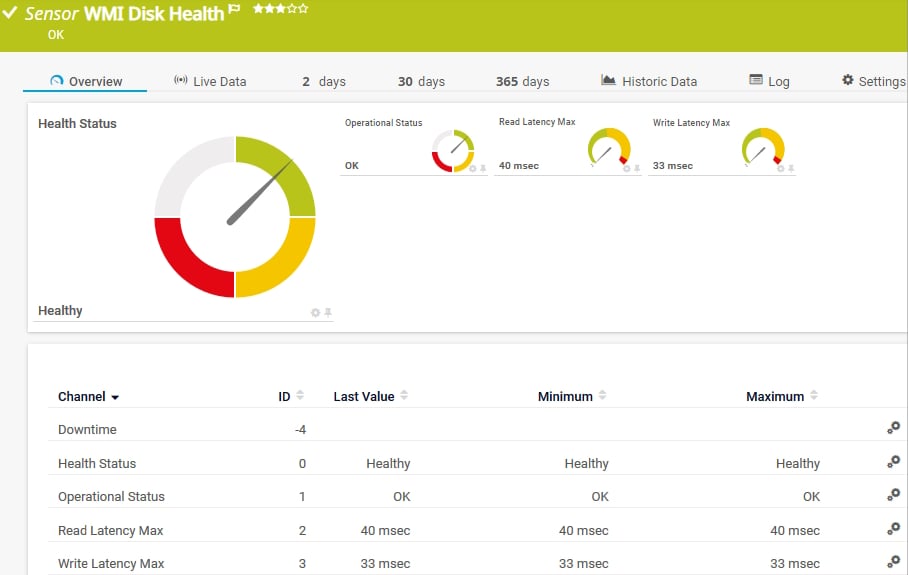
Monitoring storage disks with the WMI Disk Health or WMI HDD Health sensors, or any other dedicated PRTG sensor to monitor downtime gives you the ability to intervene early and prevent capacity issues.
We all know that faulty applications, especially critical ones like databases or web servers, can cause significant downtime.
To make sure this doesn’t happen to you, PRTG offers a number of dedicated database, event log, and web server sensors for easy integration. With their help, you can easily prevent issues and maintain best user experience.
Diagnose network issues by continuously tracking the downtime of your servers, routers, switches, and other devices. Show hardware failures, network security threats, storage issues, application malfunctions, and other key metrics in real time. Visualize monitoring data in clear graphs and dashboards to identify problems more easily. Gain the visibility you need to troubleshoot and prevent downtime.

Live traffic data graph in PRTG

Device tree view of the complete monitoring setup

Custom PRTG dashboard for keeping an eye on the entire IT infrastructure
Live traffic data graph in PRTG
Device tree view of the complete monitoring setup
“All-around winning
network monitor”
“The real beauty of PRTG is the endless possibilities it offers”
“PRTG Network Monitor
is very hard to beat”
Troubleshooting will probably always be a part of your daily tasks. But an even more important goal is the prevention of downtime so you can keep your business up and running. Monitoring potential downtime culprits with PRTG gives you the power to proactively improve network performance while simultaneously reducing downtime.
PRTG detects network anomalies, application failures, or bandwidth bottlenecks in real time.
Acting as a downtime notification system, your monitoring software immediately alerts you via SMS, email, push notification, Slack message, and more when the thresholds you configure are exceeded and sends notifications to the right teams for a quick resolution.
Do you need customized reports of your monitoring data for your different stakeholders? With PRTG’s powerful reporting system, you can show updates on your network, device, or service downtimes exactly the way you need them.
Thanks to customizable rules and a powerful API integration for even more customization, all decisions can be based on data.
We all want to make informed decisions when it comes to our work. To make those decisions, you need data, lots and lots of reliable data.
That you don’t need to dig through all the data yourself, PRTG comes with historic data reports for every sensor you deploy – an easy way to increase the performance of your network significantly.
PRTG comes with more than 250 native sensor types for monitoring your entire on-premises, cloud, and hybrid cloud environment out of the box. Check out some examples below!
The SNMP Hardware Status sensor monitors the status of a server's hardware component. It can show the following:
The File sensor monitors a file located on the local disk on the probe system, parent device, or a file that is accessible via Server Message Block (SMB). It can show the following:
The SSL Certificate sensor monitors the certificate of a Secure Sockets Layer (SSL)/Transport Layer Security (TLS) secured connection. It can show the following:
The WMI Disk Health sensor monitors the health of a physical disk on a Windows system. It can show the following:
See the PRTG Manual for a list of all available sensor types.
Real-time notifications mean faster troubleshooting so that you can act before more serious issues occur.

PRTG is not only a downtime monitor, but also offers a wide range of monitoring features for you to improve your overall network management, such as server monitoring, website monitoring, or network traffic analysis. The convenient auto-discovery feature, which takes care of the setup of your monitoring environment after the quick and easy installation, is just one of many helpful functionalities.
The best dashboards are those that show you important data immediately. But setting up your own dashboards in a new monitoring environment is often time-consuming.
To save you valuable time, PRTG provides a drag-and-drop map editor for creating network maps and dashboards with detailed overviews of your network’s health in no time.
Tired of using one software for OT monitoring and another for IT infrastructure monitoring? With PRTG, your monitoring operations are ready for the future.
With IT and OT network monitoring in one application, you not only save time and resources. You can also check the status of all your devices from a single pane of glass.
PRTG excels at bandwidth monitoring thanks to its numerous sensors that track all aspects of bandwidth usage.
Whether you want to know how good the connection to your remote data centers is or how fast you can access the cloud, you will always have the latest data sets at your fingertips to manage your network traffic effectively.r fingertips to manage your network traffic effectively.
PRTG is set up in a matter of minutes and can be used on a wide variety of mobile devices.


“Excellent tool for detailed monitoring. Alarms and notifications work greatly. Equipment addition is straight forward and server initial setup is very easy. ...feel safe to purchase it if you intend to monitor a large networking landscape.”
Partnering with innovative IT vendors, Paessler unleashes synergies to create
new and additional benefits for joined customers.

Combining PRTG’s broad monitoring feature set with IP Fabric’s automated network assurance creates a new level of network visibility and reliability.

Paessler and Plixer provide a complete solution adding flow and metadata analysis to a powerful network monitoring tool.

With ScriptRunner Paessler integrates a powerful event automation platform into PRTG Network Monitor.
Custom alerts and data visualization let you quickly identify and prevent all kinds of network downtime issues.
Network Monitoring Software – Version 24.4.102.1351 (November 12th, 2024)
Download for Windows and cloud-based version PRTG Hosted Monitor available
English, German, Spanish, French, Portuguese, Dutch, Russian, Japanese, and Simplified Chinese
Network devices, bandwidth, servers, applications, virtual environments, remote systems, IoT, and more
Choose the PRTG Network Monitor subscription that's best for you


Downtime monitoring is the process of tracking the operational status of IT infrastructure to quickly identify and fix downtime incidents. This process includes tasks such as website downtime monitoring and server downtime monitoring.
With automated downtime monitoring tools, you can receive immediate alerts when problems occur, so you can respond quickly to minimize disruptions. Continuous downtime tracking helps to maintain a detailed record of system performance, allowing your IT teams to identify patterns and prevent future incidents.
Monitoring downtime is a critical task as it helps minimize the impact of downtime on business operations with the goal to maintain continuous service availability and reliability. Effective website downtime monitoring and server downtime monitoring with PRTG reduces the risk of extended service disruptions, protecting revenue and customer trust.
By monitoring uptime and downtime, you can maintain high performance levels, meet service level agreements (SLAs), and improve overall operational efficiency.
Downtime monitoring tools like PRTG use a variety of metrics to alert system administrators of irregularities or failures that could lead to downtime. This includes online service downtime tracking, which monitors web services for outages, and server downtime monitoring, which keeps an eye on server performance.
PRTG, for example, uses ping and other technologies, and tracks response time and response codes to quickly detect if a network device or service is down.
Automated downtime monitoring systems provide real-time alerts, so you can take immediate action resolve problems and restore normal operations. Continuous downtime tracking also provides a detailed log of all incidents for further analysis and improvement.
While uptime monitoring focuses on the time when systems are operational, downtime monitoring specifically tracks and addresses the time periods when systems are not operational. Both uptime checks and downtime monitoring play a critical role in effective network performance monitoring and management.
Uptime monitoring services are used to keep services running smoothly, while downtime monitoring identifies outages immediately. Together, they provide a comprehensive view of the health of your IT infrastructure and help you maintain optimal performance and reliability.
In PRTG, “sensors” are the basic monitoring elements. One sensor usually monitors one measured value in your network, for example the traffic of a switch port, the CPU load of a server, or the free space on a disk drive. On average, you need about 5-10 sensors per device or one sensor per switch port.
Paessler conducted trials in over 600 IT departments worldwide to tune its network monitoring software closer to the needs of sysadmins. The result of the survey: over 95% of the participants would recommend PRTG – or already have.

Paessler PRTG is used by companies of all sizes. Sysadmins love PRTG because it makes their job a whole lot easier.
Bandwidth, servers, virtual environments, websites, VoIP services – PRTG keeps an eye on your entire network.
Everyone has different monitoring needs. That’s why we let you try PRTG for free.