![]()
Operating system monitoring with PRTG
One monitoring environment, no matter the operating system you use
- Monitor Windows, Linux, macOS, and other Unix-based and proprietary OS
- Get automatically alerted when there's risk of underperformance
- Agentless deployment saves time, hassle, and system resources
Our users give top ratings for monitoring with Paessler PRTG


PRTG operating system monitoring: What you’ll find on this page

Conquer the OS smorgasbord
Windows may be the backbone of most enterprise networks, but it's unlikely to be the only operating system you're dealing with… even if your organization doesn't have a bring-your-own-device-to-work policy.
You likely have Linux and Unix-based web, database, and application servers. Plus hybrid cloud environments, and routers, switches, and firewalls running on proprietary operating systems like Cisco iOS.
As a sysadmin, you're usually faced with one of two options: pick which operating systems to monitor (if you like living on the edge), or deploy specialized monitoring tools for every OS on your network and complicate your life further.
But there's also a third way. With Paessler PRTG, you can monitor every network component, regardless of which OS it runs on, from one place. It's simpler. It tracks all your key operating system health stats round the clock. And, best of all, it's as flexible and versatile as you need it to be.
PRTG makes OS monitoring as easy as it gets
Custom alerts and data visualization let you quickly identify and prevent performance issues on Windows, Linux, macOS, and other UNIX-based and proprietary operating systems.
4 reasons why to choose PRTG as your operating system monitoring tool
Fast setup
Get up and running in minutes, with minimal intervention. Install PRTG with a few clicks and define an IP address range.
The Auto-Discovery functionality adds every device in that IP range to your monitoring environment, based on built-in device templates, and assigns the appropriate sensors. Job done.
Automatic alerts
Pick your parameters and let PRTG do the work. Select your preferred performance thresholds, and you'll get alerted when a network component is at risk of breaching them.
This way, you can fix the issues pronto before you're flooded with error messages (and colleagues' complaints).
Wide compatibility
Stop switching between monitoring environments and get a clearer picture of your network's performance and health.
Whichever operating systems you want to keep an eye on, PRTG brings everything together in one clear, intuitive interface you can tailor to your organization's exact requirements.
Resource-light
No need to install specialized software agents or clients (though you can use it as an agent-based monitor if you want to).
Our agentless monitoring software uses protocols like SNMP, SSH, WMI, and Windows performance counters for collecting metrics even from remote systems, so it doesn't hoover up precious system resources.
What operating system monitoring looks like in PRTG
Diagnose network issues by continuously tracking various proprietary operating systems. Show CPU load, network traffic, memory usage, physical disk space, bandwidth, and other key system metrics in real time. Visualize monitoring data in clear graphs and dashboards to identify problems more easily. Gain the overview you need to troubleshoot underperformance, security loopholes, and other hardware, software, and network issues.

Device tree view of the complete monitoring setup
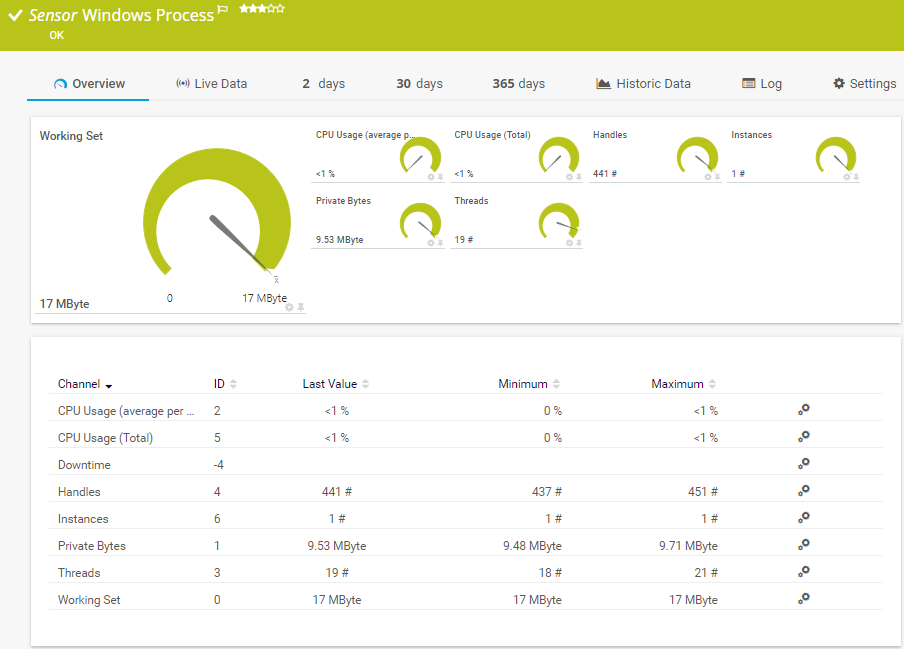
Preconfigured Windows Process sensor in PRTG
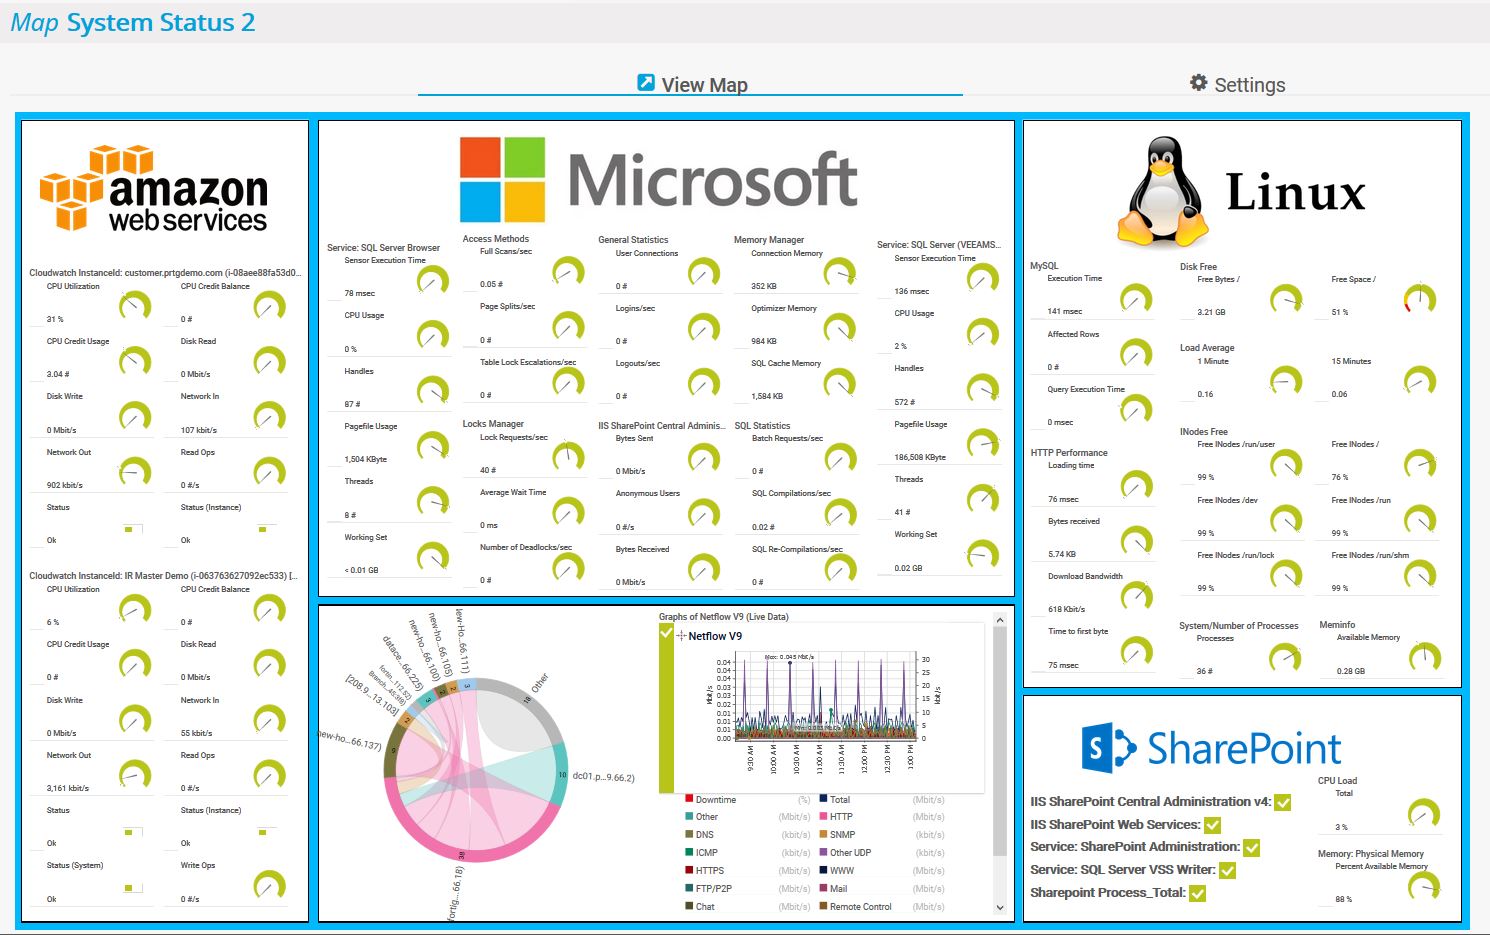
Custom PRTG dashboard for keeping an eye on various applications, services, and operating systems
Start monitoring operating systems with PRTG and see how it can make your network more reliable and your job easier.
IT experts agree: Paessler PRTG is a great solution for IT infrastructure monitoring

“All-around winning
network monitor”

“The real beauty of PRTG is the endless possibilities it offers”

“PRTG Network Monitor
is very hard to beat”
A unified view of your OS data with all the flexibility you need
PRTG tracks network components using more than 250 preconfigured sensor types. This means they work right out of the box, connecting seamlessly to your devices, and pulling data into your monitoring environment straight away.
Windows monitoring
Monitor CPU usage, traffic, memory, hard drives, and much more on your Windows servers.
PRTG even analyzes Windows services and applications such as Microsoft IIS, SharePoint, Active Directory, and Microsoft SQL, Windows Event Log files, and the Windows Security Center.
Linux monitoring
PRTG keeps an eye on popular distributions such as Ubuntu, Debian, CentOS, RedHat, and SUSE, and can also read data from other Linux distributions.
Monitor various health and performance parameters of your Linux network 24/7.
Mac OS X monitoring
PRTG also monitors macOS. Although it forms the basis for only the smallest of networks, macOS is often installed on workstations and sometimes even on servers.
Here too, PRTG uses the SNMP protocol. Certain macOS systems (such as Yosemite - version 10.10) can also be monitored via SSH.
Other operating systems
Many network devices have their own operating systems. There are SonicWall firewalls, IBM servers, and Hyper-V virtualization solutions, to name just a few.
The big advantage of PRTG is that it comes with sensors for specific manufacturers, as well as sensors that you can customize using the PRTG API.
Your operating system monitor at a glance – even on the go
Set up PRTG in minutes and use it on almost any mobile device.


Find the root cause of the problem with our PRTG operating system performance monitoring solution
Real-time notifications mean faster troubleshooting so that you can act before more serious issues occur.
PRTG is compatible with all major vendors, products, and systems
![]()
Create innovative solutions with Paessler’s partners
Partnering with innovative vendors, Paessler unleashes synergies to create
new and additional benefits for joined customers.


ScriptRunner
With ScriptRunner, Paessler integrates a powerful event automation platform into PRTG Network Monitor.
“Excellent tool for detailed monitoring. Alarms and notifications work greatly. Equipment addition is straight forward and server initial setup is very easy. ...feel safe to purchase it if you intend to monitor a large networking landscape.”
Infrastructure and Operations Engineer in the Communications Industry, firm size 10B - 30B USD
PRTG makes OS monitoring as easy as it gets
Custom alerts and data visualization let you quickly identify and prevent performance issues on Windows, Linux, macOS, and other UNIX-based and proprietary operating systems.

PRTG: The multi-tool for sysadmins
Adapt PRTG individually and dynamically to your needs and rely on a strong API:- HTTP API: Access monitoring data and manipulate monitoring objects via HTTP requests
- Custom sensors: Create your own PRTG sensors for customized monitoring
- Custom notifications: Create your own notifications and send action triggers to external systems
- REST Custom sensor: Monitor almost everything that provides data in XML or JSON format
More than just a monitoring tool:
Reasons our customers love PRTG


Still not convinced?
![]()
More than 500,000
sysadmins love PRTG
Paessler PRTG is used by companies of all sizes. Sysadmins love PRTG because it makes their job a whole lot easier.
![]()
Monitor your entire IT infrastructure
Bandwidth, servers, virtual environments, websites, VoIP services – PRTG keeps an eye on your entire network.
![]()
Try Paessler PRTG
for free
Everyone has different monitoring needs. That’s why we let you try PRTG for free.
![]()
Start monitoring operating systems with PRTG and see how it can make your network more reliable and your job easier.
|
PRTG |
Network Monitoring Software - Version 25.1.104.1961 (April 7th, 2025) |
|
Hosting |
Download for Windows and cloud-based version PRTG Hosted Monitor available |
Languages |
English, German, Spanish, French, Portuguese, Dutch, Russian, Japanese, and Simplified Chinese |
Pricing |
Up to 100 sensors for free (Price List) |
Unified Monitoring |
Network devices, bandwidth, servers, applications, virtual environments, remote systems, IoT, and more |
Supported Vendors & Applications |
|
Discover more monitoring insights and stories

Solutions for all your monitoring needs


Combining the broad monitoring feature set of PRTG with IP Fabric’s automated network assurance creates a new level of network visibility and reliability.