Custom alerts and data visualizations let you quickly identify and prevent low RAM and allocate more resources before it’s too late.
But when servers, applications, or other network devices use too much of it… Well, that's where the problems start. Poor server performance. Applications that take ages to load. Frozen screens. You get the idea.
The good news is that optimizing memory is usually relatively straightforward. But only if you can pinpoint the cause of the problem. Which is where Paessler PRTG comes in.
With a highly configurable user interface, round-the-clock monitoring, and automatic, customizable alerts, PRTG keeps a close watch on RAM usage across your network. That way, when memory is running low, you'll know exactly what you need to do to free up more.

Pick your warning and error thresholds and let PRTG do the work. Sophisticated sensors monitor your network 24/7 and alert you when memory-hungry components or other issues risk draining your RAM, so you can step in before your network slows to a standstill.
Addressing drains, bottlenecks, and other causes of low RAM is good. But preventing them is much, much better. PRTG lets you know even before issues happen and notifies you via email, SMS, push notification, and more. Which means you'll never get caught on the back foot again.
PRTG can keep an eye on your whole IT infrastructure: applications, bandwidth, databases, websites, servers… the list goes on. Our highly customizable, all-in-one network monitoring tool gives you the peace of mind that nothing will fall through the cracks.
Diagnose network issues by continuously tracking the available, used, and total memory of different network components. Show RAM usage, virtual memory, as well as CPU usage and other key metrics in real time. Visualize monitoring data in clear graphs and dashboards to identify problems more easily. Gain the overview you need to troubleshoot bottlenecks, underperformance, and other memory-related issues.

Live traffic data graph in PRTG

Device tree view of the complete monitoring setup

Custom PRTG dashboard for keeping an eye on the entire IT infrastructure
Live traffic data graph in PRTG
Device tree view of the complete monitoring setup
“All-around winning
network monitor”
“The real beauty of PRTG is the endless possibilities it offers”
“PRTG Network Monitor
is very hard to beat”
PRTG comes with more than 250 native sensor types for monitoring your entire on-premises, cloud, and hybrid cloud environment out of the box. Check out some examples below!
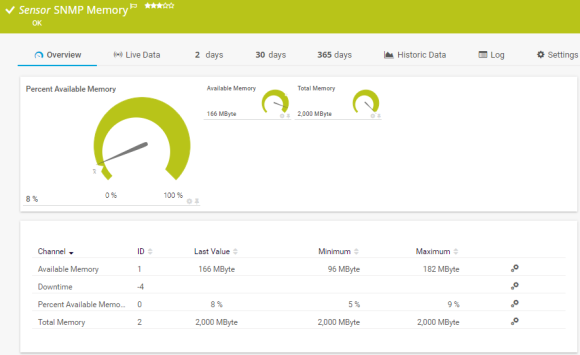
The SNMP Memory sensor monitors the memory usage of a system. It can show the following:
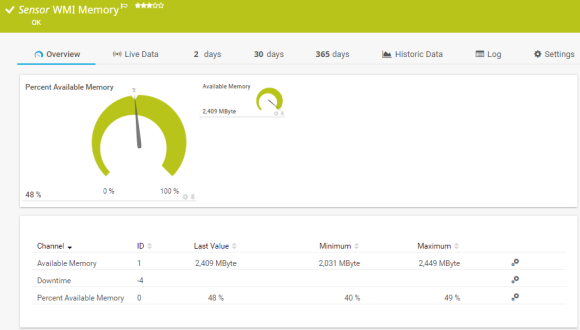
The WMI Memory sensor monitors available (free) system memory on Windows systems. It can show the following:
The SSH Meminfo sensor monitors the memory usage of a Linux/Unix system using Secure Shell (SSH). It can show the following:
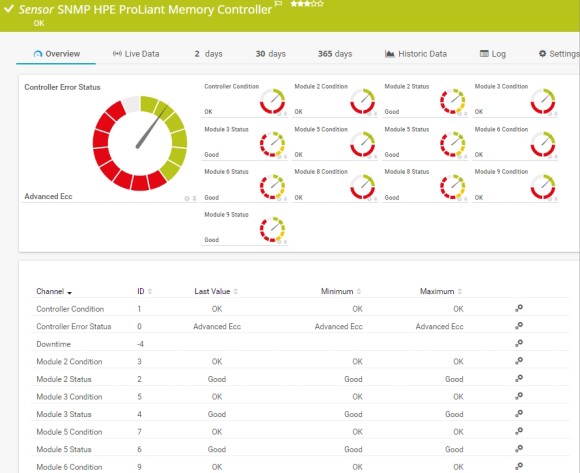
The SNMP HPE ProLiant Memory Controller sensor monitors a memory controller in an HPE ProLiant server. It can show the following:
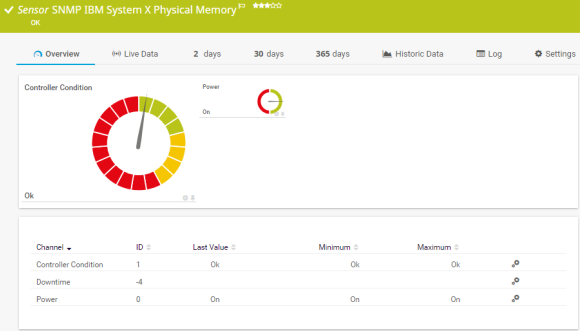
The SNMP IBM System X Physical Memory sensor monitors the memory modules in an IBM server. It can show the following:
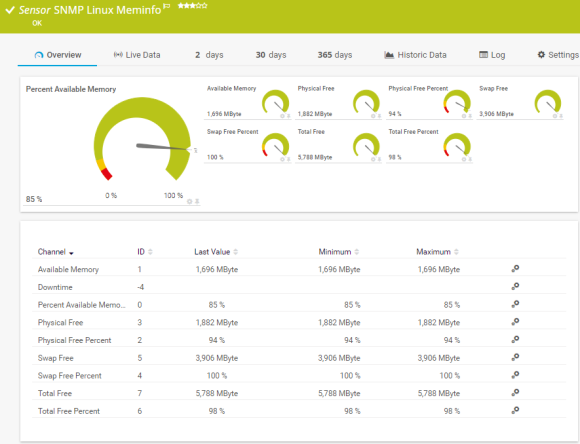
The SNMP Linux Meminfo sensor monitors the memory usage of a Linux/Unix system. It can show the following:
See the PRTG Manual for a list of all available sensor types.

Custom alerts and data visualizations let you quickly identify and prevent low RAM and allocate more resources before it’s too late.
PRTG is set up in a matter of minutes and can be used on a wide variety of mobile devices.

Hewlett Packard Enterprises and Paessler are collaborating in a fresh new way to bring increased value to you as our customer.
What does this mean for you?
Partnering with innovative IT vendors, Paessler unleashes synergies to create
new and additional benefits for joined customers.
baramundi and PRTG create a secure, reliable and powerful IT infrastructure where you have everything under control - from the traffic in your firewall to the configuration of your clients.
With the combination of PRTG and Insys, the monitoring specialist Paessler and the industrial gateway manufacturer INSYS icom offer a practical possibility to merge IT and OT.

Siemon and Paessler bring together intelligent building technology and advanced monitoring and make your vision of intelligent buildings and data centers become reality.
Real-time notifications mean faster troubleshooting so that you can act before more serious issues occur.
Network Monitoring Software – Version 24.4.102.1351 (November 12th, 2024)
Download for Windows and cloud-based version PRTG Hosted Monitor available
English, German, Spanish, French, Portuguese, Dutch, Russian, Japanese, and Simplified Chinese
Network devices, bandwidth, servers, applications, virtual environments, remote systems, IoT, and more
Choose the PRTG Network Monitor subscription that's best for you


RAM stands for Random Access Memory. It's a type of computer memory that allows data to be stored and retrieved quickly by the computer's processor. RAM is considered volatile memory, meaning that it loses its contents when the power is turned off.
The speed and capacity of RAM can significantly affect a computer's performance. More RAM allows a computer to handle larger and more complex tasks simultaneously, while faster RAM can improve overall system responsiveness.
Memory monitoring refers to the process of tracking and analyzing the usage of RAM in a computer system. It involves continuously monitoring the amount of memory that is used by various processes and applications running on the system.
Memory monitoring tools like PRTG provide real-time data on memory usage and help users identify potential performance issues such as memory leaks or excessive resource consumption.
PRTG is a proprietary software tool that works as a memory checker and tracks and analyzes RAM usage across your network. Available for on-premises servers or as a cloud-hosted solution, it helps you pinpoint memory-hungry applications, servers, and other network components, so you can prevent bottlenecks and other issues and ensure there's always enough memory available to meet your organization's needs.
PRTG uses sophisticated sensors that monitor RAM usage across your network using SNMP, WMI, or SSH. Each sensor tracks a specific parameter. Set a threshold, and PRTG will ping you via email, text, or in-app notification if a given parameter goes over or under it so you can make the necessary adjustments to optimize RAM before it slows down your network.
In PRTG, “sensors” are the basic monitoring elements. One sensor usually monitors one measured value in your network, for example the traffic of a switch port, the CPU load of a server, or the free space on a disk drive. On average, you need about 5-10 sensors per device or one sensor per switch port.
Paessler conducted trials in over 600 IT departments worldwide to tune its network monitoring software closer to the needs of sysadmins. The result of the survey: over 95% of the participants would recommend PRTG – or already have.

Paessler PRTG is used by companies of all sizes. Sysadmins love PRTG because it makes their job a whole lot easier.
Bandwidth, servers, virtual environments, websites, VoIP services – PRTG keeps an eye on your entire network.
Everyone has different monitoring needs. That’s why we let you try PRTG for free.