Paessler PRTG

WMI monitoring with PRTG

Monitor all WIndows-based components from one place


  • Keep an eye on Windows Servers, workstations, computers, and more
  • Use preconfigured WMI monitoring sensors for agentless deployment
  • Get automatically alerted about Windows availability and performance issues
 

Our users give top ratings for monitoring with Paessler PRTG


PRTG makes WMI monitoring as easy as it gets

Custom alerts and data visualizations let you quickly identify and prevent health and performance issues of Windows-based devices.


Windows & WMI: The cornerstone of most enterprise networks

Servers. Workstations. Applications. Intranets…

With so much riding on Windows, having in-depth health and performance data at your fingertips is a must (unless you like living dangerously).

With the Microsoft standard WMI, you can easily request information about operating system metrics, Windows process and service status, file system usage, and more, of your entire Windows environment. But manually querying your network via command prompts can be tedious…

Paessler PRTG is designed to make WMI monitoring simple at scale. Our powerful preconfigured WMI sensors work right out of the box, tracking critical stats automatically round the clock, even from remote systems – with an impact on your resources you can easily deal with.


5 reasons to choose PRTG as your WMI monitoring tool

Automatic network discovery

Setting up comprehensive WMI monitoring can be tiresome. Not with PRTG. We've built our tool to be plug and play. Install PRTG with a few clicks, and let the auto-discovery detect your WMI-enabled devices and add them to your environment while you nip out for coffee.

Real-time alerts & notifications

Pick your network monitoring parameters and let PRTG do the work. Our customizable alerting system texts you, emails you, or sends you an in-app notification as soon as a specific WMI metric falls below your chosen thresholds. Which means you can prevent issues instead of scrambling to solve them.

Complete network visibility

If it's part of your network, PRTG can keep an eye on it. Alongside WMI monitoring, you'll also have access to more than 250 preconfigured sensors for backup monitoring, bandwidth monitoring, traffic monitoring, database monitoring, and much more, plus the flexibility to create your own sensors.

Reduced resource footprint

No need to install specialized software agents on the devices you want to monitor. PRTG is agentless WMI monitoring software that uses, among other technologies, WMI queries and remote management, so it's more secure and won't hoover up precious system resources.

Free tools to test your network

You got stuck with your WMI monitoring setup? No worries here. Thanks to our free tool Paessler WMI Tester, you can quickly determine if it’s possible to access a target device from your PRTG server with WMI, and identify the root cause of WMI errors and configuration issues.


IT experts agree: Paessler PRTG is a great solution for IT infrastructure monitoring

logo

“All-around winning
network monitor”

logo it brief

“The real beauty of PRTG is the endless possibilities it offers”

logo

“PRTG Network Monitor
is very hard to beat”


What WMI monitoring looks like in PRTG

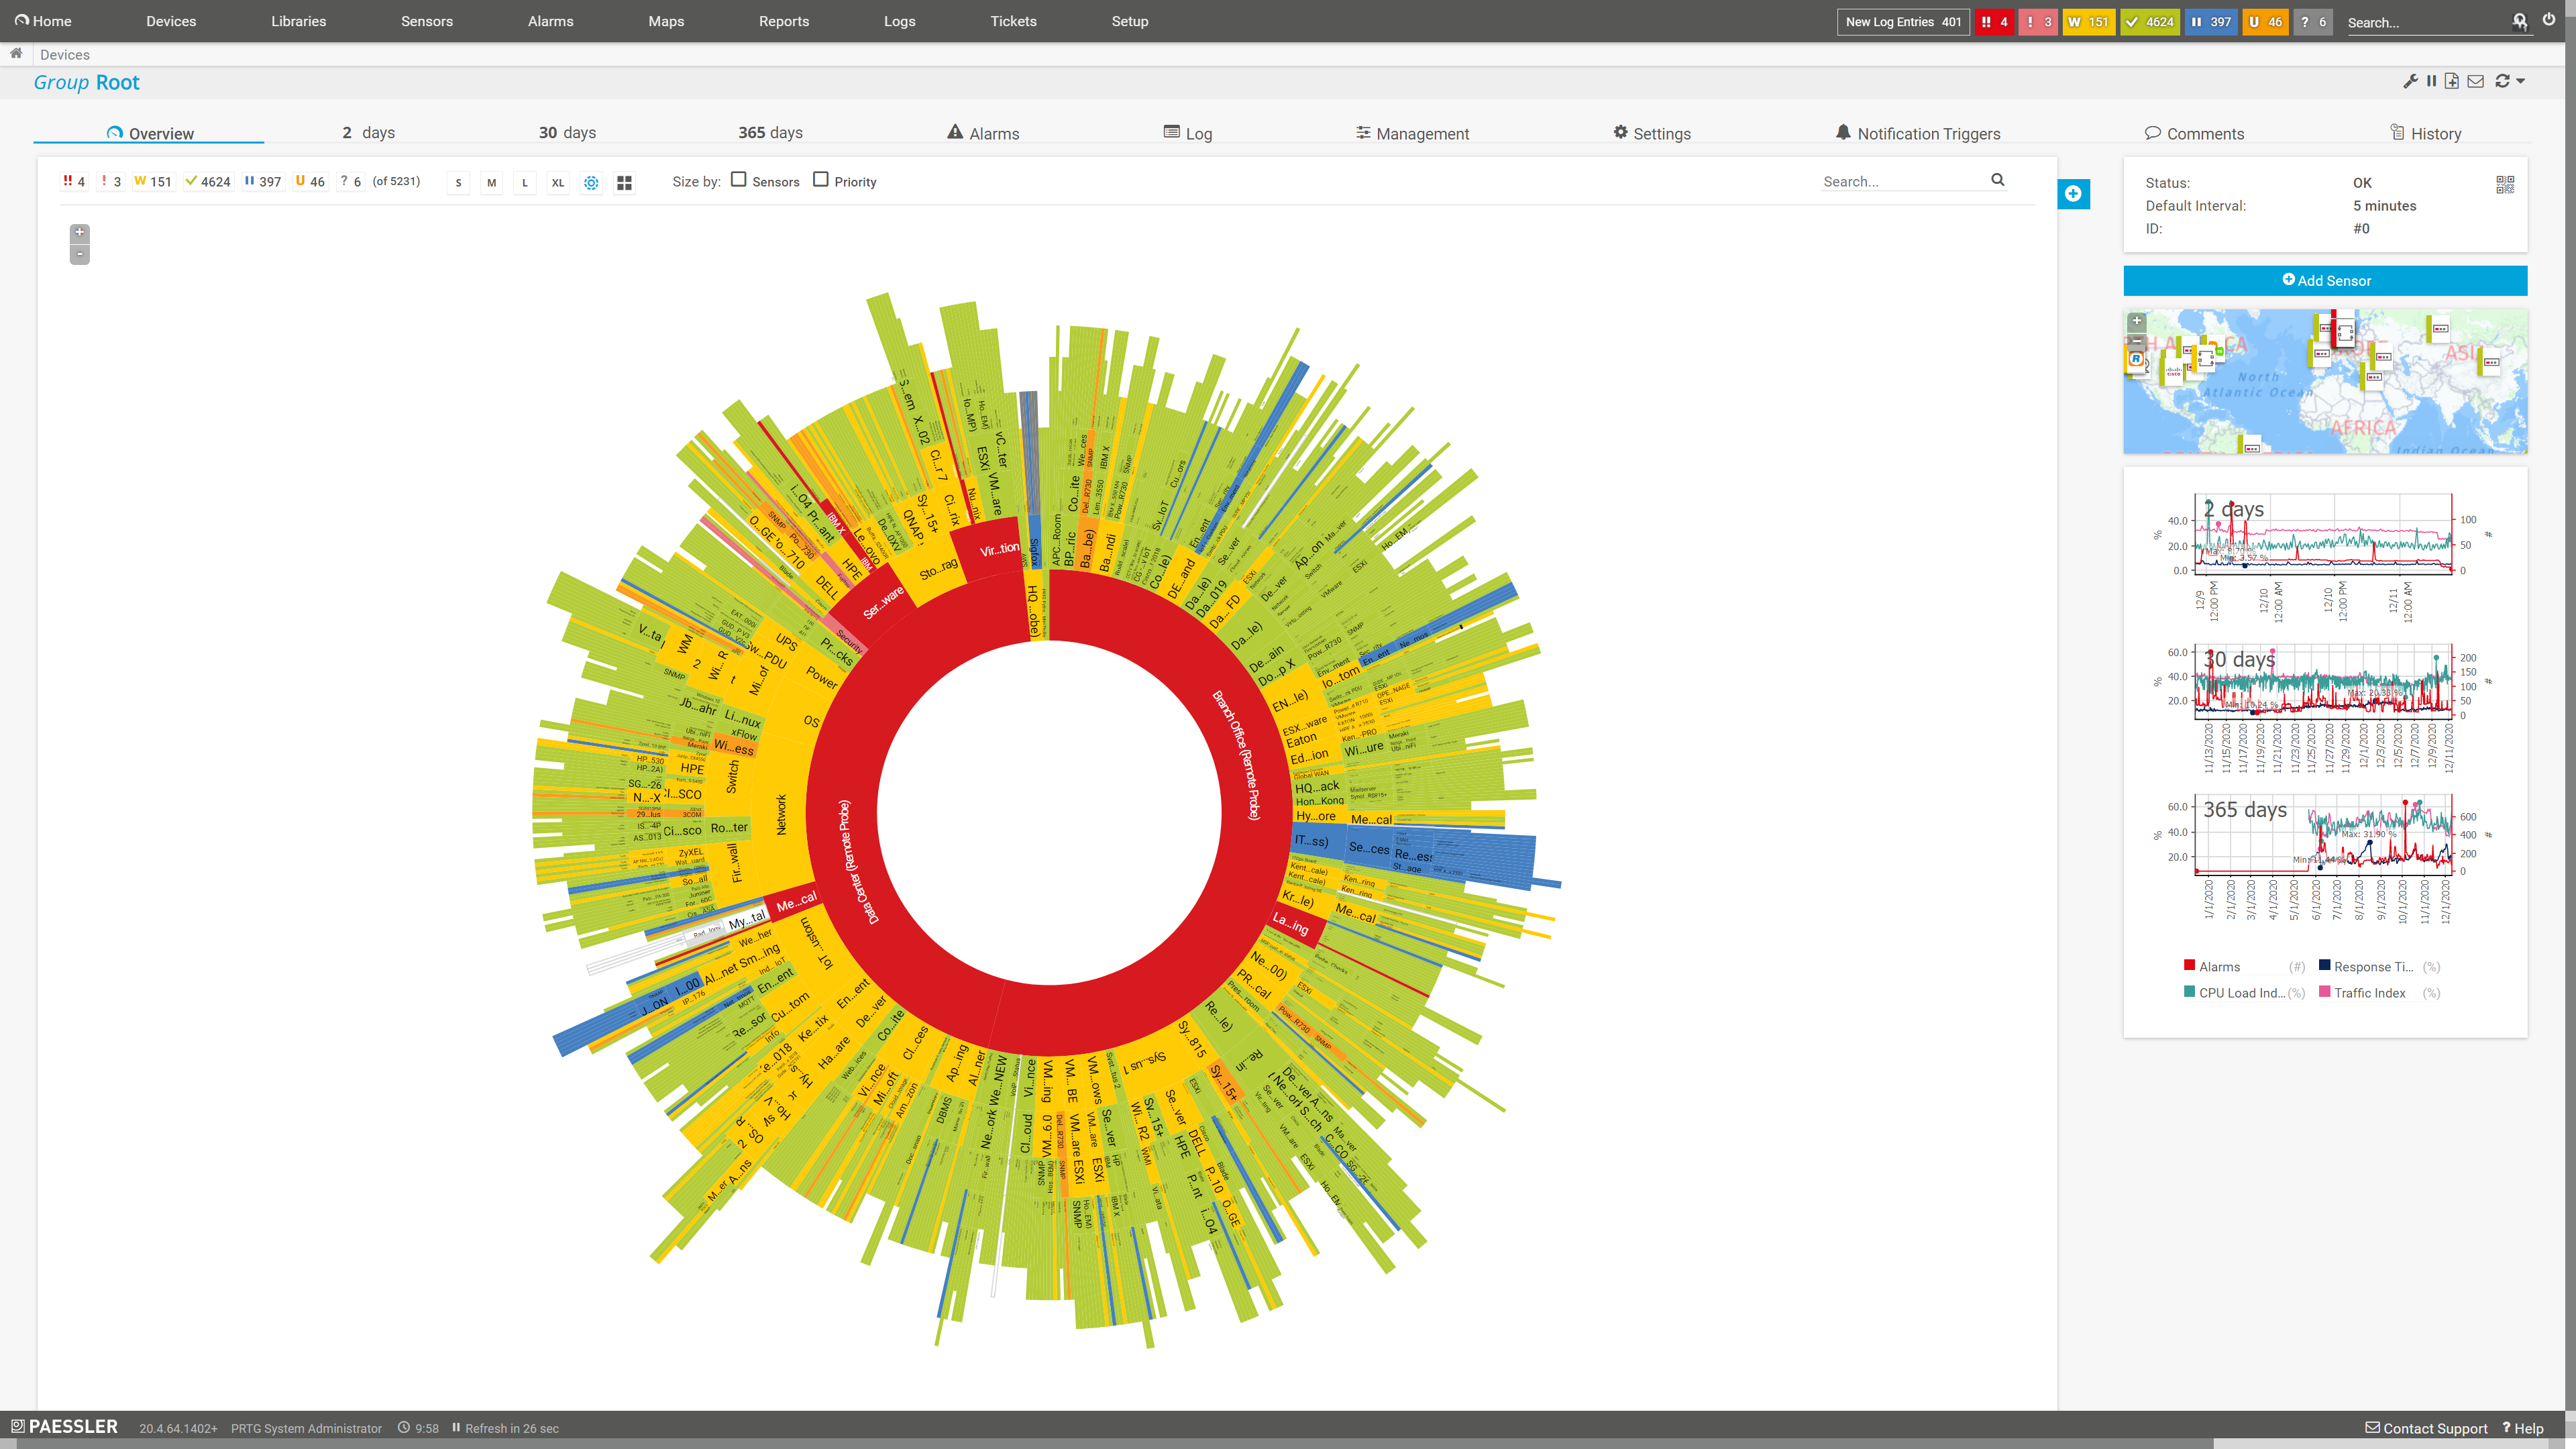
Diagnose network issues by continuously tracking servers, workstations, and other Windows machines, and applications like Microsoft IIS or Exchange. Show bandwidth usage, network traffic by IP address and protocol, CPU load, and other key metrics in real time. Visualize monitoring data in clear graphs and dashboards to identify problems more easily. Gain the overview you need to troubleshoot bottlenecks, underperformance, authentication problems, and other Windows network-related issues. 


Start monitoring using WMI with PRTG and see how it can make your network more reliable and your job easier.


PRTG is compatible with all major vendors, products, and systems


vendors applications blue


 A WMI sensor for every variable

PRTG's sophisticated WMI sensors can track every metric you could possibly think of. Our preconfigured sensors include:


WMI Battery

The WMI Battery sensor monitors the available capacity and the state of connected batteries or uninterruptible power supplies of Windows-based devices. It can show the following:

  • Battery health
  • Estimated remaining charge
  • Battery status
  • Time until battery is empty or fully charged
  • Voltage

WMI Disk Health

The WMI Disk Health sensor monitors the health of a physical disk on a Windows system. It can show the following:

  • Maximum flush latency
  • Health status
  • Operational status
  • Maximum read and write latency

WMI Event Log

The WMI Event Log sensor monitors a Windows event log file. It can show the following:

  • Number of new records
  • Custom status according to new log entry

WMI Free Disk Space (Multi Disk)

The WMI Free Disk Space (Multi Disk) sensor monitors the free disk space of one or more drives. It can show the following:

  • Free space on specified logical partitions of a hard disk
  • Total disk space

WMI Logical Disk I/O

The WMI Logical Disk I/O sensor monitors the disk usage of a logical disk or mount point on a Windows system. It can show the following:               

  • Average number of bytes per read, write, and transfer
  • Average number of items in the read and write queue
  • Average read, write, and transfer time
  • Number of disk read and write I/O operations
  • Disk read, write, and transfer speed and time

WMI Microsoft SQL Server 2019

The WMI Microsoft SQL Server 2019 sensor (also available for Microsoft SQL Server 2008, 2012, 2014, 2016, 2017) monitors the performance of a Microsoft SQL Server.

  • Average amount of wait time for each lock request that resulted in a wait
  • Number of Transact-SQL command batches received
  • Percentage of pages found in the buffer cache without having to read from disk
  • Total amount of dynamic memory the server is using for maintaining connections
  • Number of pages in the buffer pool with database content
  • Number of lock requests that resulted in a deadlock
  • Number of unrestricted full scans
  • Total number of logins started
  • And much more

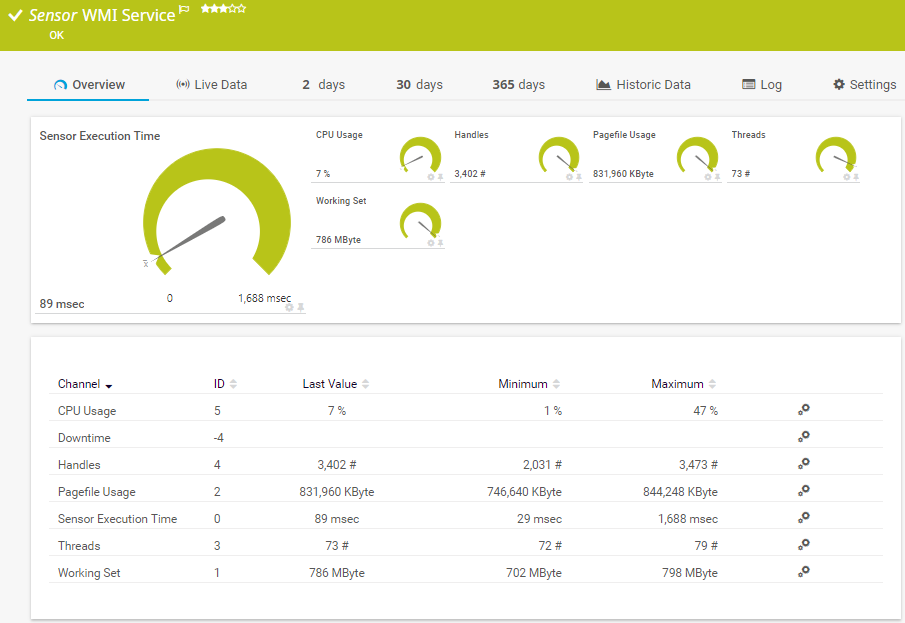
WMI Service

The WMI Service sensor monitors a Windows service. It can show the following:

  • CPU usage
  • Number of handles
  • Pagefile usage
  • Execution time of the monitoring request
  • Number of threads
  • Working set

WMI SharePoint Process

The WMI SharePoint Process sensor monitors a Microsoft SharePoint server.

  • Number of active threads
  • CPU usage
  • Number of current page requests
  • Number of SQL queries being executed
  • Global heap size
  • Object cache always live size
  • Template cache size

WMI Storage Pool

The WMI Storage Pool sensor can monitor the following:

  • Free space
  • Health status
  • Operational status

WMI Vital System Data v2

The WMI Vital System Data v2 sensor can monitor the following:

  • CLR memory bytes in all heaps
  • Total number of bytes per second
  • Committed bytes
  • Number of thrown CLR exceptions
  • Free physical memory
  • Number of outbound packet errors
  • CPU queue length
  • Total visible memory
  • CPU user time
 

Find the root cause of the problem with our PRTG WMI monitoring solution

Real-time notifications mean faster troubleshooting so that you can act before more serious issues occur.


Your WMI performance monitor at a glance – even on the go

Set up PRTG in minutes and use it on almost any mobile device.


PRTG comes with all the features you need, plus more your IT infrastructure won't want to live without.


PRTG monitors these vendors and applications in one view!


vendors vm ware


Watch our 6-minute video on WMI and SNMP sensors


Create innovative solutions with Paessler’s partners

Partnering with innovative vendors, Paessler unleashes synergies to create
new and additional benefits for joined customers.

Rittal

IT that works constitutes a business-critical basis for a company's success. Availability and security must be defined for the respective purpose and closely monitored – by OT and IT alike.

Read more

NetBrain

Integrating monitoring results from PRTG into NetBrain maps makes the foundation for network automation.

Read more

ScriptRunner

With ScriptRunner, Paessler integrates a powerful event automation platform into PRTG Network Monitor.

Read more


gartner-peer-insights-badge-color.svg

“Excellent tool for detailed monitoring. Alarms and notifications work greatly. Equipment addition is straight forward and server initial setup is very easy. ...feel safe to purchase it if you intend to monitor a large networking landscape.”

Infrastructure and Operations Engineer in the Communications Industry, firm size 10B - 30B USD

Read the entire review at Gartner Peer Insights 


PRTG makes WMI monitoring as easy as it gets

Custom alerts and data visualizations let you quickly identify and prevent health and performance issues of Windows-based devices.


Monitor WMI: FAQ


What is WMI?

The Windows Management Instrumentation (WMI) is a commonly used Microsoft standard which provides detailed data during a centralized monitoring of Windows workstations and servers. The standard is based on the DCOM (Distributed Component Object Model) communication protocol and has been an integral part of all Windows operating systems since 2000.

What is WMI monitoring?

WMI – short for Windows Management Instrumentation – is a Microsoft standard that enables sysadmins to access and manage Windows hardware, software, and network components. WMI-monitoring technology like Paessler PRTG enables agentless tracking of Microsoft servers and workstations, giving you a real-time view of their health and performance.

How do I set up WMI-monitoring in PRTG?

PRTG is designed to work out of the box. That said, your system needs to meet a number of requirements for monitoring using WMI to work properly:

  • Users sending requests must belong to the domain administrator group in the same Active Directory as the target device, and have remote access rights.
  • Activate DCOM on the PRTG server and target device. DCOM uses UDP ports between 1024 and 5000, so make sure they're open on both the PRTG server and the target device.
  • Your firewall should allow WMI requests. If the firewall is set up to group guidelines, you'll also need to activate "Enable Remote Management".
  • Antivirus software and other local security programs can block WMI connections, so make sure to double-check them
  • RPC servers on target devices run on port 135 by default. Make sure PRTG is set up to use it and that it's not blocked by other components.

How many WMI-monitoring sensors should I use simultaneously?

Because WMI can be resource-heavy, we recommend using a maximum of 200 WMI sensors per PRTG server, and a five-minute scanning interval. Alternatively, use hybrid sensors, which request data using Windows performance counters and/or WMI, or SNMP.

Can I monitor network traffic using WMI?

Yes, you can – with the Windows Network Card sensor in PRTG, you can monitor data packets, ingoing and outgoing traffic, and filter bandwidth usage by physical network port via WMI. For more light-weight traffic monitoring, we recommend using SNMP, however, which doesn’t put that much strain on your resources.

What is a sensor in PRTG?

In PRTG, “sensors” are the basic monitoring elements. One sensor usually monitors one measured value in your network, for example the traffic of a switch port, the CPU load of a server, or the free space on a disk drive.

On average, you need about 5-10 sensors per device or one sensor per switch port.


More than just a monitoring tool:
Reasons our customers love PRTG

reliability-en.svg
cost-reduction-en.svg
time-savings-en.svg


PRTG the multi-tool

PRTG: The multi-tool for sysadmins

Adapt PRTG individually and dynamically to your needs and rely on a strong API:

  • HTTP API: Access monitoring data and manipulate monitoring objects via HTTP requests
  • Custom sensors: Create your own PRTG sensors for customized monitoring
  • Custom notifications: Create your own notifications and send action triggers to external systems
  • REST Custom sensor: Monitor almost everything that provides data in XML or JSON format


Still not convinced?

love

More than 500,000
sysadmins love PRTG

Paessler PRTG is used by companies of all sizes. Sysadmins love PRTG because it makes their job a whole lot easier.

speed

Monitor your entire IT infrastructure

Bandwidth, servers, virtual environments, websites, VoIP services – PRTG keeps an eye on your entire network.

trial

Try Paessler PRTG
for free

Everyone has different monitoring needs. That’s why we let you try PRTG for free.


Paessler PRTG 

Start monitoring using WMI with PRTG and see how it can make your network more reliable and your job easier.


PRTG

Network Monitoring Software - Version 24.4.102.1351 (November 12th, 2024)

Hosting

Download for Windows and cloud-based version PRTG Hosted Monitor available

Languages

English, German, Spanish, French, Portuguese, Dutch, Russian, Japanese, and Simplified Chinese

Pricing

Up to 100 sensors for free (Price List)

Unified Monitoring

Network devices, bandwidth, servers, applications, virtual environments, remote systems, IoT, and more

Supported Vendors & Applications

More
cisco logo grey 40 dell logo grey 40 hp logo grey 40 ibm grey40 netapp grey40 linux grey40 aws grey40 windows grey40 vmware grey40 citrix grey40 exchange grey40 apache grey40 oracle grey40