Gli avvisi personalizzati e la visualizzazione dei dati consentono di identificare e prevenire rapidamente i problemi di prestazioni della rete.
È il sogno di ogni sysadmin. E' il sogno di ogni amministratore di sistema, oltre a quello di vincere la lotteria per andare in pensione alle Bahamas.
Ma anche se riusciste a raggiungerlo, il 100% di tempo di attività non servirebbe a molto se la vostra rete fosse ancora alle prese con scarsa larghezza di banda, server, firewall e altri endpoint sovraccarichi o virtual machine che funzionano come se fosse una domenica pomeriggio di agosto.
Il PRTG di Paessler tiene traccia della disponibilità, dello stato di salute e delle prestazioni di ogni componente della rete, 24 ore su 24, 7 giorni su 7. Ciò significa che scoprirete qualsiasi problema (e sarete in grado di risolverlo) prima che i vostri colleghi se ne accorgano e pianificherete in anticipo in modo che la vostra infrastruttura sia sempre ben posizionata per supportare la crescita dell'organizzazione.

Monitorate le prestazioni di tutti i componenti della rete da un'unica postazione: velocità di rete, traffico dati, utilizzo della larghezza di banda, prestazioni del server, carico della CPU, prestazioni delle applicazioni, virtualizzazione, prestazioni di Windows e molto altro ancora. PRTG monitora tutto 24 ore su 24, mostrando statistiche dettagliate in dashboard intuitivi e facili da usare.
Eliminate sul nascere problemi di rete potenzialmente gravi, come colli di bottiglia o improvvisi cali di prestazioni. Scegliete le soglie di warning e di errore che preferite e PRTG vi invierà un'e-mail, un SMS o una notifica in-app quando rischiate di andare sotto o sopra, in modo da poterli risolvere tempestivamente ed evitare interruzioni (e le lamentele dei colleghi).
Il vostro CEO ha grandi progetti di crescita. Ma la vostra infrastruttura IT è in grado di supportarli? PRTG mette a portata di mano i dati chiave sulle prestazioni - dati in tempo reale o dati storici fino a 365 giorni - in modo che possiate individuare i punti in cui siete sotto o sovradotati e fare scelte più informate su dove (e su quali dispositivi, sistemi e servizi) investire.
La vostra rete, le vostre regole. Personalizzate il potente e flessibile strumento di monitoraggio delle prestazioni di rete del PRTG in modo che risponda alle vostre esigenze. Scegliete quali componenti e parametri monitorare e come PRTG presenta i dati. Anzi, perché non creare dashboard personalizzati? Utilizzate il nostro editor di mappe integrato e trascinabile e progettate la vostra panoramica di monitoraggio nel modo che preferite.
Diagnosticare i problemi di rete monitorando continuamente i parametri delle prestazioni dell'infrastruttura di rete. Mostra l'utilizzo della larghezza di banda, le prestazioni dei server, il carico della CPU, i tempi di risposta, i modelli di traffico di rete e altre metriche chiave delle prestazioni in tempo reale. Visualizzate i dati di monitoraggio in grafici e dashboard chiari per identificare più facilmente i problemi. Ottenete la visibilità end-to-end necessaria per la risoluzione di colli di bottiglia, prestazioni insufficienti e altri problemi di prestazioni.

Grafico dei dati di traffico in tempo reale in PRTG

Albero dei dispositivi dell'intera configurazione di monitoraggio

Dashboard PRTG personalizzato per tenere sotto controllo l'intera infrastruttura IT
Grafico dei dati di traffico in tempo reale in PRTG
Albero dei dispositivi dell'intera configurazione di monitoraggio
“Monitor di rete vincente sotto tutti i punti di vista”
“La vera bellezza di PRTG sta nelle infinite possibilità che offre”
“PRTG Network Monitor
è molto difficile da superare”
Se fa parte della vostra rete, probabilmente PRTG ha un tipo di sensore (o più di uno) che potete utilizzare per tenerlo sotto controllo:
PRTG è dotato di oltre 250 tipi di sensori nativi per il monitoraggio dell'intero ambiente on-premises, cloud e cloud ibrido. Dai un'occhiata ad alcuni esempi qui sotto!
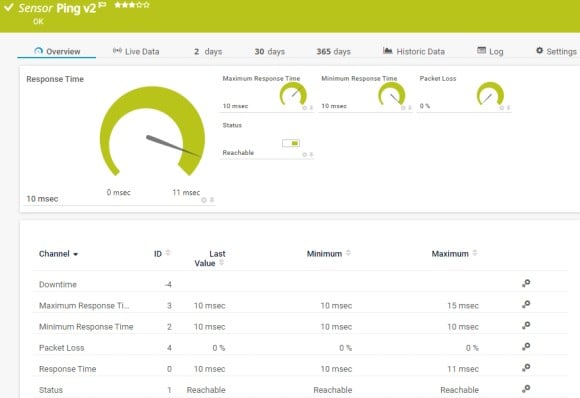
Il sensore Ping v2 invia una richiesta di eco ICMP (Internet Control Message Protocol) (“ping”) dal sistema sonda al dispositivo principale per monitorarne la disponibilità. Può mostrare quanto segue:
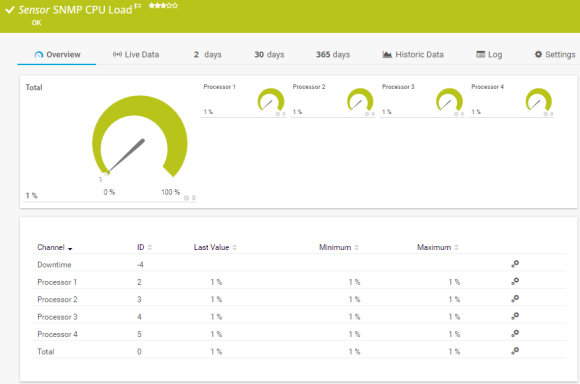
Il sensore SNMP CPU Load monitora il carico del sistema. Può mostrare quanto segue:
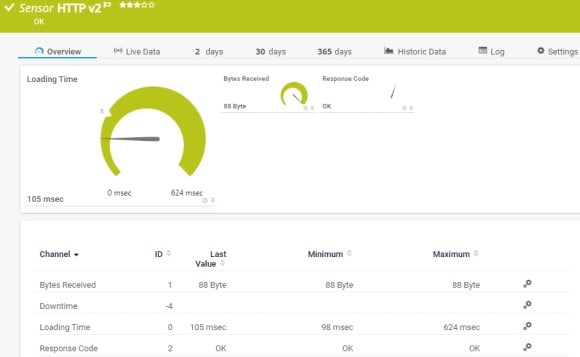
Il sensore HTTP v2 monitora un server web. Può mostrare i seguenti dati:
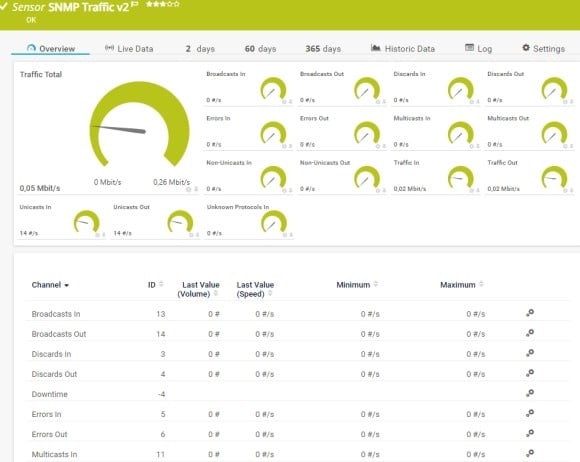
Il sensore SNMP Traffic v2 monitora la larghezza di banda e il traffico di un dispositivo. Può mostrare quanto segue:
Consulta il manuale di PRTG per un elenco di tutti i tipi di sensore disponibili.

Gli avvisi personalizzati e la visualizzazione dei dati consentono di identificare e prevenire rapidamente i problemi di prestazioni della rete.
PRTG si configura in pochi minuti e può essere utilizzato su un'ampia gamma di dispositivi mobili.

Grazie alla collaborazione con fornitori IT innovativi, Paessler libera sinergie per creare nuovi e ulteriori vantaggi per i suoi clienti.
L'integrazione dei risultati del monitoraggio di PRTG nelle mappe di NetBrain costituisce la base per l'automazione della rete.

Con ScriptRunner Paessler integra una potente piattaforma di automazione degli eventi in PRTG Network Monitor.

Siemon e Paessler uniscono la tecnologia degli edifici intelligenti e il monitoraggio avanzato e fanno sì che la tua visione di edifici e data center intelligenti diventi realtà.
Notifiche in tempo reale significano una risoluzione più rapida dei problemi, in modo da poter intervenire prima che si verifichino problemi più gravi.
Software di monitoraggio della rete – Versione 24.4.102.1351 (November 12th, 2024)
Disponibile il download della versione per Windows e della versione cloud-based PRTG Hosted Monitor
Inglese, tedesco, spagnolo, francese, portoghese, olandese, russo, giapponese e cinese semplificato
Dispositivi di rete, larghezza di banda, server, applicazioni, ambienti virtuali, sistemi remoti, IoT e molto altro
Scegli l'abbonamento a PRTG Network Monitor più adatto a te


Le prestazioni della rete si riferiscono all'efficienza e all'efficacia del trasferimento dei dati e della comunicazione all'interno di una rete di computer. Si misura in base a fattori quali la larghezza di banda, la latenza e l'affidabilità. Prestazioni di rete più elevate indicano una trasmissione di dati più veloce, ritardi minori e una connessione più stabile.
Il monitoraggio delle prestazioni di rete prevede l'osservazione e l'analisi continua delle metriche chiave di una rete informatica per garantirne la funzionalità ottimale. Questo processo include il monitoraggio di fattori quali l'utilizzo della larghezza di banda, la latenza, la perdita di pacchetti e le prestazioni dei dispositivi. Utilizzando strumenti e software di monitoraggio di rete specializzati, gli amministratori possono identificare i problemi, risolverli, ottimizzare la rete per un trasferimento efficiente dei dati e prevenire i tempi di inattività.
PRTG è uno strumento software proprietario che tiene traccia della salute e delle prestazioni di ogni componente della rete. Disponibile per server on-premise basati su Windows e Linux o come soluzione SaaS basata sul cloud, è in grado di monitorare un numero illimitato di dispositivi di rete locali, remoti e virtuali, riunendo i dati critici del sistema in un'interfaccia semplice e intuitiva a cui è possibile accedere da qualsiasi luogo: in ufficio, a casa o in viaggio. PRTG utilizza tecnologie come SNMP (Simple Network Management Protocol), packet sniffing e flow (NetFlow, jFlow, sFlow, IPFIX) per il monitoraggio delle prestazioni.
Perché è completo, infinitamente personalizzabile e adatto al monitoraggio a lungo termine, perfetto per andare a fondo di problemi intermittenti. "Certo che ne tessete le lodi", ci sentiamo dire. Ebbene, la prova del nove sta nel mangiare. Provate PRTG gratuitamente, senza vincoli, e verificate voi stessi.
Sì. Utilizzate il sensore ping v2 per verificare la disponibilità di tutti i dispositivi della rete e testare le prestazioni della rete. E se un dispositivo è collegato alla rete via Ethernet, non è un problema. Utilizzate le funzionalità di monitoraggio ethernet del PRTG per verificare le connessioni cablate e le prestazioni complessive della vostra LAN.
In PRTG, i “sensori” sono gli elementi base del monitoraggio. Un sensore monitora solitamente un valore misurato nella tua rete (ad esempio, il traffico di una porta switch, il carico della CPU di un server o lo spazio libero di un’unità disco). In media, occorrono circa 5-10 sensori per ogni dispositivo o un sensore per ogni porta switch.
Paessler ha condotto prove in oltre 600 dipartimenti IT in tutto il mondo per mettere a punto il suo software di monitoraggio di rete più vicino alle esigenze dei sysadmin. Il risultato è che più del 95% degli intervistati consiglierebbe PRTG – o lo ha già fatto.

Paessler PRTG è utilizzato da aziende di tutte le dimensioni. Gli amministratori di sistema adorano PRTG perché rende il loro lavoro molto più semplice.
Ampiezza di banda, server, ambienti virtuali, siti Web, servizi VoIP - PRTG tiene d'occhio la tua intera rete.
Tutti hanno esigenze di monitoraggio diverse. Ecco perché ti lasciamo provare PRTG gratuitamente. Inizia oggi stesso la tua prova.