Custom alerts and data visualization let you quickly identify and prevent system bottlenecks.
Effective IT systems management is the backbone of a healthy, efficient, and resilient IT infrastructure. Paessler PRTG offers a centralized and customizable management solution that addresses all your system monitoring and performance monitoring needs in one package. It integrates application management, performance tracking, asset management, and network management seamlessly across your entire IT environment.
IT operations move faster than you blink, so staying informed is of the utmost importance. PRTG’s system management software delivers real-time performance monitoring of your core IT systems – including CPU load, memory usage, disk I/O, and key network metrics – across your entire IT infrastructure.
Leverage protocols like SNMP, WMI, and SSH to collect detailed data from devices running operating systems like Linux and Windows, as well as virtual platforms like VMware and Hyper-V. It’s an all-seeing eye without the creepy vibes.
When it comes to system performance, every moment matters. PRTG offers real-time automation with customizable notifications based on specific thresholds for each monitored element. Whether a server is overheating or a network switch decides to take an unscheduled vacation, PRTG ensures you're promptly notified.
Alerts are sent directly to your mobile devices (iOS, Android), email, or via API-triggered actions, keeping you informed whether you're at your desk or grabbing a much-needed latte frapacchino with extra espresso-caffeine bombs.
Cloud environments are central to operations in a modern IT landscape. PRTG integrates with leading cloud-based providers like AWS, Azure, and Google Cloud, offering comprehensive monitoring for your cloud workloads and applications with no fuss or arguments.
Dedicated sensors access AWS CloudWatch and Azure Monitor, bringing transparency to your cloud environments and making sure your services run smoothly and efficiently – like a well-oiled machine without the greasy mess.
IT management doesn't have to be chaotic. PRTG's intuitive, customizable dashboard centralizes data from your network, servers, and applications into a single cohesive view.
Visualize workloads, troubleshoot problems, and optimize your infrastructure – all from one place. It’s a sci-fi command station, and you’re the captain. And with real-time alerts, your crew of monitoring experts is on standby 24/7/365.
Diagnose network issues by continuously tracking system performance metrics. Show CPU load, memory usage, and other key metrics in real time. Visualize monitoring data in clear graphs and dashboards to identify problems more easily. Gain the overview you need to troubleshoot system bottlenecks effectively.

Live traffic data graph in PRTG

Device tree view of the complete monitoring setup

Custom PRTG dashboard for keeping an eye on the entire IT infrastructure
Live traffic data graph in PRTG
Device tree view of the complete monitoring setup
“All-around winning
network monitor”
“The real beauty of PRTG is the endless possibilities it offers”
“PRTG Network Monitor
is very hard to beat”
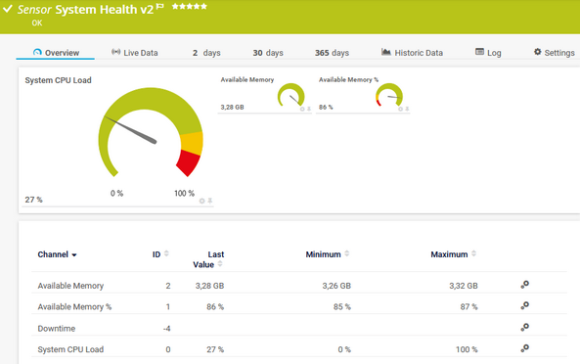
PRTG comes with more than 250 native sensor types for monitoring your entire on-premises, cloud, and hybrid cloud environment out of the box. Check out some examples below!
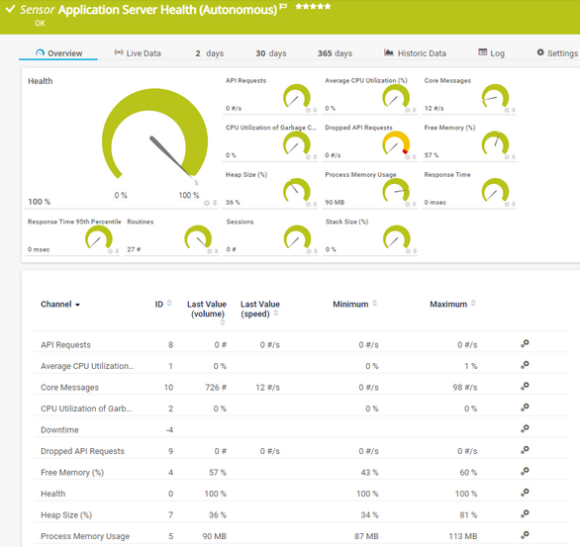
The Application Server Health (Autonomous) sensor monitors the health of the PRTG application server and checks various parameters that can affect the quality of the monitoring results. It can show the following:
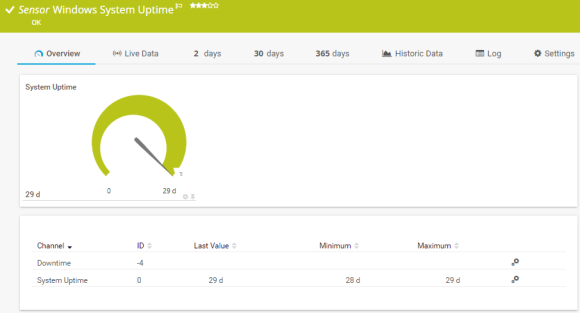
The Windows System Uptime sensor monitors the uptime of a Windows system via Windows Management Instrumentation (WMI) or Windows performance counters. It can show the following:
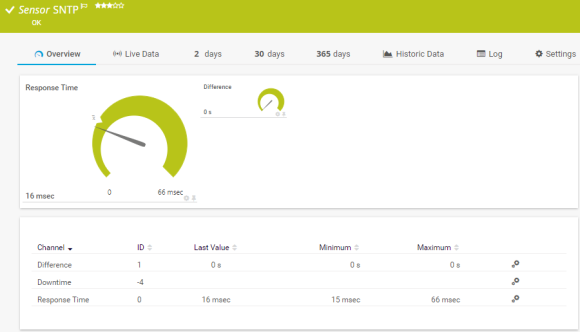
The SNTP sensor monitors a Simple Network Time Protocol (SNTP) server. It can show the following:
See the PRTG Manual for a list of all available sensor types.

Custom alerts and data visualization let you quickly identify and prevent system bottlenecks.
PRTG is set up in a matter of minutes and can be used on a wide variety of mobile devices.


“Excellent tool for detailed monitoring. Alarms and notifications work greatly. Equipment addition is straight forward and server initial setup is very easy. ...feel safe to purchase it if you intend to monitor a large networking landscape.”
Partnering with innovative IT vendors, Paessler unleashes synergies to create
new and additional benefits for joined customers.
By integrating PRTG with Martello iQ, you can add a fast analytics layer to improve uptime, visualize your IT environment, and integrate all of your IT systems into a single pane of glass.

Paessler and Plixer provide a complete solution adding flow and metadata analysis to a powerful network monitoring tool.

Siemon and Paessler bring together intelligent building technology and advanced monitoring and make your vision of intelligent buildings and data centers become reality.
Real-time notifications mean faster troubleshooting so that you can act before more serious issues occur.
Network Monitoring Software – Version 24.4.102.1351 (November 12th, 2024)
Download for Windows and cloud-based version PRTG Hosted Monitor available
English, German, Spanish, French, Portuguese, Dutch, Russian, Japanese, and Simplified Chinese
Network devices, bandwidth, servers, applications, virtual environments, remote systems, IoT, and more
Choose the PRTG Network Monitor subscription that's best for you


PRTG uses SNMP to monitor bandwidth usage across network interfaces, supporting devices like switches, routers, and firewalls. For detailed traffic analysis, it can utilize NetFlow, sFlow, or IPFIX protocols, helping you identify and resolve bandwidth issues efficiently. This level of performance monitoring ensures your network management is proactive and effective—like spotting a traffic jam before you leave home.
PRTG employs SSH sensors for Linux and WMI sensors for Windows to monitor application metrics like CPU and memory usage. Customize sensors to check process uptime, port availability, and other key metrics, ensuring optimal application performance. It's like having a dedicated watchdog for each of your applications, without the barking.
Yes, PRTG's automation features allow you to run scripts, send notifications, or trigger external systems via API when specific conditions are met, such as high CPU usage. This enables proactive management and swift issue resolution, streamlining your IT workflows. Think of it as setting up dominoes—in a good way—where one event triggers the next for seamless operations.
PRTG integrates with virtualization platforms using sensors designed for VMware and Hyper-V. These collect data on host and VM metrics, allowing you to optimize workloads and manage your virtual environments effectively. It's like having X-ray vision into your virtual machines, revealing what's happening beneath the surface.
The PRTG API lets you extend monitoring capabilities and integrate with other management solutions or custom tools. Create custom sensors, retrieve data, automate actions, and configure the system programmatically to meet your unique needs. It's like giving PRTG a toolbox full of gadgets, ready to customize your systems management just the way you like it.
Elevate your IT systems management with PRTG—a solution that simplifies workflows, optimizes performance, and works tirelessly to support your demanding IT environment. It's the trusty sidekick every IT superhero needs.
In PRTG, “sensors” are the basic monitoring elements. One sensor usually monitors one measured value in your network, for example the traffic of a switch port, the CPU load of a server, or the free space on a disk drive. On average, you need about 5-10 sensors per device or one sensor per switch port.
Paessler conducted trials in over 600 IT departments worldwide to tune its network monitoring software closer to the needs of sysadmins. The result of the survey: over 95% of the participants would recommend PRTG – or already have.

Paessler PRTG is used by companies of all sizes. Sysadmins love PRTG because it makes their job a whole lot easier.
Bandwidth, servers, virtual environments, websites, VoIP services – PRTG keeps an eye on your entire network.
Everyone has different monitoring needs. That’s why we let you try PRTG for free.