Custom alerts and data visualization let you quickly identify and prevent status errors, unresponsive applications, and other performance issues.
They pump the data, processing tools, and other vital resources your colleagues need to do their jobs well. And one small, skipped beat – or performance problem – can slow down your network to the point where your organization risks grinding to a halt.
Paessler PRTG provides a single unified view of every application on your network – from hardware-based apps to virtual systems – so it's easy to keep track of critical stats, spot problems before they cause disruption, and ensure your organization stays heart-healthy.

All your applications' critical stats, at your fingertips: server applications (databases, email, Exchange), cloud environments (Azure, AWS, Google Cloud), web applications (Zoom, Microsoft 365), virtualized applications (Citrix, VMware, Docker Container), plus standard Windows applications such as SharePoint, FTP, and Active Directory.
Pick your preferred warning and error thresholds for the various application performance metrics you want to keep an eye on. Get notified as soon as an application is at risk of going under or over these thresholds. This ensures you're using your resources efficiently, helps avoid network disruption, and allows you to leave the office at a reasonable hour.
Can't find a preconfigured sensor for a specific app? You can easily create a custom sensor that's tailor-made to your needs. Pick the predefined PRTG sensor that most closely matches your requirements from our extensive library, and create your custom .exe script. PRTG will take it from there.
Diagnose network issues by continuously tracking server, cloud, web, and virtual applications across your network. Show application health, usage, dependencies, and other performance metrics in real time. Visualize monitoring data in clear graphs and dashboards to identify problems more easily. Gain the network visibility you need to troubleshoot and debug root causes of application performance issues.

Device tree view of the complete monitoring setup

Custom PRTG dashboard for keeping an eye on the entire IT infrastructure

Live traffic data graph in PRTG
“All-around winning
network monitor”
“The real beauty of PRTG is the endless possibilities it offers”
“PRTG Network Monitor
is very hard to beat”
PRTG monitors your applications, application servers, and services using sophisticated sensors. Each sensor tracks a specific variable, and the stats are brought together on a single, intuitive dashboard so you can keep an eye on every application that runs on your network from one place. This also includes specialized use cases like game monitoring, allowing you to keep track of gaming servers and applications with ease.
Here are just a few examples of what PRTG's more than 250 preconfigured sensors can monitor:
PRTG comes with more than 250 native sensor types for monitoring your entire on-premises, cloud, and hybrid cloud environment out of the box. Check out some examples below!
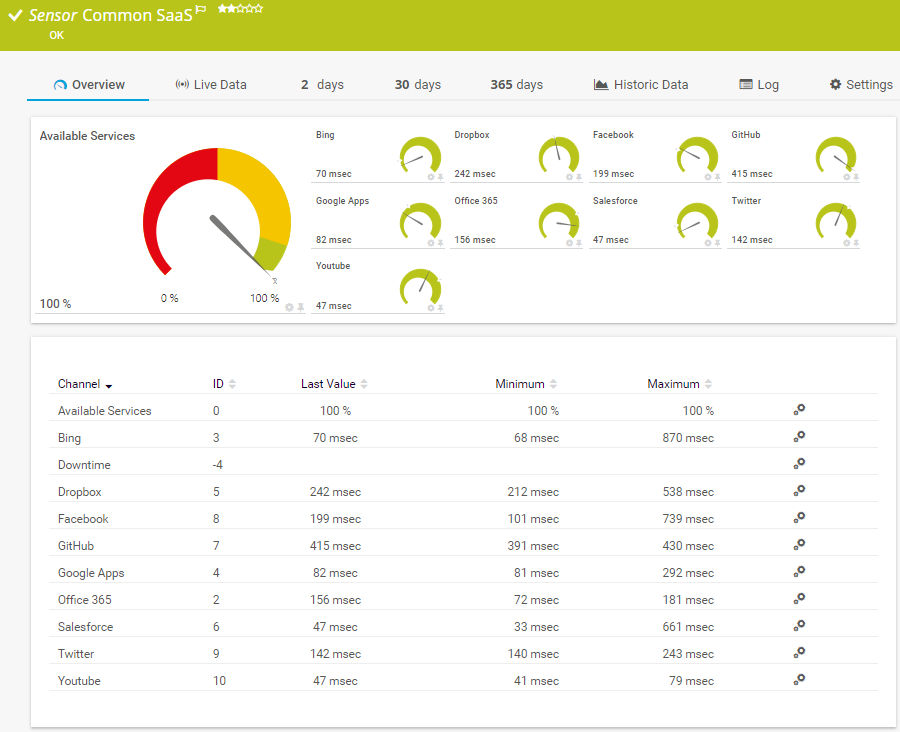
The Common SaaS sensor monitors the availability of several Software-as-a-Service (SaaS) providers. It can show the following:
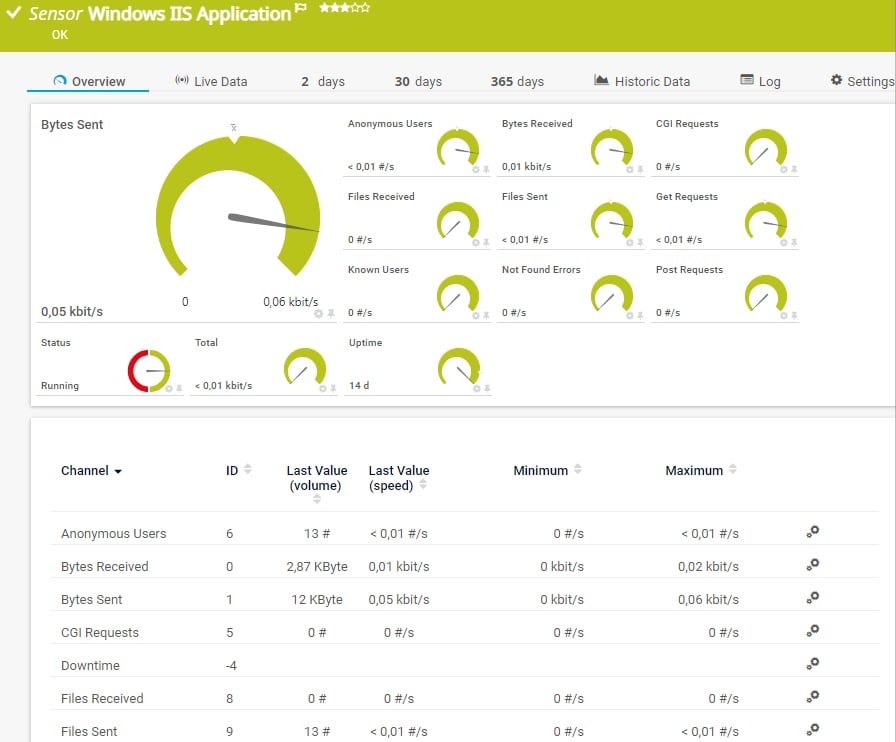
The Windows IIS Application sensor monitors a Microsoft Internet Information Services (IIS) server via Windows Management Instrumentation (WMI). It can also monitor applications that use IIS, such as Microsoft SharePoint or Microsoft Reporting Services (SSRS). It can show the following and more:
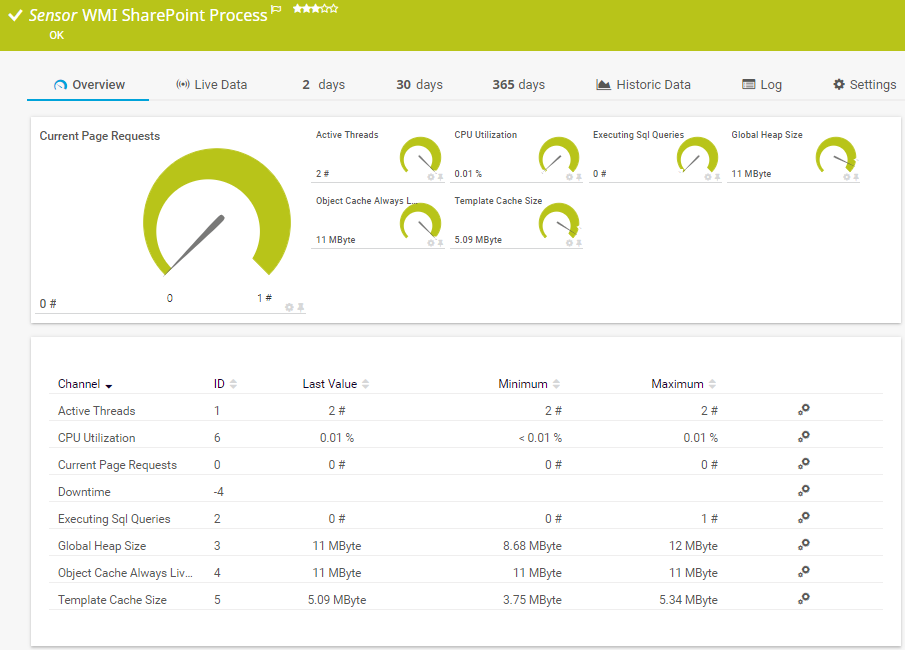
The WMI SharePoint Process sensor monitors a Microsoft SharePoint server. It can show the following:
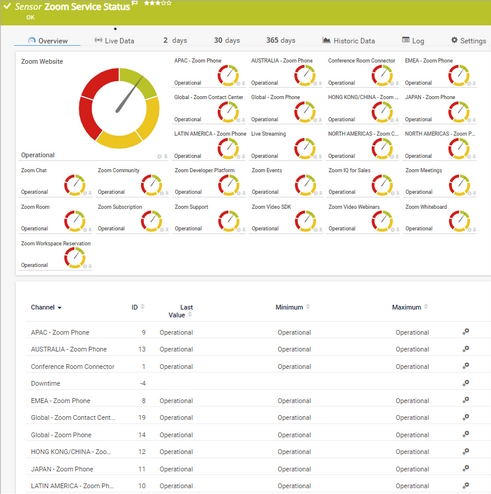
The Zoom Service Status sensor monitors the overall status of Zoom groups. It can show the following:
See the PRTG Manual for a list of all available sensor types.

Custom alerts and data visualization let you quickly identify and prevent status errors, unresponsive applications, and other performance issues.
PRTG is set up in a matter of minutes and can be used on a wide variety of mobile devices.


“Excellent tool for detailed monitoring. Alarms and notifications work greatly. Equipment addition is straight forward and server initial setup is very easy. ...feel safe to purchase it if you intend to monitor a large networking landscape.”
Partnering with innovative IT vendors, Paessler unleashes synergies to create
new and additional benefits for joined customers.
Combining PRTG’s broad monitoring feature set with IP Fabric’s automated network assurance creates a new level of network visibility and reliability.
With ScriptRunner Paessler integrates a powerful event automation platform into PRTG Network Monitor.
Combining their tools to a powerful solution for advanced analysis and automation, KnowledgeRiver and Paessler enable IT teams to ensure best performance for their infrastructure and networks.
Real-time notifications mean faster troubleshooting so you can act before more serious issues occur.
Network Monitoring Software – Version 26.1.116.1532 (February 9th, 2026)
Download for Windows and cloud-based version PRTG Hosted Monitor available
English, German, Spanish, French, Portuguese, Dutch, Russian, Japanese, and Simplified Chinese
Network devices, bandwidth, servers, applications, virtual environments, remote systems, IoT, and more
Choose the PRTG Network Monitor subscription that's best for you


An application refers to a software program or set of programs designed to perform a specific task or function for end users, businesses, or other software applications. Applications are the tools that allow users to interact with computers and computer systems to accomplish various tasks.
There are various types of applications, including:
Application monitoring involves the continuous tracking and analysis of software applications to ensure optimal performance, identify issues, and maintain a positive end-user experience. Application monitoring tools include monitoring various metrics such as response times, error rates, and resource utilization to detect anomalies or potential problems. This proactive approach allows IT teams to address issues promptly, minimize downtime, and optimize application performance.
Application management encompasses a broader set of activities involved in the lifecycle of an application. It includes tasks such as installation, configuration, updating, and overall administration of applications. Application performance management also involves activities related to user access, security, and ensuring that applications align with business objectives. It focuses on the overall governance and maintenance of applications throughout their lifecycle.
APM specifically targets the performance aspects of applications. Application performance monitoring tools and practices are designed to monitor and analyze various performance metrics, such as response times, resource utilization, and error rates. The goal of APM tools is to identify bottlenecks, inefficiencies, or issues affecting the performance of an application. By closely monitoring these metrics, APM helps organizations optimize application performance, enhance user experience, and troubleshoot performance-related issues.
PRTG is a proprietary software tool that tracks the availability and performance of every application that runs on your network. Available for Windows-based on-premises servers or as a cloud-hosted solution, it's capable of monitoring unlimited web applications, server applications, cloud applications, virtual applications, and more, bringing critical system data together in one simple, intuitive interface you can access from anywhere: at the office, at home, or on the go.
PRTG is way more than an application performance or web application monitoring tool: it can keep an eye on your whole IT infrastructure, no matter how complex. We have preconfigured sensors to track a wide range of values, including network traffic, bandwidth, cloud services, availability & uptime, ports, IP addresses, hardware health, network security, and web services. You can also monitor industrial IT and OT environments using OPC UA, MQTT, or Modbus, and create custom integrations with our API.
In PRTG, “sensors” are the basic monitoring elements. One sensor usually monitors one measured value in your network, for example the traffic of a switch port, the CPU load of a server, or the free space on a disk drive. On average, you need about 5-10 sensors per device or one sensor per switch port.
Paessler conducted trials in over 600 IT departments worldwide to tune its network monitoring software closer to the needs of sysadmins. The result of the survey: over 95% of the participants would recommend PRTG – or already have.

Paessler PRTG is used by companies of all sizes. Sysadmins love PRTG because it makes their job a whole lot easier.
Bandwidth, servers, virtual environments, websites, VoIP services – PRTG keeps an eye on your entire network.
Everyone has different monitoring needs. That’s why we let you try PRTG for free.