Custom alerts and data visualization let you quickly identify and prevent performance bottlenecks.
Are you struggling to keep your applications running at peak performance? PRTG makes application performance monitoring easy and effective. Get real-time insight into your application stack, identify performance bottlenecks and resolve issues before they impact end users. Take control of your applications and ensure a seamless experience for your team and customers.
Monitor applications, servers, and network devices to ensure optimal performance across your IT infrastructure. PRTG supports popular apps like Exchange, SharePoint, and SQL Server, giving you detailed insights into their performance. This helps you detect and resolve performance issues faster, ensuring smooth business operations.
Create intuitive dashboards that display real-time performance metrics for quick analysis and decision-making. Tailor dashboards to track key data from applications like Microsoft Teams, SAP, or VMware. Visualizations simplify complex data, helping teams spot trends and anomalies at a glance.
Integrate PRTG with existing tools and platforms to streamline workflows and enhance monitoring efficiency. PRTG works seamlessly with APIs for DevOps tools like Kubernetes, Jenkins, or Docker. This ensures you can embed application performance monitoring into your existing IT ecosystem without disruption.
Adapt PRTG to your organization's growth, ensuring consistent monitoring as your infrastructure expands. From monitoring small business tools to enterprise-grade applications like Salesforce or Oracle, PRTG scales effortlessly. Its licensing model offers flexibility for businesses of all sizes and needs.
Diagnose network issues by continuously tracking application performance data. Show response times, error rates and other key metrics in real time. Visualize monitoring data in clear graphs and dashboards to identify problems more easily. Gain the overview you need to troubleshoot application performance issues.
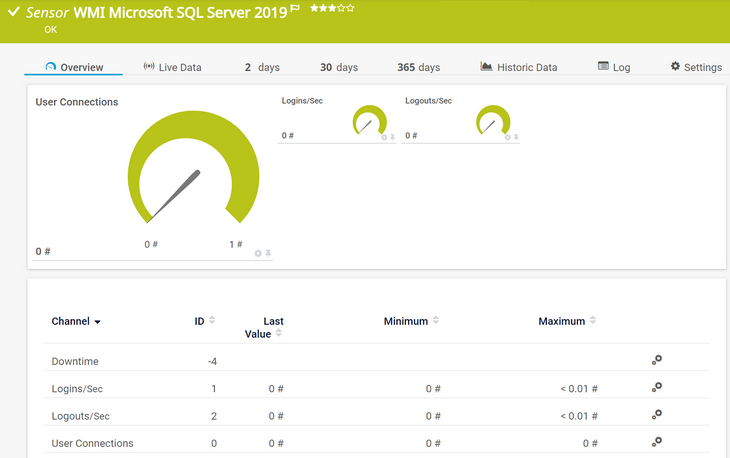
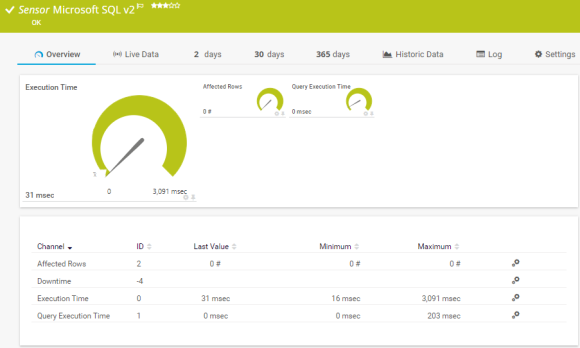
WMI Microsoft SQL Server sensor in PRTG

Device tree view of the complete monitoring setup
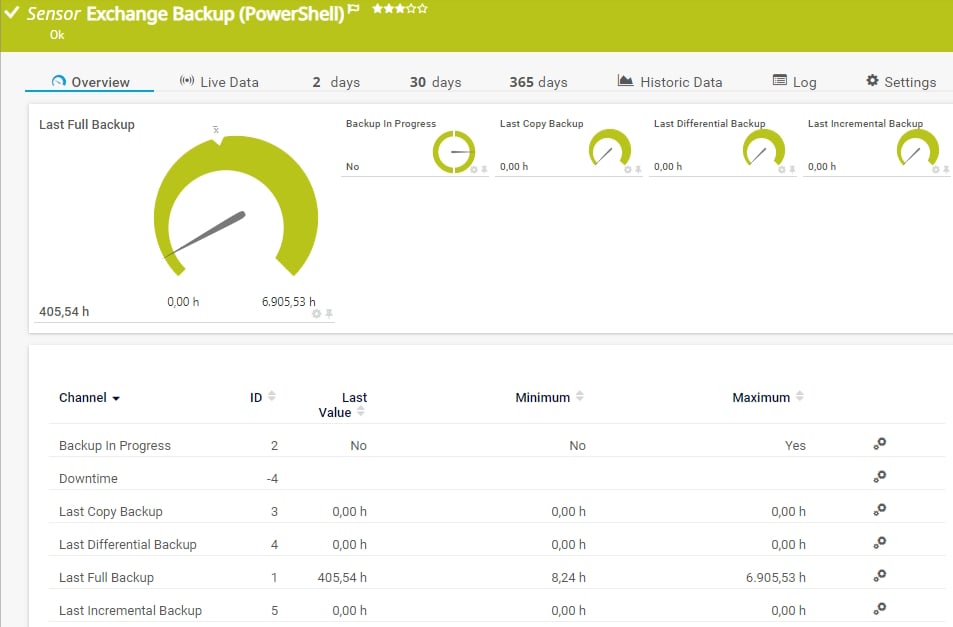
Monitoring Exchange Backup in PRTG
WMI Microsoft SQL Server sensor in PRTG
Device tree view of the complete monitoring setup
“All-around winning
network monitor”
“The real beauty of PRTG is the endless possibilities it offers”
“PRTG Network Monitor
is very hard to beat”
PRTG combines powerful functionality with ease-of-use when it comes to application performance monitoring. Whether you manage a complex IT environment or a smaller infrastructure, PRTG adapts to your needs. From transparent pricing to reliable customer support, it is designed to make monitoring stress-free for everyone in the IT team.
PRTG offers clear subscription plans, so you only pay for what you need. There are no hidden costs or surprises, making it easy to scale your monitoring efforts. This flexibility allows you to implement advanced application monitoring for companies of any size.
PRTG minimizes complexity with an easy installation process and an intuitive user interface. You can start monitoring your applications and infrastructure within minutes. No steep learning curve means you can focus on getting results right away.
Monitor everything from cloud-native applications to on-premises systems with a single tool. PRTG keeps pace with the demands of modern IT environments, including Kubernetes and serverless technologies. Its comprehensive support covers even the most dynamic infrastructures.
Get the help you need, when you need it, with expert support from an experienced team. With fast response times and a focus on solutions, our support team makes sure your monitoring runs smoothly. We can guide you through setup, integration, and troubleshooting.
PRTG comes with more than 250 native sensor types for monitoring your entire on-premises, cloud, and hybrid cloud environment out of the box. Check out some examples below!
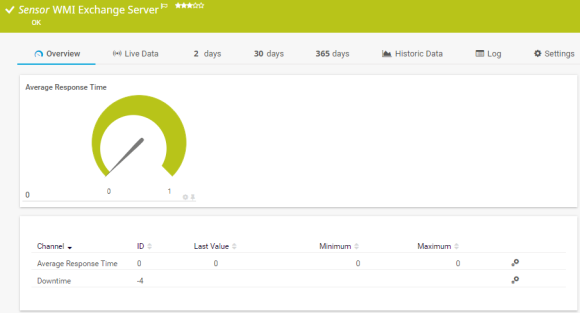
The WMI Exchange Server sensor monitors a Microsoft Exchange Server as of version 2016. It can show the following:
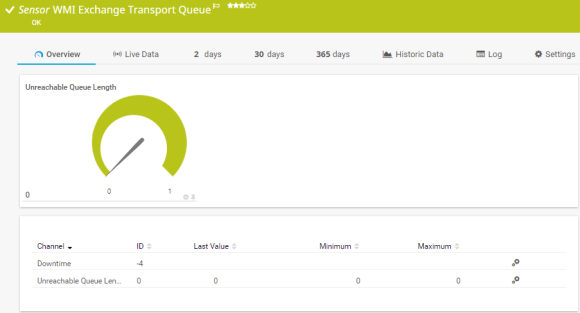
The WMI Exchange Transport Queue sensor monitors the length of transport queues of a Microsoft Exchange Server as of version 2016. It can show the following and more:
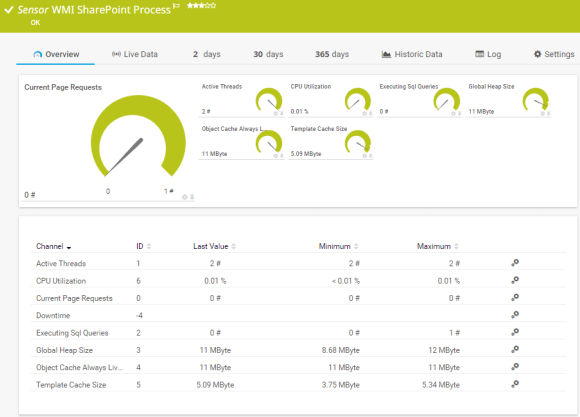
The WMI SharePoint Process sensor monitors a Microsoft SharePoint server. It can show the following:
The Microsoft SQL v2 sensor monitors a database on a Microsoft SQL server and executes a query. It can show the following:
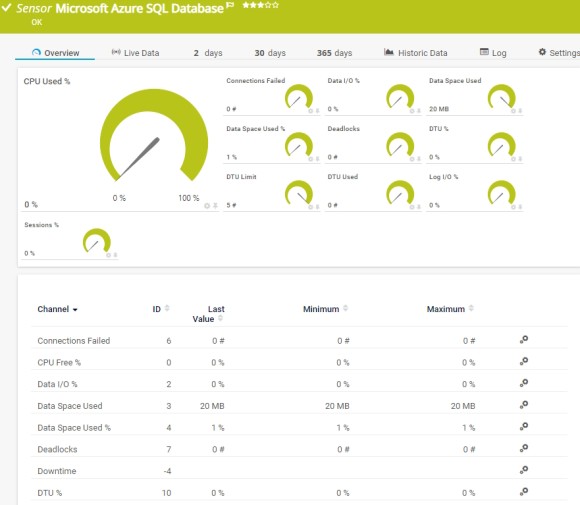
The Microsoft Azure SQL Database sensor monitors the metrics of an Azure SQL Database (single database or elastic pool) in a Microsoft Azure subscription. It can show the following:
See the PRTG Manual for a list of all available sensor types.

Custom alerts and data visualization let you quickly identify and prevent performance bottlnecks.
PRTG is set up in a matter of minutes and can be used on a wide variety of mobile devices.

Paessler is a certified partner in the Amazon Web Services ecosystem, which includes a growing community of software vendors who are building solutions on cloud computing.
What does this mean for you?
Partnering with innovative IT vendors, Paessler unleashes synergies to create
new and additional benefits for joined customers.

baramundi and PRTG create a secure, reliable and powerful IT infrastructure where you have everything under control - from the traffic in your firewall to the configuration of your clients.
IT that works constitutes a business-critical basis for a company's success. Availability and security must be defined for the respective purpose and closely monitored – by OT and IT alike.
Integrating monitoring results from PRTG into NetBrain maps makes the foundation for network automation.
Real-time notifications mean faster troubleshooting so that you can act before more serious issues occur.
Network Monitoring Software – Version 24.4.102.1351 (November 12th, 2024)
Download for Windows and cloud-based version PRTG Hosted Monitor available
English, German, Spanish, French, Portuguese, Dutch, Russian, Japanese, and Simplified Chinese
Network devices, bandwidth, servers, applications, virtual environments, remote systems, IoT, and more
Choose the PRTG Network Monitor subscription that's best for you
An application performance monitoring (APM) tool tracks the performance of software applications to ensure they are running efficiently and delivering a seamless end-user experience. APM tools monitor key metrics such as response times, error rates, and resource utilization to detect performance issues. These tools help identify bottlenecks, improve digital experiences, and ensure high availability for modern applications.
PRTG provides a comprehensive APM solution for IT teams by monitoring application performance across infrastructure and networks. It provides full-stack observability with insight into latency, resource utilization and end-user experience. Using advanced dashboards and customizable alerts, IT teams can troubleshoot performance issues and ensure application reliability in both cloud and on-premises environments.
Yes, PRTG supports modern application architectures including microservices, SaaS and serverless platforms. With its flexible instrumentation and compatibility with observability platforms such as OpenTelemetry, PRTG monitors the performance of distributed applications and detects problems in backend and frontend components. This ensures the seamless operation of web applications and cloud-native software.
PRTG includes database monitoring features that allow users to track query performance, response times and resource utilization. These insights help to optimize database efficiency, reduce bottlenecks and ensure high performance for software applications that rely on backend databases. This makes PRTG an essential tool for maintaining seamless workflows and customer experiences.
Yes, PRTG helps reduce Mean Time to Resolution (MTTR) by providing real-time diagnostics and root cause analysis. Our monitoring solution uses telemetry data to pinpoint performance problems and provides actionable insights for faster troubleshooting. IT teams can quickly identify the root cause of problems, minimize downtime and improve overall application lifecycle management.
PRTG is very versatile and supports a wide range of use cases, including IT operations, IoT and machine learning applications. It tracks resource utilization, performance metrics and network dependencies in hybrid environments. Whether monitoring IoT devices or machine learning workloads, PRTG ensures reliable performance and supports decision-making with actionable data.
PRTG improves observability by providing end-to-end monitoring of applications, infrastructure and networks. The tool integrates data from multiple sources, such as APIs, to provide a comprehensive view of performance. This approach helps IT teams maintain control over application performance and deliver consistent customer experiences in complex environments.
In PRTG, “sensors” are the basic monitoring elements. One sensor usually monitors one measured value in your network, for example the traffic of a switch port, the CPU load of a server, or the free space on a disk drive. On average, you need about 5-10 sensors per device or one sensor per switch port.
Paessler conducted trials in over 600 IT departments worldwide to tune its network monitoring software closer to the needs of sysadmins. The result of the survey: over 95% of the participants would recommend PRTG – or already have.

Paessler PRTG is used by companies of all sizes. Sysadmins love PRTG because it makes their job a whole lot easier.
Bandwidth, servers, virtual environments, websites, VoIP services – PRTG keeps an eye on your entire network.
Everyone has different monitoring needs. That’s why we let you try PRTG for free.