


Custom alerts and data visualization let you quickly identify and prevent hardware, software, and IT infrastructure issues.
When you’re in data analytics, network management, or systems administration, you already know specific threshold alerts are time, money, and resource savers. Threshold monitoring with Paessler PRTG helps you gain even more control of your network and IT infrastructure, including devices, systems, traffic, and applications.
Diagnose network issues by continuously tracking hardware, applications, web services, and more, using custom threshold baselines. Show bandwidth usage, availability, CPU utilization, and other key metrics in real time. Visualize monitoring data in clear graphs and dashboards to identify problems more easily. Gain the overview you need to troubleshoot network and infrastructure issues based on performance thresholds.

Device tree view of the complete monitoring setup

Custom PRTG dashboard for keeping an eye on the entire IT infrastructure

Live traffic data graph in PRTG
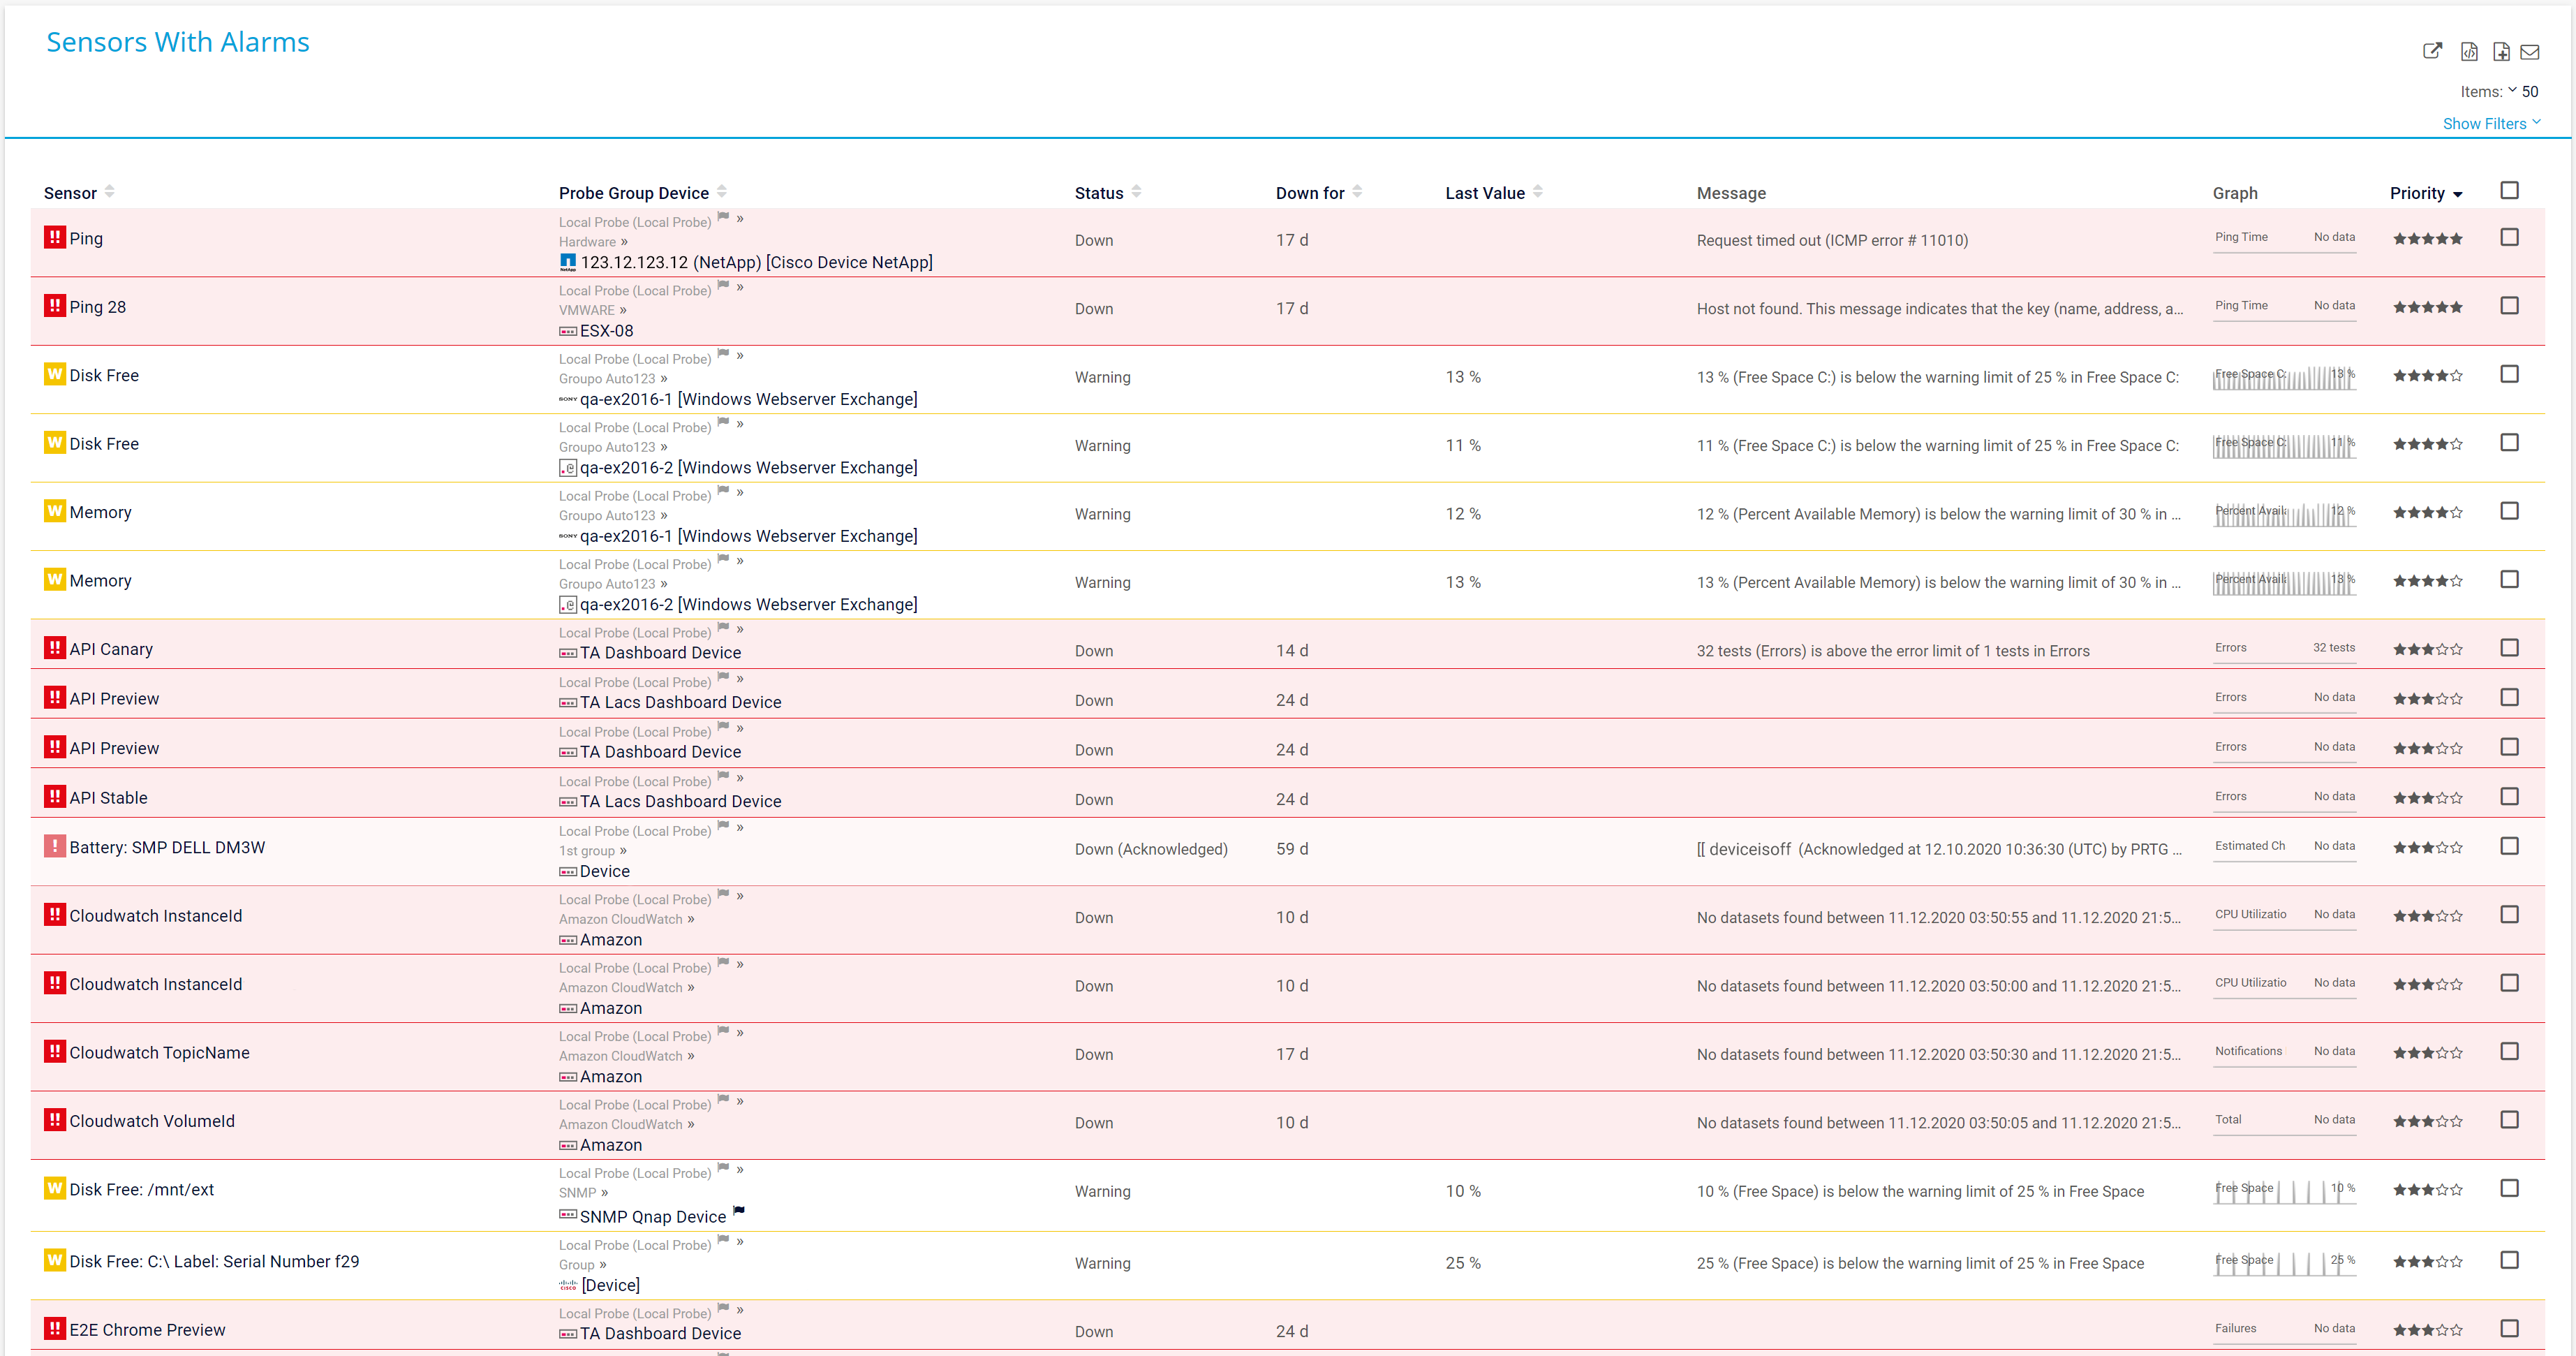
PRTG Sensor Alarm Overview
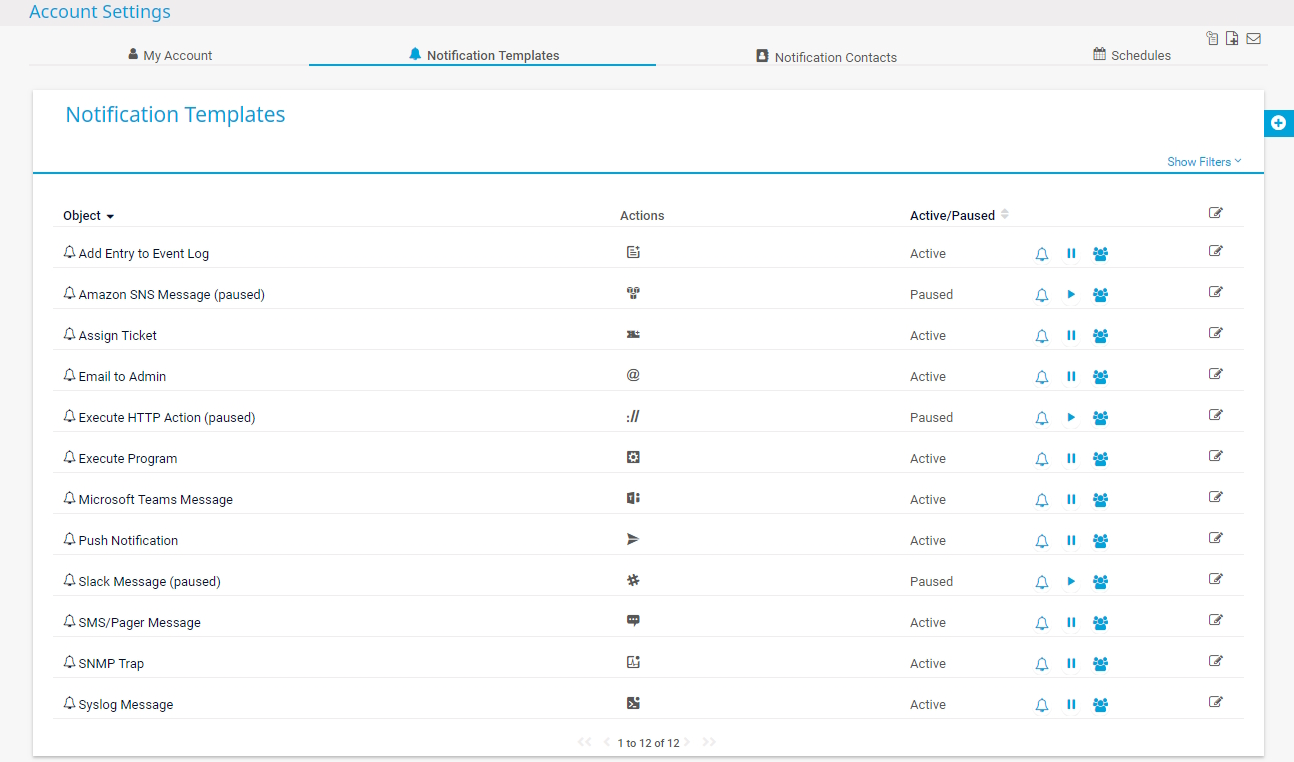
Notififaction Methods with PRTG
“All-around winning
network monitor”
“The real beauty of PRTG is the endless possibilities it offers”
“PRTG Network Monitor
is very hard to beat”
PRTG gives you the power to monitor and manage your entire network and IT environment across servers, devices, vendors, service providers, and more.
PRTG can be fully integrated into your network or only monitor a single device. It’s up to you how many devices you monitor in your network. It just needs an IP address to add it to your monitoring setup. Customize PRTG to meet your own needs and requirements.
Don’t get bothered by unnecessary alerts. PRTG makes it easy to configure your threshold values to match the needs of your IT ecosystem.
Set your threshold alerts to higher sensitivity for critical devices adversely affected by minor deviations. Set them to lower sensitivities for systems and devices that have a higher performance variability, so you aren’t bothered by unnecessary alerts.
View the status and health of your devices at a single glance. Using a simple traffic lights system for visualizing warnings (yellow), errors (red), and everything that’s running as expected (green), you can see immediately when an issue arises.
You can also create reports of capacities over specific time periods to recognize trends. PRTG reports are easy to understand and help you determine the capacity of your network at a glance.

Real-time notifications mean faster troubleshooting so that you can act before more serious issues occur.
PRTG is set up in a matter of minutes and can be used on a wide variety of mobile devices.


“Excellent tool for detailed monitoring. Alarms and notifications work greatly. Equipment addition is straight forward and server initial setup is very easy. ...feel safe to purchase it if you intend to monitor a large networking landscape.”
Partnering with innovative IT vendors, Paessler unleashes synergies to create
new and additional benefits for joined customers.
IT that works constitutes a business-critical basis for a company's success. Availability and security must be defined for the respective purpose and closely monitored – by OT and IT alike.
Integrating monitoring results from PRTG into NetBrain maps makes the foundation for network automation.
With ScriptRunner Paessler integrates a powerful event automation platform into PRTG Network Monitor.
Custom alerts and data visualization let you quickly identify and prevent hardware, software, and IT infrastructure issues.
Network Monitoring Software – Version 26.1.116.1532 (February 9th, 2026)
Download for Windows and cloud-based version PRTG Hosted Monitor available
English, German, Spanish, French, Portuguese, Dutch, Russian, Japanese, and Simplified Chinese
Network devices, bandwidth, servers, applications, virtual environments, remote systems, IoT, and more
Choose the PRTG Network Monitor subscription that's best for you

Threshold monitoring is a technique used in various fields, including computer science, finance, and environmental science. It involves setting predefined thresholds or limits for certain parameters or variables.
These thresholds act as benchmarks for normal operation or acceptable levels of a particular metric. When the observed value of the parameter exceeds or falls below the set threshold, an alert or action is triggered, indicating a potential issue or deviation from the expected behavior.
PRTG uses sensors to monitor networks and IT environments. These sensors are preconfigured but customizable, so you can use the most common configurations or set individual threshold values to meet your needs. When a designated metric gets close to the threshold, PRTG sends an alert to the key stakeholder.
For example, the SNMP CPU Load sensor monitors your CPU performance. PRTG comes with preconfigured sensors for all the biggest manufacturers, including Cisco, IBM, Dell, and HPE. What’s more, all your CPU threshold values are customizable. PRTG will automatically (and promptly) send you an alert – before the system goes down.
Different thresholds represent various states of performance, resource usage, or operational health. They help to distinguish between when things are operating normally and when there are potential issues. Thresholds in PRTG include:
For many sensors, it only takes a few short minutes:
Threshold monitoring detects potential issues before they cause outages by continuously comparing performance metrics against predefined limits. When metrics approach critical levels, alerts notify IT staff immediately, allowing for proactive intervention.
This preventive approach transforms reactive firefighting into strategic management. Effective threshold monitoring also creates historical baselines that help identify gradual performance degradation, enabling teams to address underlying issues before users experience disruptions.
Comprehensive threshold monitoring for servers should track CPU utilization, memory usage, disk space, and I/O performance. Response time metrics help identify application bottlenecks, while network throughput measurements detect connectivity issues.
Threshold monitoring should also include temperature readings for physical servers to prevent hardware damage from overheating. The most effective approach combines these metrics with custom thresholds based on your specific workloads and business requirements.
In PRTG, “sensors” are the basic monitoring elements. One sensor usually monitors one measured value in your network, for example the traffic of a switch port, the CPU load of a server, or the free space on a disk drive. On average, you need about 5-10 sensors per device or one sensor per switch port.
Paessler conducted trials in over 600 IT departments worldwide to tune its network monitoring software closer to the needs of sysadmins. The result of the survey: over 95% of the participants would recommend PRTG – or already have.

Paessler PRTG is used by companies of all sizes. Sysadmins love PRTG because it makes their job a whole lot easier.
Bandwidth, servers, virtual environments, websites, VoIP services – PRTG keeps an eye on your entire network.
Everyone has different monitoring needs. That’s why we let you try PRTG for free.


