Custom alerts and data visualization let you quickly identify and prevent network performance issues.
It's every sysadmin's dream. Well, that, and winning the lottery so you can retire to the Bahamas.
But even if you were to achieve it, 100% uptime would do your network little good if it still struggled with low bandwidth, overloaded servers, firewalls, and other endpoints, or virtual machines that performed like it's a Sunday afternoon in August.
Paessler PRTG tracks the availability, health, and performance of every component in your network, 24/7. That means you'll find out about any issues (and be able to fix them) before your colleagues can notice, and plan ahead so your infrastructure is always well-placed to support your organization's growth.

Track the performance of all your network components from one place: network speed, data traffic, bandwidth usage, server performance, CPU load, application performance, virtualization, Windows performance, and much more. PRTG monitors everything round the clock, showing you detailed stats in intuitive, user-friendly dashboards.
Nip potentially serious network issues such as performance bottlenecks or sudden drops in performance in the bud. Pick your preferred warning and error thresholds, and PRTG will email, text, or send an in-app notification when you're at risk of going under or over, so you can fix them promptly and avoid disruption (and colleagues' complaints).
Your CEO has big growth plans. But can your IT infrastructure support them? PRTG puts key performance data – live data or historical data of up to 365 days – at your fingertips, so you can spot where you're under- or over-resourced, and make better-informed choices about where (and on what devices, systems, and services) to invest.
Your network, your rules. Tailor PRTG's powerful and flexible network performance monitor tool so it meets your exact needs. Choose which components and parameters to track, and how PRTG presents the data. In fact, why not create your own bespoke dashboards? Just use our built-in, drag-and-drop map editor and design your monitoring overview the way you like.
Diagnose network issues by continuously tracking performance parameters in your network infrastructure. Show bandwidth usage, server performance, CPU load, response times, network traffic patterns, and other key performance metrics in real time. Visualize monitoring data in clear graphs and dashboards to identify problems more easily. Gain the end-to-end visibility you need for troubleshooting bottlenecks, underperformance, and other performance issues.

Live traffic data graph in PRTG

Device tree view of the complete monitoring setup

Custom PRTG dashboard for keeping an eye on the entire IT infrastructure
Live traffic data graph in PRTG
Device tree view of the complete monitoring setup
“All-around winning
network monitor”
“The real beauty of PRTG is the endless possibilities it offers”
“PRTG Network Monitor
is very hard to beat”
If it's part of your network, PRTG probably has a sensor type (or more than one) you can use to keep an eye on it:
PRTG comes with more than 250 native sensor types for monitoring your entire on-premises, cloud, and hybrid cloud environment out of the box. Check out some examples below!
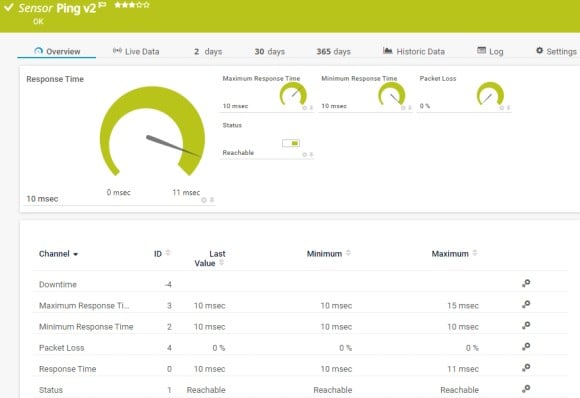
The Ping v2 sensor sends an Internet Control Message Protocol (ICMP) echo request ("ping") from the probe system to the parent device to monitor its availability. It can show the following:
• Response time
• Packet loss
• Target status
• Minimum and maximum ping time
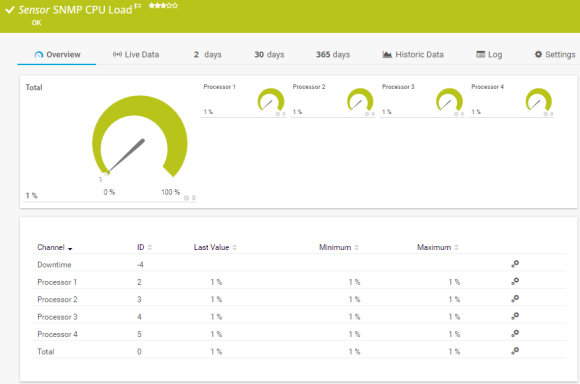
The SNMP CPU Load sensor monitors the system load. It can show the following:
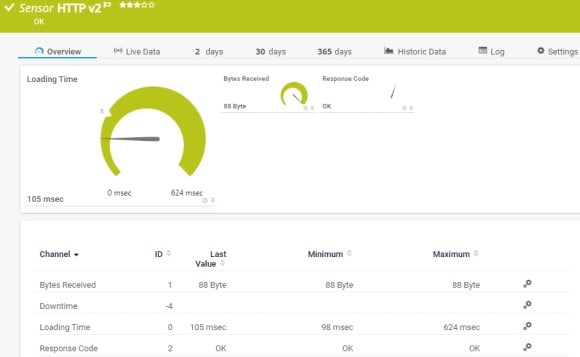
The HTTP v2 sensor monitors a web server. It can show the following:
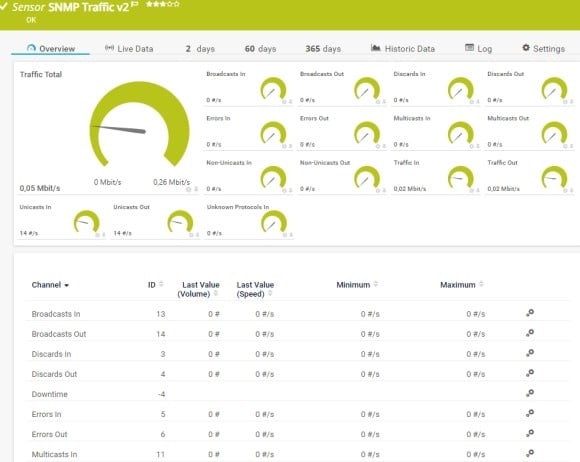
The SNMP Traffic v2 sensor monitors bandwidth and traffic on a device. It can show the following:
See the PRTG Manual for a list of all available sensor types.

Custom alerts and data visualization let you quickly identify and prevent network performance issues.
PRTG is set up in a matter of minutes and can be used on a wide variety of mobile devices.

Partnering with innovative IT vendors, Paessler unleashes synergies to create
new and additional benefits for joined customers.
Integrating monitoring results from PRTG into NetBrain maps makes the foundation for network automation.

With ScriptRunner Paessler integrates a powerful event automation platform into PRTG Network Monitor.

Siemon and Paessler bring together intelligent building technology and advanced monitoring and make your vision of intelligent buildings and data centers become reality.
Real-time notifications mean faster troubleshooting so that you can act before more serious issues occur.
Network Monitoring Software – Version 24.4.102.1351 (November 12th, 2024)
Download for Windows and cloud-based version PRTG Hosted Monitor available
English, German, Spanish, French, Portuguese, Dutch, Russian, Japanese, and Simplified Chinese
Network devices, bandwidth, servers, applications, virtual environments, remote systems, IoT, and more
Choose the PRTG Network Monitor subscription that's best for you


Network performance refers to the efficiency and effectiveness of network data transfer and communication within a computer network. It is measured by factors such as bandwidth, latency, and reliability. Higher network performance indicates faster data transmission, lower delays, and a more stable connection.
Network performance monitoring involves the continuous observation and analysis of a computer network's key metrics to ensure optimal functionality. This process includes tracking factors such as bandwidth utilization, latency, packet loss, and device performance. By using specialized network monitoring tools and software, administrators can identify issues, troubleshoot problems, optimize the network for efficient data transfer, and prevent downtime.
PRTG is a proprietary software tool that tracks the health and performance of every component that forms part of your network. Available for Windows- and Linux-based on-premises servers or as a cloud-based SaaS solution, it's capable of monitoring unlimited local, remote, and virtual network devices, bringing critical system data together in one simple, intuitive interface you can access from anywhere: at the office, at home, or on the go. PRTG uses technologies such as SNMP (Simple Network Management Protocol), packet sniffing, and flow (NetFlow, jFlow, sFlow, IPFIX) for performance monitoring.
Because it's comprehensive, infinitely customizable, and suitable for long-term monitoring — perfect for getting to the bottom of intermittent issues. "Of course you'd sing your own praises," we hear you say. Well, the proof of the pudding is in the eating. Try PRTG for free, no strings, and see for yourself.
Yes. Use the Ping v2 sensor to check the availability of all devices in your network and test network performance. And if a device is connected to the network via ethernet, that's no problem. Use PRTG's ethernet monitoring capabilities to test your wired connections and the overall performance of your LAN.
In PRTG, “sensors” are the basic monitoring elements. One sensor usually monitors one measured value in your network, for example the traffic of a switch port, the CPU load of a server, or the free space on a disk drive. On average, you need about 5-10 sensors per device or one sensor per switch port.
Paessler conducted trials in over 600 IT departments worldwide to tune its network monitoring software closer to the needs of sysadmins. The result of the survey: over 95% of the participants would recommend PRTG – or already have.

Paessler PRTG is used by companies of all sizes. Sysadmins love PRTG because it makes their job a whole lot easier.
Bandwidth, servers, virtual environments, websites, VoIP services – PRTG keeps an eye on your entire network.
Everyone has different monitoring needs. That’s why we let you try PRTG for free.