Custom alerts and data visualization let you quickly identify and prevent causes of network bottlenecks.
Bandwidth bottleneck detection with Paessler PRTG helps you to pinpoint the source of a bottleneck location. By monitoring IP addresses, protocols, and physical network ports, you can keep an eye on your network’s performance at all times.
Analyze traffic patterns, bandwidth capacity, and data throughput to keep your network running smoothly.
Understanding how bandwidth is being used across your network is key to identifying network congestion and avoiding bandwidth bottlenecks. PRTG provides a comprehensive view of bandwidth utilization across different network segments.
From data-intensive applications to individual hosts, you can track bandwidth usage in detail. Maintain a high performance and avoid productivity losses due to slow network speeds.
In today’s fast-paced digital world, real-time data is invaluable. In addition to monitoring bandwidth bottlenecks , PRTG provides real-time data on key network performance indicators such as network traffic, data throughput, network latency, and packet loss.
You will be alerted immediately to any issues with your network devices and to any threshold breaches – giving you the data you need, when you need it.
Diagnose network issues by continuously tracking available bandwidth and identify those network devices that use the most bandwidth. Show bandwidth consumption, CPU load, VoIP and quality of service (QoS) parameters, and other key metrics in in real time. Visualize monitoring data in clear graphs and dashboards to identify problems more easily. Gain the overview you need to troubleshoot bandwidth hogs and prevent packet loss, network congestion, and other performance issues that slow down your network.

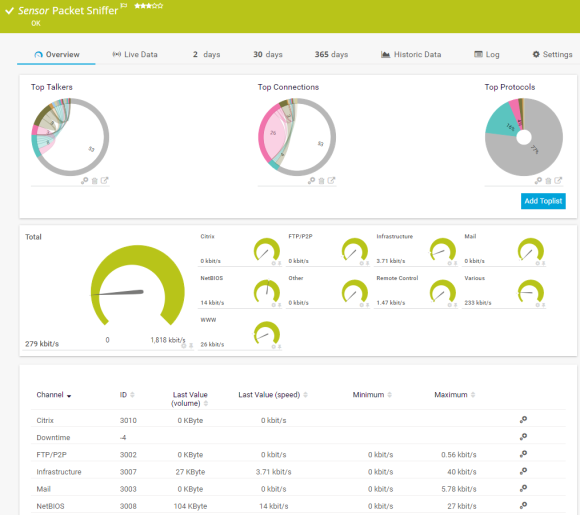
Packet Sniffer sensor in PRTG
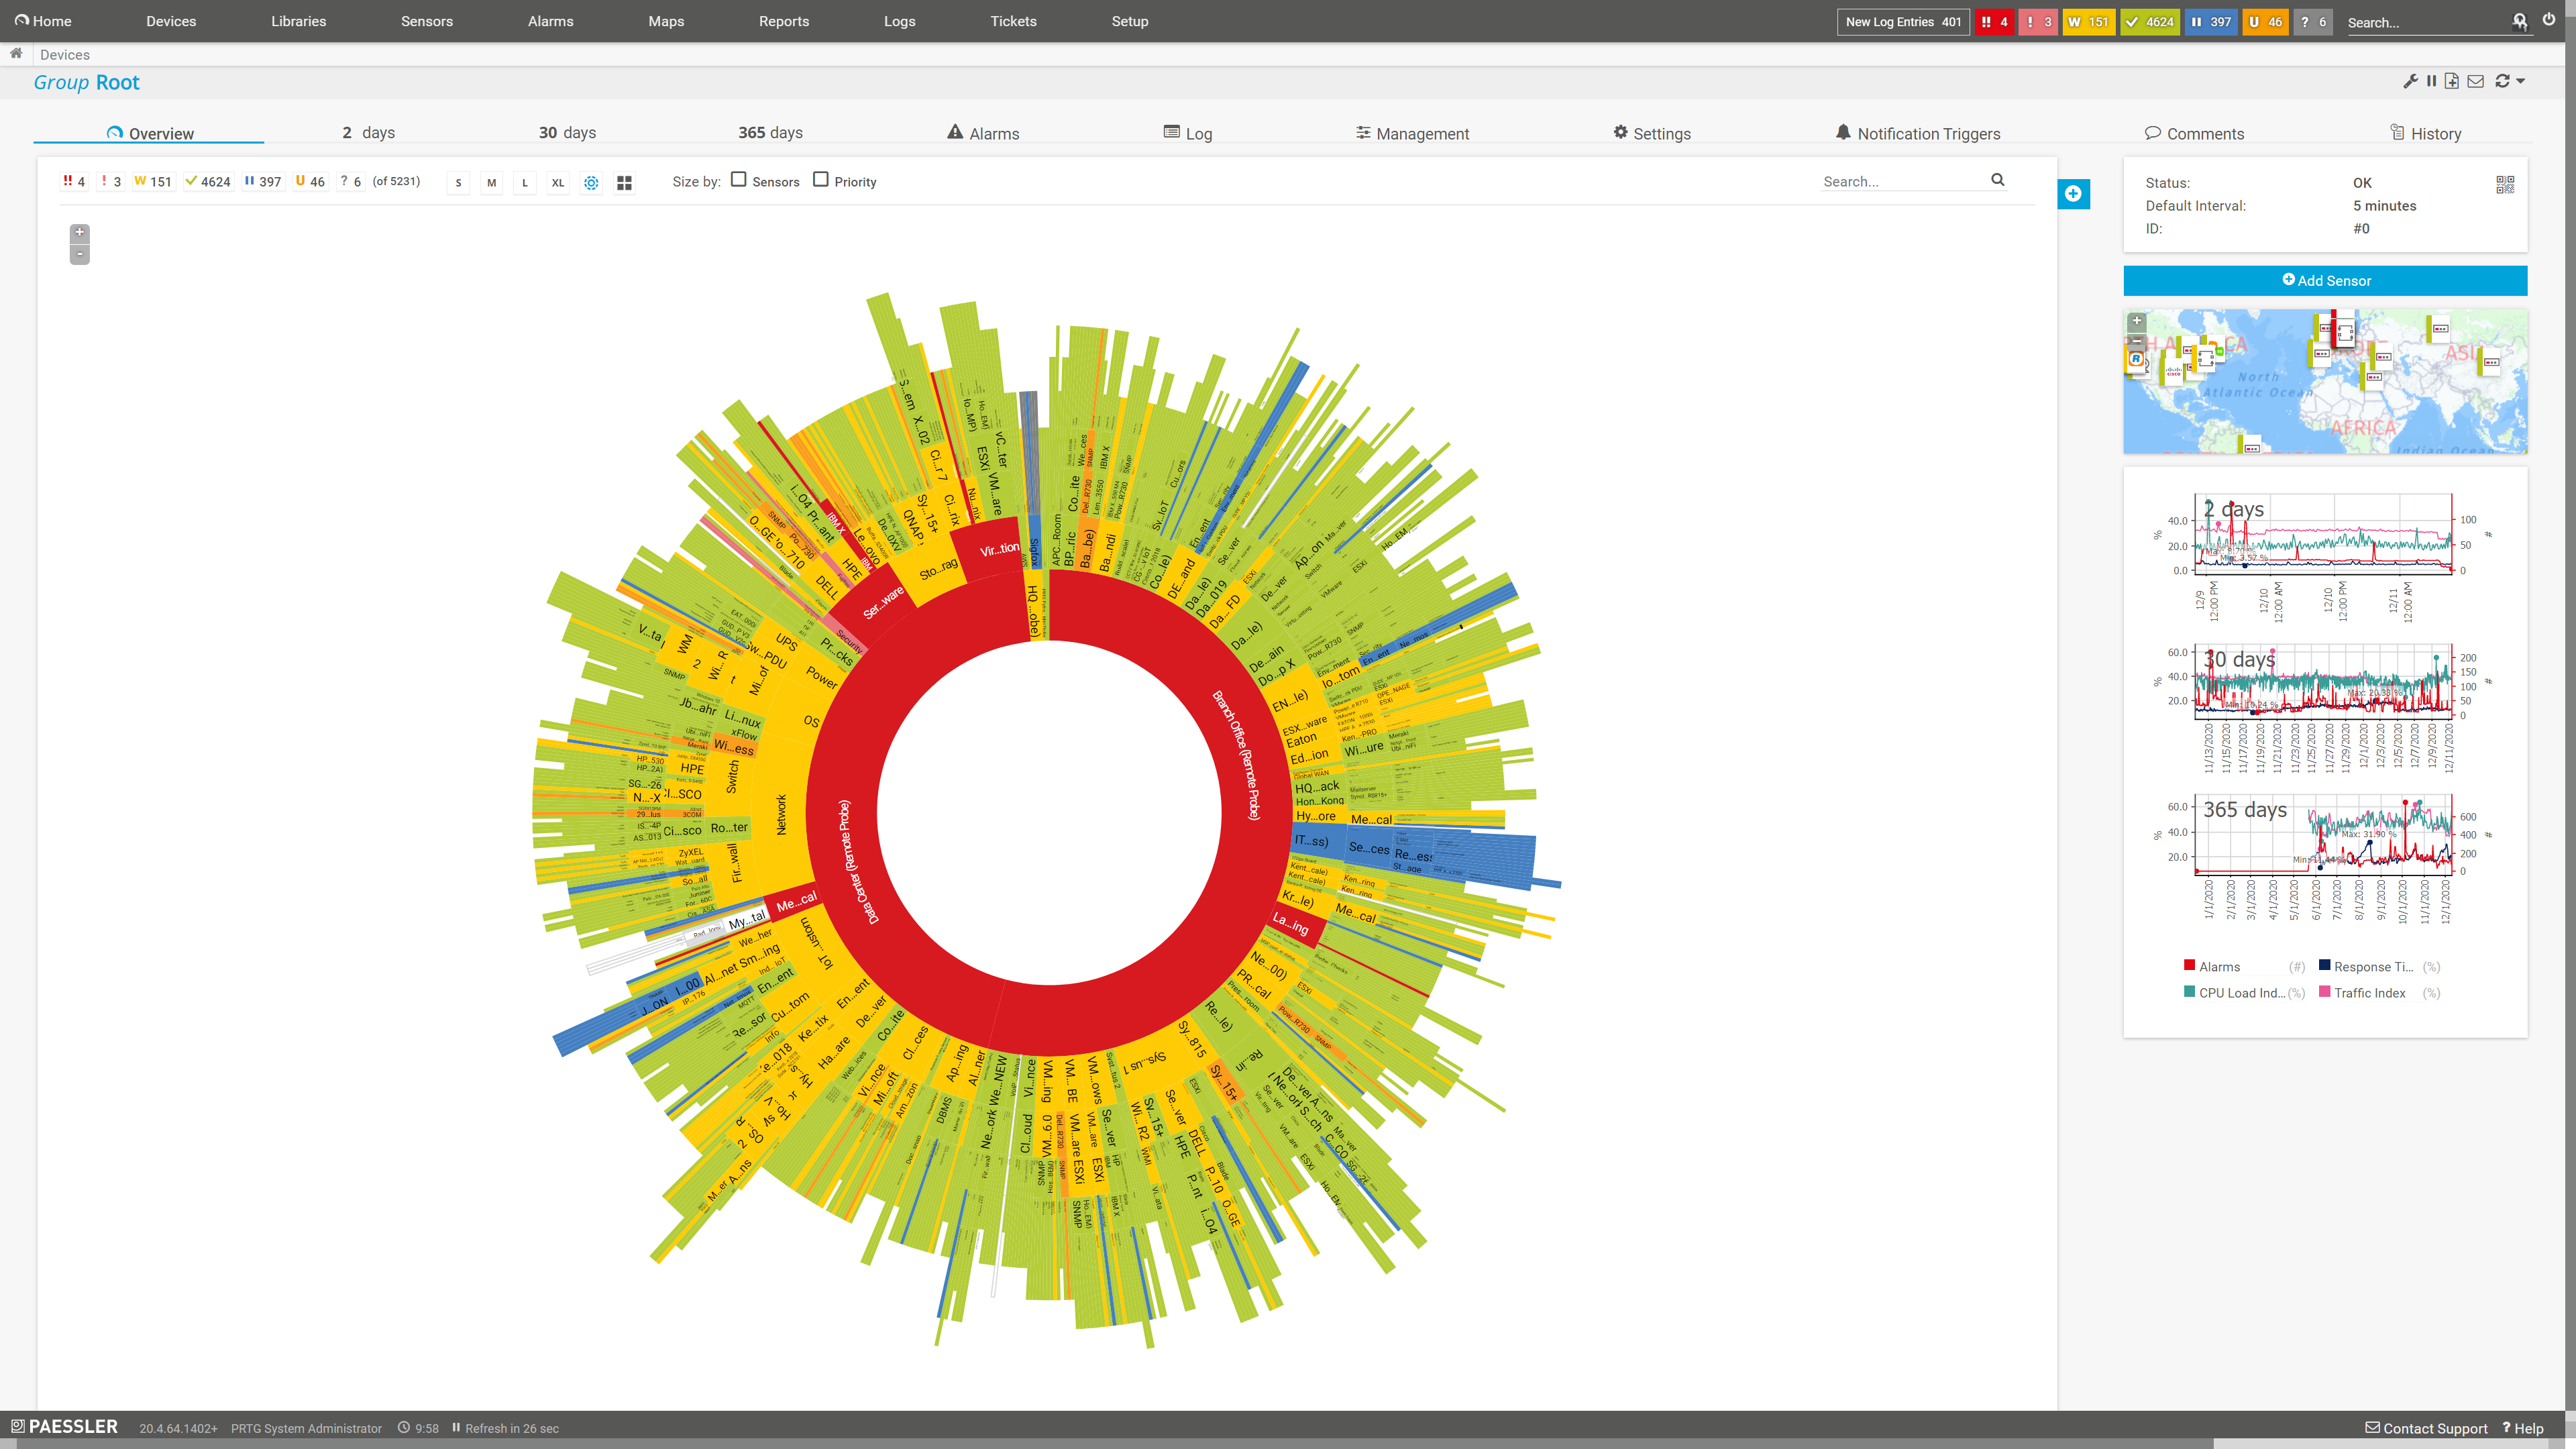
Sunburst view of the entire monitoring setup
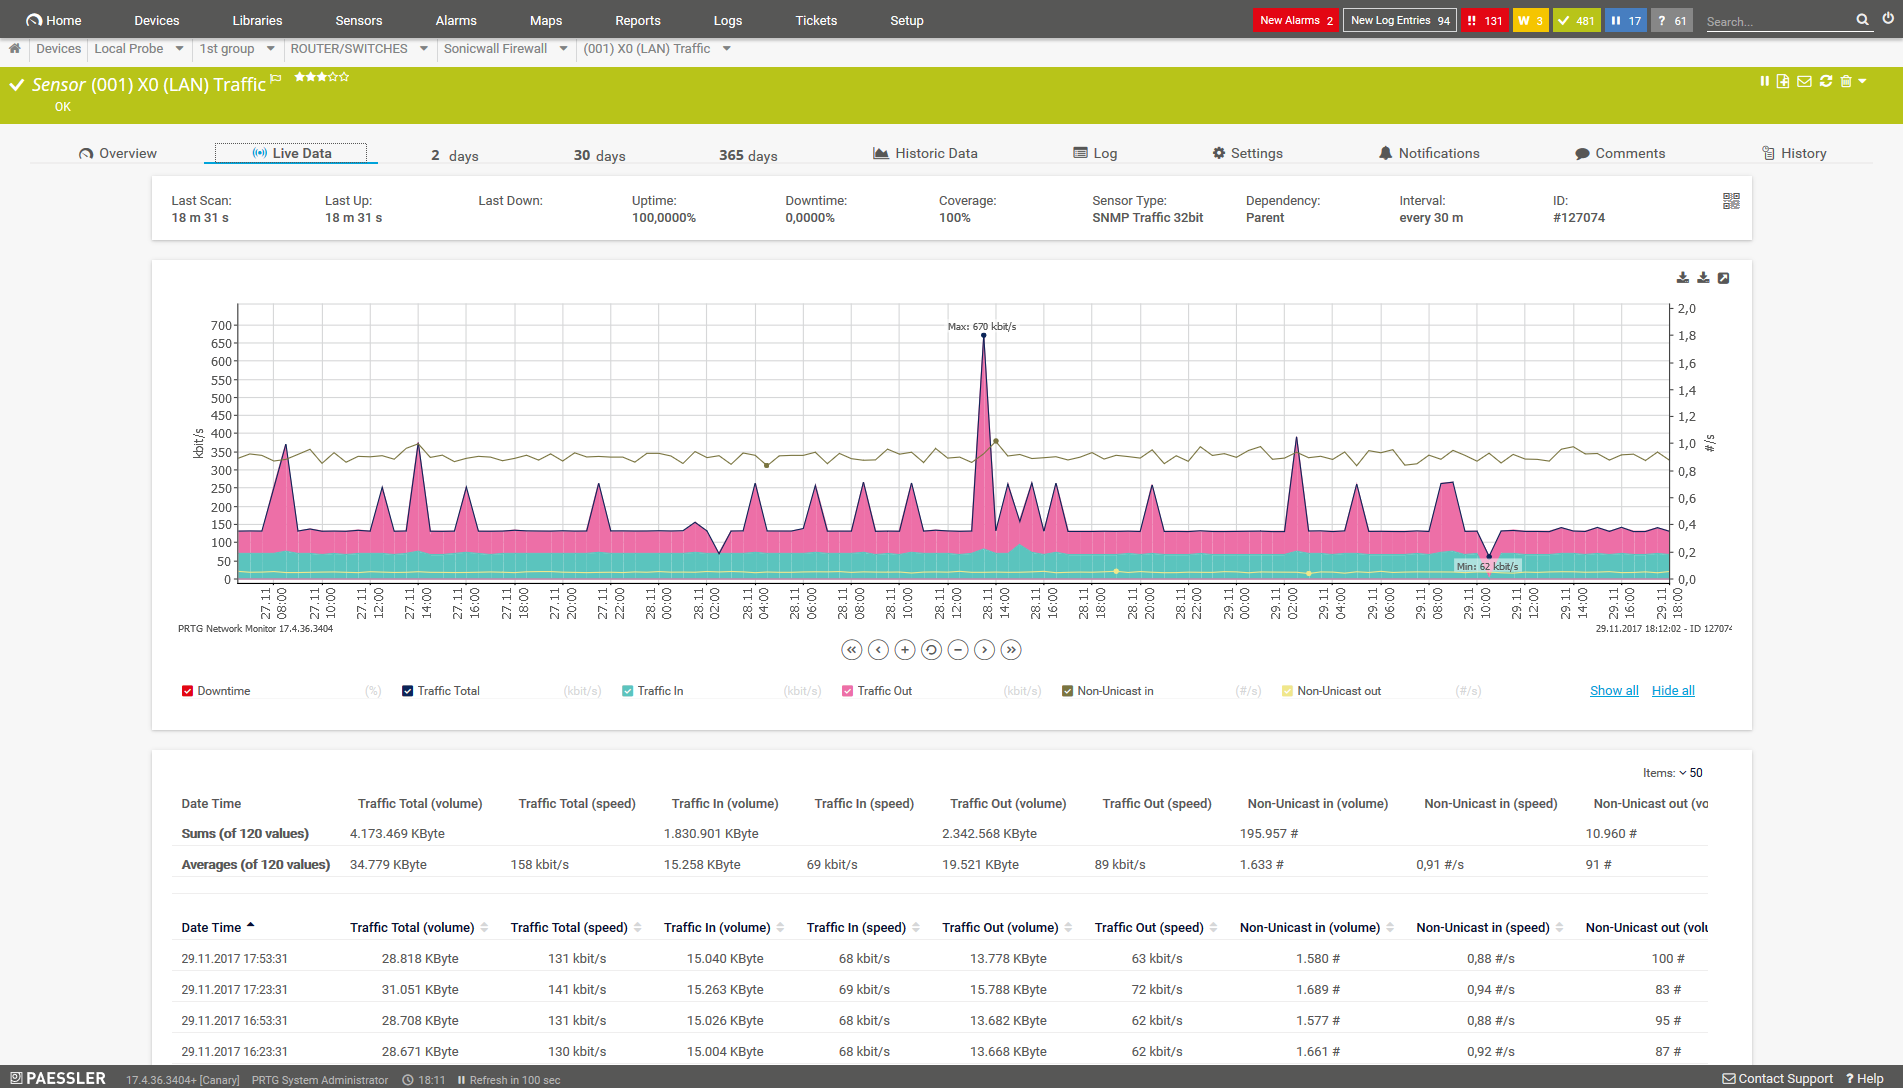
Live data traffic graph of an SNMP Traffic sensor
Packet Sniffer sensor in PRTG
Sunburst view of the entire monitoring setup
“All-around winning
network monitor”
“The real beauty of PRTG is the endless possibilities it offers”
“PRTG Network Monitor
is very hard to beat”
Network monitoring is a critical part of maintaining a high-performance and reliable network. PRTG can do way more for you than identifying and troubleshooting bandwidth bottlenecks. Use our comprehensive software to monitor the various aspects of your network and help you understand and optimize its performance.
Understanding and managing your network’s bandwidth usage is critical to preventing bottlenecks and maintaining optimal performance.
PRTG provides detailed insight into bandwidth utilization and helps you identify which parts of your network are experiencing high traffic and may be at risk of bottlenecks. Monitor and analyze bandwidth usage trends to make informed decisions and keep your network running smoothly.
Detailed network traffic analysis is the key to identifying potential bandwidth bottlenecks and ensuring efficient traffic flow.
With PRTG, you can dive deep into this topic. Discover the source, destination, and type of traffic flowing through your network. By understanding your network's traffic patterns, you can optimize its performance and prevent congestion.
Gain deeper insight into the health of your network with PRTG's performance metrics. Beyond just bandwidth monitoring, PRTG provides a detailed view of the operational status of your network, including aspects such as connection quality, network stability, and overall reliability.
Use these metrics to fine-tune your network setup, ensure consistent performance, and diagnose problems that could lead to bandwidth bottlenecks.
Ensure that all network devices and infrastructure components are working optimally with PRTG’s comprehensive monitoring capabilities.
From routers and switches to servers and storage systems, PRTG helps you keep an eye on the health and performance of your entire network infrastructure. Prevent problems before they occur by staying informed about the status of your network devices.
PRTG comes with more than 250 native sensor types for monitoring your entire on-premises, cloud, and hybrid cloud environment out of the box. Check out some examples below!
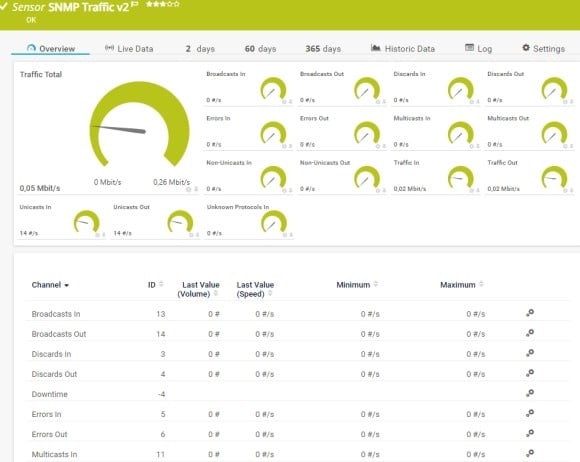
The SNMP Traffic v2 sensor monitors bandwidth and traffic on a device. It can show the following:
The Packet Sniffer sensor monitors the headers of data packets that pass a local network card using a built-in packet sniffer. You can choose from predefined channels. It can show the following and more:
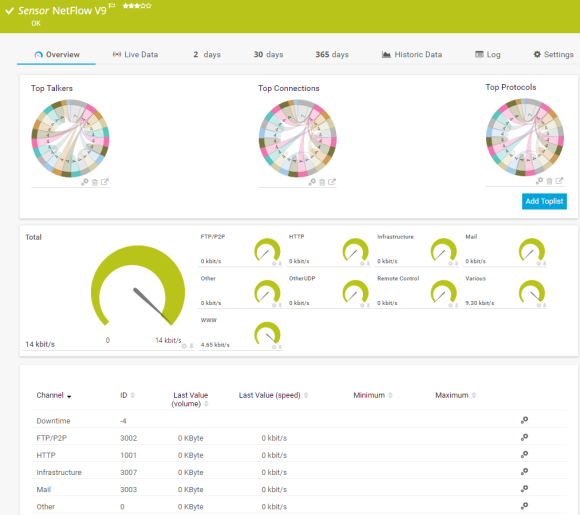
The NetFlow v9 sensor receives traffic data from a NetFlow v9-compatible device and shows the traffic by type. This sensor has several filter options to divide traffic into different channels. It can show the following and more:
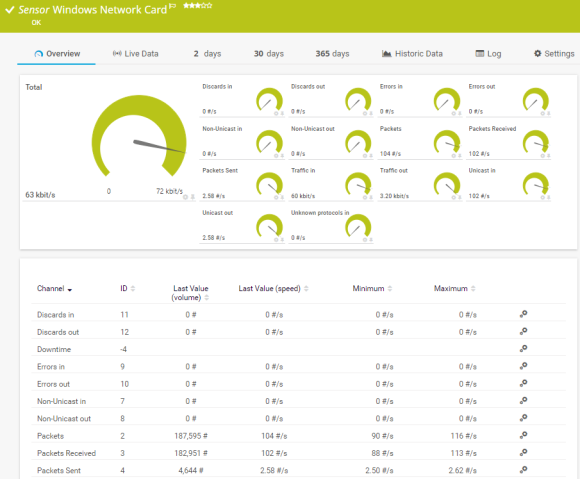
The Windows Network Card sensor monitors the bandwidth usage and traffic of a network interface via Windows Management Instrumentation (WMI) or Windows performance counters. It can show the following:
See the PRTG Manual for a list of all available sensor types.
Real-time notifications mean faster troubleshooting so that you can act before more serious issues occur.

The Simple Network Management Protocol (SNMP) is an essential tool for network administrators, and PRTG harnesses its power to provide efficient and comprehensive bandwidth monitoring.
Using its preconfigured SNMP Traffic sensor, PRTG can collect detailed information about your network devices’ bandwidth usage, network load, and more, allowing you to keep a close eye on how your network resources are being used.
Packet sniffing is a powerful technique used by PRTG to capture and analyze the data packets passing through your network. It allows you to examine the contents of the packets and gain detailed insight into the type of traffic and its characteristics.
The Packet Sniffer sensor is especially useful for in-depth network analysis, as it can identify specific data patterns, detect security breaches, and help troubleshoot network problems.
PRTG’s flow sensors (NetFlow, sFlow, jFlow, and IPFIX) are another powerful feature that provides in-depth analysis of network traffic patterns and bandwidth usage.
These protocols allow PRTG to collect data about the traffic flowing through your network, providing insight into the source, destination, and type of transmitted data. Use our flow sensors to optimize bandwidth allocation and identify potential bottlenecks before they impact network performance.
Custom alerts and data visualization let you quickly identify and prevent causes of network bottlenecks.
PRTG is set up in a matter of minutes and can be used on a wide variety of mobile devices.


“Excellent tool for detailed monitoring. Alarms and notifications work greatly. Equipment addition is straight forward and server initial setup is very easy. ...feel safe to purchase it if you intend to monitor a large networking landscape.”
Partnering with innovative IT vendors, Paessler unleashes synergies to create
new and additional benefits for joined customers.

By integrating PRTG with Martello iQ, you can add a fast analytics layer to improve uptime, visualize your IT environment, and integrate all of your IT systems into a single pane of glass.

Combining PRTG’s broad monitoring feature set with IP Fabric’s automated network assurance creates a new level of network visibility and reliability.

With ScriptRunner Paessler integrates a powerful event automation platform into PRTG Network Monitor.
Real-time notifications mean faster troubleshooting so that you can act before more serious issues occur.
Network Monitoring Software – Version 24.4.102.1351 (November 12th, 2024)
Download for Windows and cloud-based version PRTG Hosted Monitor available
English, German, Spanish, French, Portuguese, Dutch, Russian, Japanese, and Simplified Chinese
Network devices, bandwidth, servers, applications, virtual environments, remote systems, IoT, and more
Choose the PRTG Network Monitor subscription that's best for you


A bandwidth bottleneck occurs when a network's data transmission capacity is insufficient for the amount of data being sent, resulting in slow network performance and unresponsive applications. Signs of a bandwidth bottleneck include slow network speeds, delayed response times, frequent buffering, and overall network congestion.
You can identify bandwidth bottlenecks by monitoring network traffic, analyzing bandwidth usage patterns, and using network monitoring tools and bandwidth monitoring tools such as PRTG. These methods will help you pinpoint areas of high traffic and potential congestion in your network.
Regular monitoring of your network for bandwidth bottlenecks is essential to maintain optimal performance. Continuous monitoring with tools like PRTG enables early detection of problems and proactive management of potential disruptions.
PRTG provides a comprehensive solution for monitoring bandwidth bottlenecks. It provides real-time insight into network traffic and bandwidth usage, enabling fast problem identification and resolution. PRTG's versatility allows monitoring of different network components and customization to meet specific needs.se the tone and voice of your organization.
In PRTG, “sensors” are the basic monitoring elements. One sensor usually monitors one measured value in your network, for example the traffic of a switch port, the CPU load of a server, or the free space on a disk drive. On average, you need about 5-10 sensors per device or one sensor per switch port.
Paessler conducted trials in over 600 IT departments worldwide to tune its network monitoring software closer to the needs of sysadmins. The result of the survey: over 95% of the participants would recommend PRTG – or already have.

Paessler PRTG is used by companies of all sizes. Sysadmins love PRTG because it makes their job a whole lot easier.
Bandwidth, servers, virtual environments, websites, VoIP services – PRTG keeps an eye on your entire network.
Everyone has different monitoring needs. That’s why we let you try PRTG for free.