Custom alerts and data visualization let you quickly identify and prevent system performance and stability issues.
CPU load monitoring is a critical aspect of IT management, but not just any monitoring will do. You need a CPU usage monitoring tool that supports you 24/7/365. Paessler PRTG provides round-the-clock, real-time monitoring on multiple devices, at the office, and on the go. Your systems perform better, and you get peace of mind.
Balance the workload of your servers better with uniform load distribution. For servers, computers, and other processor-controlled hardware to be stable, CPU computing power has to be evenly distributed.
PRTG helps you monitor your overall processor load, as well as the loads of individual CPU cores.
Set up warning and error thresholds to notify you in the case of abnormal CPU usage patterns.
Real-time, always-on CPU load monitoring makes sure that you’ll be alerted before the situation reaches critical, allowing you to quickly identify performance bottlenecks, prevent system overloads, and maintain an efficient IT infrastructure.
Analyze historical CPU usage data so you can understand trends and make informed decisions about capacity upgrades.
While reviewing this data can be complex, PRTG simplifies this process with a central dashboard and easy-to-understand visual graphs for 2-day, 30-day, and 365-day historical data analysis.
Reduce the risk of downtime during peak usage periods with the visibility and control you need over your IT systems.
PRTG CPU load monitoring helps you identify malfunctioning or slow processes and critical CPU usage, optimize load balancing, speed, and performance, and get notified before a CPU reaches overload.
Diagnose network issues by continuously tracking the usage of your CPU. Show CPU load, CPU temperature, and other key metrics in real time. Visualize monitoring data in clear graphs and dashboards to identify problems more easily. Gain the overview you need to troubleshoot your hardware.

Device tree view of the complete monitoring setup

Custom PRTG dashboard for keeping an eye on the entire IT infrastructure

Live traffic data graph in PRTG
“All-around winning
network monitor”
“The real beauty of PRTG is the endless possibilities it offers”
“PRTG Network Monitor
is very hard to beat”
PRTG comes with more than 250 native sensor types for monitoring your entire on-premises, cloud, and hybrid cloud environment out of the box. Check out some examples below!
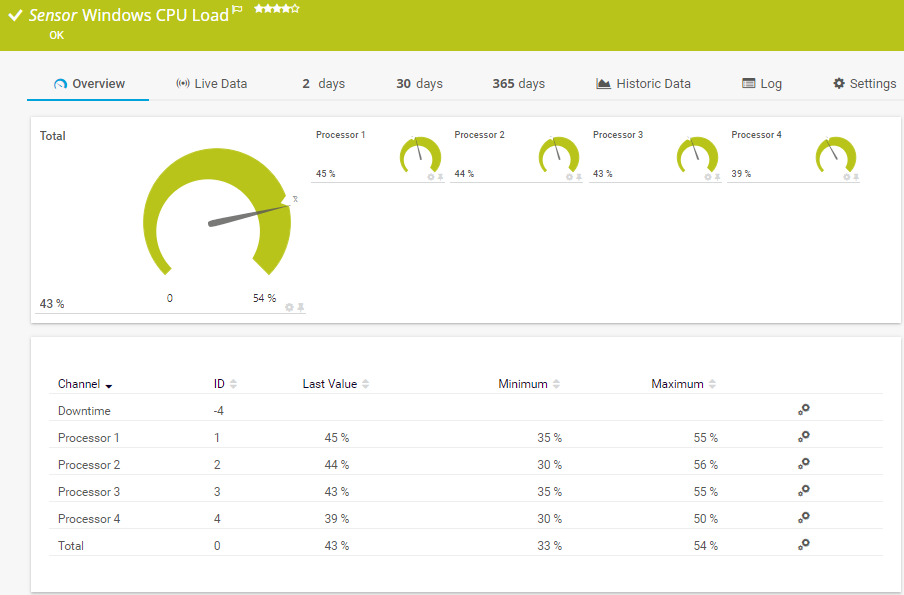
The Windows CPU Load sensor monitors the CPU load on a system via Windows Management Instrumentation (WMI) or Windows performance counters. It can show the following:
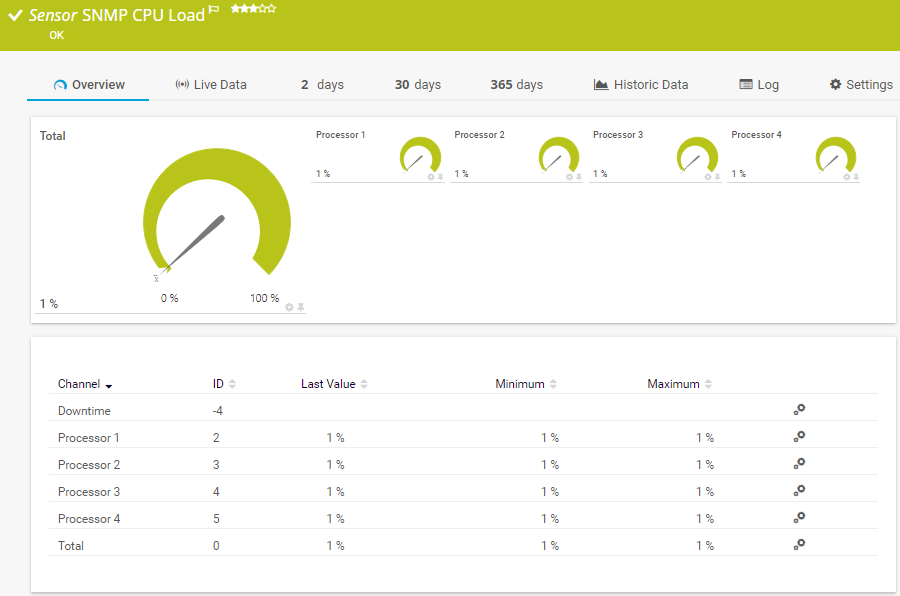
The SNMP CPU Load sensor monitors the system load. It can show the following:
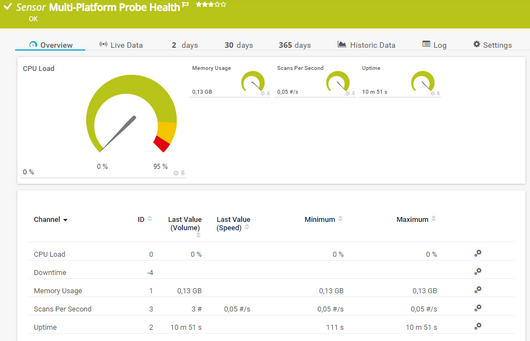
The Probe Health sensor monitors the status of the probe system. It can show the following and more:
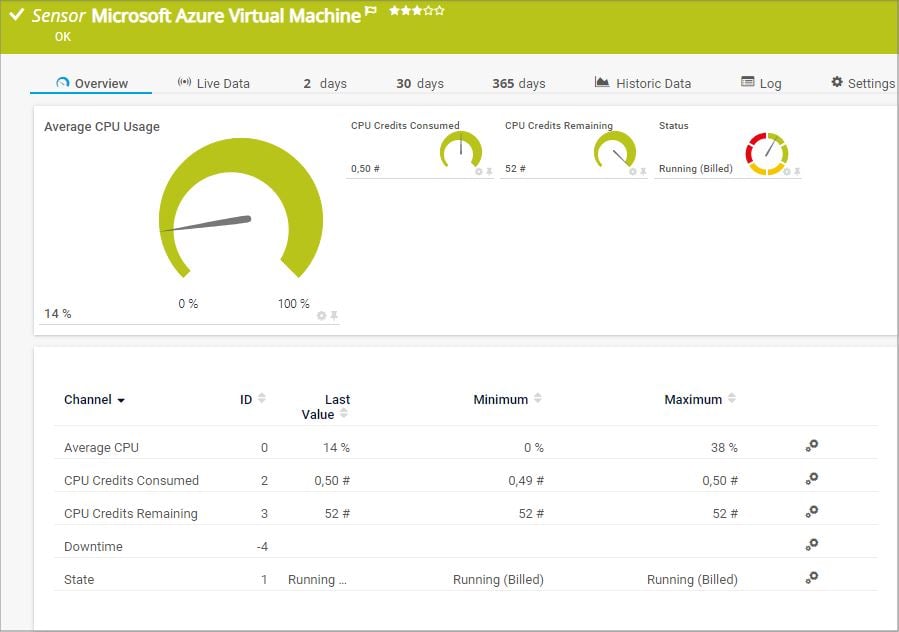
The Microsoft Azure Virtual Machine sensor monitors the status of a virtual machine (VM) in a Microsoft Azure subscription. It can show the following:
See the PRTG Manual for a list of all available sensor types.

Custom alerts and data visualization let you quickly identify and prevent system performance and stability issues.
PRTG is set up in a matter of minutes and can be used on a wide variety of mobile devices.

For NetApp, Paessler has proven to be one of the qualified, best-of-breed infrastructure and application providers whose products have been tested to expertly integrate with NetApp storage systems.
What does this mean for you?
Partnering with innovative IT vendors, Paessler unleashes synergies to create
new and additional benefits for joined customers.
baramundi and PRTG create a secure, reliable and powerful IT infrastructure where you have everything under control - from the traffic in your firewall to the configuration of your clients.
With the combination of PRTG and Insys, the monitoring specialist Paessler and the industrial gateway manufacturer INSYS icom offer a practical possibility to merge IT and OT.
Siemon and Paessler bring together intelligent building technology and advanced monitoring and make your vision of intelligent buildings and data centers become reality.
Real-time notifications mean faster troubleshooting so that you can act before more serious issues occur.
Network Monitoring Software – Version 26.1.116.1532 (February 9th, 2026)
Download for Windows and cloud-based version PRTG Hosted Monitor available
English, German, Spanish, French, Portuguese, Dutch, Russian, Japanese, and Simplified Chinese
Network devices, bandwidth, servers, applications, virtual environments, remote systems, IoT, and more
Choose the PRTG Network Monitor subscription that's best for you


PRTG CPU load monitoring is compatible with both Microsoft Windows and Linux/Unix-based operating systems. PRTG uses SNMP to read the CPU loads of network devices made by various manufacturers. You can also use WMI for Windows systems and revert to SSH for Linux-based devices or macOS.
PRTG is an all-in-one monitoring tool. It collects data on high CPU usage, including current computing power as a percentage, in total, and per processor. It also monitors CPU temperature, memory usage, and other health metrics for various devices, as well as other important system parameters, such as RAM, memory, network cards, hard disk space, bandwidth, and more.
CPU load monitoring measures computing power as a percentage, which rises with increased process demands. The more processor cores your CPU has, the less strain on each core. As a result, the CPU load will be lower. PRTG monitors the overall processor load and the loads of individual CPU cores.
CPU load monitoring primarily detects performance issues, although consistent high usage can sometimes indicate hardware problems. However, PRTG is a comprehensive monitoring solution that includes hardware monitoring, disk space monitoring, and more.
In PRTG, “sensors” are the basic monitoring elements. One sensor usually monitors one measured value in your network, for example the traffic of a switch port, the CPU load of a server, or the free space on a disk drive. On average, you need about 5-10 sensors per device or one sensor per switch port.
Paessler conducted trials in over 600 IT departments worldwide to tune its network monitoring software closer to the needs of sysadmins. The result of the survey: over 95% of the participants would recommend PRTG – or already have.

Paessler PRTG is used by companies of all sizes. Sysadmins love PRTG because it makes their job a whole lot easier.
Bandwidth, servers, virtual environments, websites, VoIP services – PRTG keeps an eye on your entire network.
Everyone has different monitoring needs. That’s why we let you try PRTG for free.