Gli avvisi personalizzati e la visualizzazione dei dati consentono di identificare e prevenire rapidamente i problemi legati alle basse prestazioni, alla bassa velocità della rete, ai colli di bottiglia della larghezza di banda e alla congestione della rete.
Indipendentemente dalla vostra posizione nel team IT, è innegabile che vorreste che la vostra rete assomigliasse a un dragster di prima categoria. Vi trovate bloccati con un go-kart? Non rimanete in fondo al gruppo; mettete il turbo alla vostra rete con il monitoraggio del throughput di rete di Paessler PRTG Network Monitor. PRTG semplifica la messa a punto delle prestazioni della rete, in modo che la vostra organizzazione possa godere di un'infrastruttura fluida e funzionante alla massima velocità.
Quando si tratta di trovare e risolvere i colli di bottiglia della rete, il monitoraggio del throughput di rete PRTG è il vostro migliore amico.
Utilizzando sensori preconfigurati e tecnologie come SNMP, NetFlow e packet sniffing, PRTG fornisce una chiara Panoramica del traffico di rete, in modo da poter inviare i problemi di prestazioni a chi di dovere.
Sfruttate i muscoli del monitoraggio con le personalizzazioni flessibili del PRTG. Definite soglie di Warning e di errore individuali per tenere sotto controllo ogni potenziale problema di prestazioni.
Gli avvisi personalizzabili di PRTG assicurano una risposta rapida se la larghezza di banda disponibile è pericolosamente bassa o la latenza di rete è ripetutamente troppo alta, mantenendo la rete in funzione senza intoppi.
Basta con le palle perse a destreggiarsi tra più strumenti di monitoraggio. Il PRTG Network Monitor ottimizza il monitoraggio della rete in un'unica soluzione di monitoraggio, riducendo la complessità e i problemi di compatibilità.
I dati storici dettagliati aiutano ad analizzare e risolvere i problemi se si verificano picchi di carico a intervalli regolari che portano alla perdita di pacchetti o ad altri problemi. Questo significa meno mal di testa, meno chiamate a mezzanotte e CTO più felici.
Non lasciate che le falle nella sicurezza vi costino in termini di throughput. Sappiamo tutti che una rete sicura è una rete veloce.
PRTG assicura che la crittografia SSL protegga tutte le comunicazioni all'interno del sistema di monitoraggio, utilizzando solo i cifrari più sicuri per le connessioni SSL/TLS. I dati sono al sicuro e la rete è veloce.
Diagnosticare i problemi di rete monitorando continuamente il throughput complessivo della rete. Mostra tempi di risposta, velocità di trasferimento, jitter, throughput elevato e altre metriche chiave in tempo reale. Visualizzate i dati di monitoraggio in grafici e dashboard chiari per identificare più facilmente i problemi. Ottenete la visibilità necessaria per risolvere potenziali problemi come l'utilizzo di un'elevata larghezza di banda, l'alta latenza, il basso throughput e i picchi di traffico.

Grafico dei dati di traffico in tempo reale in PRTG

Albero dei dispositivi dell'intera configurazione di monitoraggio

Dashboard PRTG personalizzato per tenere sotto controllo l'intera infrastruttura IT
Grafico dei dati di traffico in tempo reale in PRTG
Albero dei dispositivi dell'intera configurazione di monitoraggio
“Monitor di rete vincente sotto tutti i punti di vista”
“La vera bellezza di PRTG sta nelle infinite possibilità che offre”
“PRTG Network Monitor
è molto difficile da superare”
PRTG è come avere un occhio onnipresente sull'intera infrastruttura di rete. Dalla CPU e dalla memoria ai server, ai dispositivi di archiviazione e ad altri endpoint, la nostra soluzione di monitoraggio è in grado di monitorare tutto, nel dettaglio.
Consolidando lo strumento di monitoraggio della rete in un unico strumento, è possibile intervenire sui punti deboli per ottenere una rete a prova di bomba e una risoluzione dei problemi più rapida.
PRTG tiene sotto controllo gli elementi cruciali che influenzano il throughput della rete: tempi di attività, tempi di inattività, salute dell'hardware, larghezza di banda, prestazioni delle applicazioni e server virtuali.
IT classifica anche il traffico di rete, misura la qualità del servizio (QoS) e rileva attività insolite per mantenere la rete in perfetta forma.
Che siate in ufficio, a casa o in vacanza, PRTG vi tiene informati sulle prestazioni della vostra rete. Siete sempre informati grazie al monitoraggio continuo e alle metriche in tempo reale visualizzate attraverso mappe e dashboard grafici.
Le app di PRTG per iOS e Android e gli avvisi automatici assicurano che non si perda mai un colpo.
Iniziare con PRTG è un gioco da ragazzi. Grazie alla soluzione di monitoraggio agentless, è possibile saltare i complicati processi di installazione e configurazione.
Iniziate a monitorare il throughput della vostra rete in un batter d'occhio. Meno problemi, più concentrazione sulle attività importanti.
PRTG vi permette di verificare se il vostro ISP sta effettivamente fornendo la quantità di throughput di rete e di larghezza di banda che avete pagato. Il modo migliore per farlo è generare diversi picchi di carico durante un determinato periodo di tempo e misurare le prestazioni con PRTG. Trovate un'opzione qui:
Se la larghezza di banda è pubblicizzata a 8 megabit al secondo, dovrebbero essere necessari circa 0,5 secondi per scaricare un file di 500 KB. Se la connessione è utilizzata anche da altri, è possibile che il grafico mostri del jitter. Altrimenti, il grafico dovrebbe assomigliare a una linea retta.
PRTG è dotato di oltre 250 tipi di sensori nativi per il monitoraggio dell'intero ambiente on-premises, cloud e cloud ibrido. Dai un'occhiata ad alcuni esempi qui sotto!
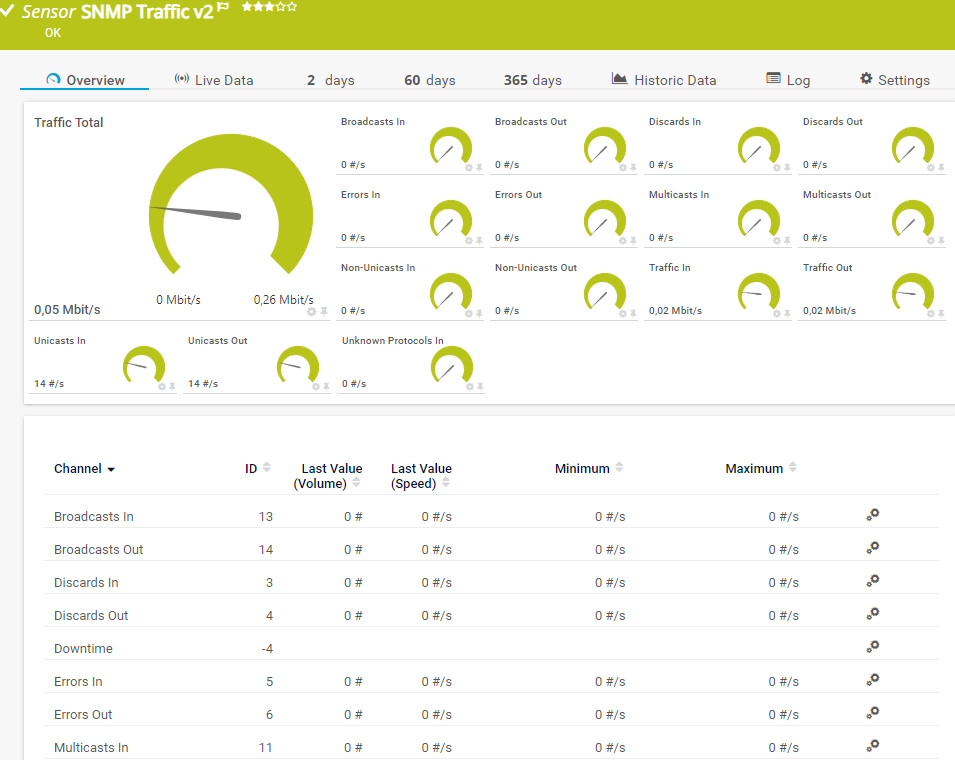
Il sensore SNMP Traffic v2 monitora la larghezza di banda e il traffico di un dispositivo. Può mostrare quanto segue:
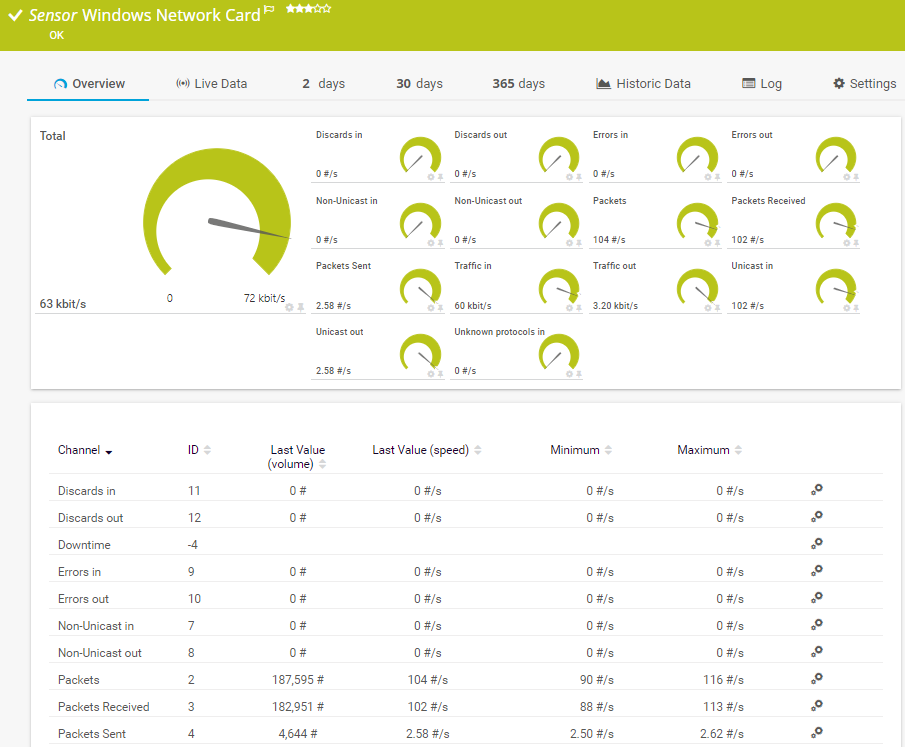
Il sensore Windows Network Card monitora l'utilizzo della larghezza di banda e il traffico di un'interfaccia di rete tramite Windows Management Instrumentation (WMI) o i contatori di prestazioni di Windows. Può mostrare quanto segue:
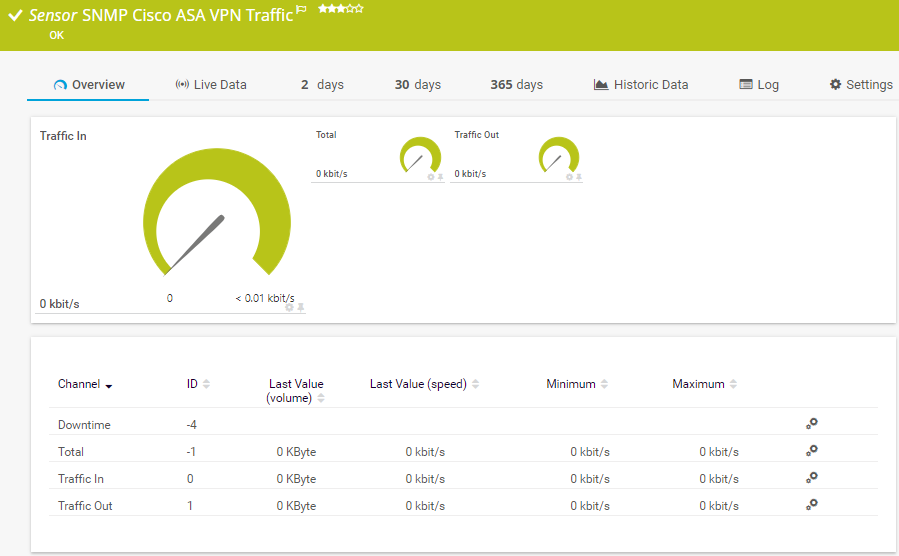
Il sensore SNMP Cisco ASA VPN Traffic monitora il traffico di una connessione VPN Internet Protocol Security (IPsec) su una Cisco Adaptive Security Appliance. Può mostrare quanto segue:
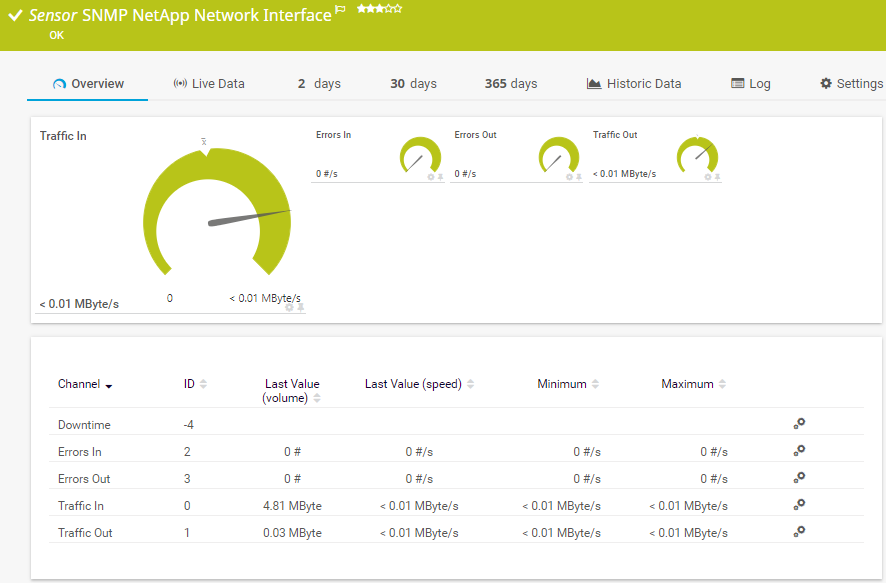
Il sensore SNMP NetApp Network Interface monitora una scheda di rete di un sistema di storage NetApp. Può mostrare quanto segue:
Consulta il manuale di PRTG per un elenco di tutti i tipi di sensore disponibili.

Le notifiche in tempo reale consentono una risoluzione più rapida dei problemi, in modo da poter intervenire prima che si verifichino problemi più gravi.
Configurate PRTG in pochi minuti e utilizzatelo su quasi tutti i dispositivi mobili.


“Eccellente strumento per un monitoraggio dettagliato. Gli avvisi e le notifiche funzionano perfettamente. L'aggiunta dei dispositivi è intuitiva e la configurazione iniziale del server è molto semplice. ...acquistatelo tranquillamente se desiderate monitorare un vasto panorama di rete.”
Grazie alla collaborazione con fornitori IT innovativi, Paessler libera sinergie per creare nuovi e ulteriori vantaggi per i suoi clienti.
L'integrazione dei risultati del monitoraggio di PRTG nelle mappe di NetBrain costituisce la base per l'automazione della rete.
L'IT che funziona costituisce una base critica per il successo di un'azienda. La disponibilità e la sicurezza devono essere definite per il rispettivo scopo e monitorate attentamente, sia da parte dell'OT che dell'IT.

Con ScriptRunner Paessler integra una potente piattaforma di automazione degli eventi in PRTG Network Monitor.
Gli avvisi personalizzati e la visualizzazione dei dati consentono di identificare e prevenire rapidamente i problemi legati alle basse prestazioni, alla bassa velocità della rete, ai colli di bottiglia della larghezza di banda e alla congestione della rete.
Software di monitoraggio della rete – Versione 24.4.102.1351 (November 12th, 2024)
Disponibile il download della versione per Windows e della versione cloud-based PRTG Hosted Monitor
Inglese, tedesco, spagnolo, francese, portoghese, olandese, russo, giapponese e cinese semplificato
Dispositivi di rete, larghezza di banda, server, applicazioni, ambienti virtuali, sistemi remoti, IoT e molto altro
Scegli l'abbonamento a PRTG Network Monitor più adatto a te

Il throughput di rete si riferisce alla quantità di dati (senza "overhead") che può essere trasmessa da una rete in qualsiasi momento. Di solito viene visualizzato come media e misurato in bit al secondo (bps, mbps, gbps).
Il throughput è un valore importante per misurare le prestazioni di una connessione di rete. Un numero elevato di pacchetti di dati persi o di errori durante il trasferimento dei dati può portare a una riduzione del throughput e a un calo delle prestazioni.
Se la vostra rete è lenta e poco efficiente, una delle prime cose da controllare è il throughput della rete. Insieme alla larghezza di banda, il throughput gioca un ruolo fondamentale nelle prestazioni di una rete.
PRTG mostra quali applicazioni, utenti e protocolli consumano più larghezza di banda. Di conseguenza, è possibile intraprendere azioni specifiche per liberare spazio.
Monitorando le statistiche, sarete in grado di capire se la chiusura di singole applicazioni e utenti è sufficiente o se è necessario acquisire più larghezza di banda, utilizzare più dispositivi di rete come router e switch o implementare un maggiore bilanciamento del carico per ottimizzare le prestazioni della rete.
Assolutamente sì! PRTG fornisce un monitoraggio completo del throughput di rete in ambienti fisici, virtuali e cloud, assicurando che ogni aspetto delle prestazioni della rete sia coperto.
Pur concentrandosi sul monitoraggio, PRTG include anche solide caratteristiche di monitoraggio come la crittografia SSL per proteggere le comunicazioni di rete. Per una maggiore sicurezza, considerate l'integrazione di PRTG con un software di sicurezza di rete specializzato per garantire che il vostro throughput non sia influenzato da potenziali minacce.
Sì! Il PRTG Network Monitor include sensori per il monitoraggio delle condizioni ambientali, come la temperatura e l'umidità, che possono influire sulle prestazioni dell'hardware di rete. Assicurando condizioni ottimali, PRTG aiuta a mantenere costante il throughput della rete e previene potenziali danni ai dispositivi.
In PRTG, i “sensori” sono gli elementi base del monitoraggio. Un sensore monitora solitamente un valore misurato nella tua rete (ad esempio, il traffico di una porta switch, il carico della CPU di un server o lo spazio libero di un’unità disco). In media, occorrono circa 5-10 sensori per ogni dispositivo o un sensore per ogni porta switch.
Paessler ha condotto prove in oltre 600 dipartimenti IT in tutto il mondo per mettere a punto il suo software di monitoraggio di rete più vicino alle esigenze dei sysadmin. Il risultato è che più del 95% degli intervistati consiglierebbe PRTG – o lo ha già fatto.

Paessler PRTG è utilizzato da aziende di tutte le dimensioni. Gli amministratori di sistema adorano PRTG perché rende il loro lavoro molto più semplice.
Ampiezza di banda, server, ambienti virtuali, siti Web, servizi VoIP - PRTG tiene d'occhio la tua intera rete.
Tutti hanno esigenze di monitoraggio diverse. Ecco perché ti lasciamo provare PRTG gratuitamente. Inizia oggi stesso la tua prova.