Custom alerts and data visualization let you quickly identify and prevent all kinds of performance issues as well as security threats.
Less need for help desk support
With Paessler PRTG, your network is more stable, which results in fewer help desk support requests. Let’s face it: working in your company's IT support team can be quite stressful, especially if problems and complaints are pressing and complicated. Save yourself this hassle with PRTG.
More time for important tasks
Our network traffic monitor with its customizable alerting system lets you concentrate on the really important tasks in your everyday work. If PRTG doesn't notify you of an issue, you can have total peace of mind knowing that everything's working as expected. Take the extra time to maintain your network or install new hardware, for example.
More time for capacity planning
PRTG monitors your network traffic as well as your entire IT infrastructure round the clock. This means that you do not only benefit from live data analysis, but also from historical monitoring data that you can compare and analyze. Use data collected over a longer period of time, for example, to optimize your network capacity planning.

Get an overview of how much traffic is flowing through your network. You can also determine if your full data allowance is actually being used or if you can make do with less. PRTG lets you optimize network capacity planning in an easy way.
Is your company’s internet connection becoming less reliable or do other errors occur in your network? With PRTG, you get a network traffic tool that analyzes your data consumption & uncovers the causes of network disruptions as well as bottlenecks and security leaks.
Every network has a bandwidth hog. It might be an individual application, video stream, or overloaded WLAN. However, it could also be a simple print job containing some big files that are temporarily clogging the network. Our PRTG network analyzer helps you to identify bandwidth hogs at one glance.
Diagnose network issues by continuously tracking network traffic and bandwidth on all your endpoints (routers, servers, switches, firewalls,...) in you WAN, on-premises, cloud-based, and virtual network Show traffic patterns and status and other key metrics in real time. Visualize monitoring data in clear graphs and dashboards identify problems more easily. Gain the overview you need for troubleshooting all kinds of issues with your network traffic.

Live traffic data graph in PRTG

Device tree view of the complete monitoring setup

Custom PRTG dashboard for keeping an eye on the entire IT infrastructure
Live traffic data graph in PRTG
Device tree view of the complete monitoring setup
“All-around winning
network monitor”
“The real beauty of PRTG is the endless possibilities it offers”
“PRTG Network Monitor
is very hard to beat”
As an administrator, you need to optimize your network performance. But should you use an array of small tools or one central monitoring tool for your entire IT infrastructure?
Administrators need network traffic analysis tools to measure and analyze the traffic in their IT infrastructure. Some tools let you have a detailed look into the live data of a network.
Wireshark, for example, captures live, unfiltered network traffic. Analyzing this data, however, is difficult unless you know what to look for. Moreover, these tools don't offer the same comprehensive feature set as PRTG does.
PRTG provides structured, long-term recording of your network traffic data so that you can easily compare and analyze the data set if issues come up.
Instead of managing numerous small tools to comprehensively monitor and analyze your network traffic, PRTG provides you with combined network analysis & IT infrastructure monitoring – all in one tool and at one glance.
PRTG comes with more than 250 native sensor types for monitoring your entire on-premises, cloud, and hybrid cloud environment out of the box. Check out some examples below!
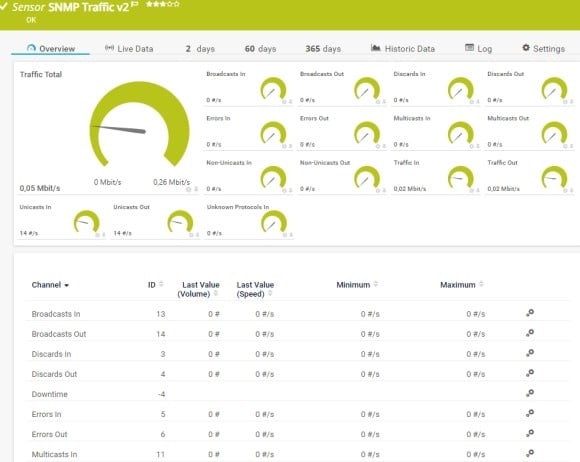
The SNMP Traffic v2 sensor monitors bandwidth and traffic on a device. It can show the following:
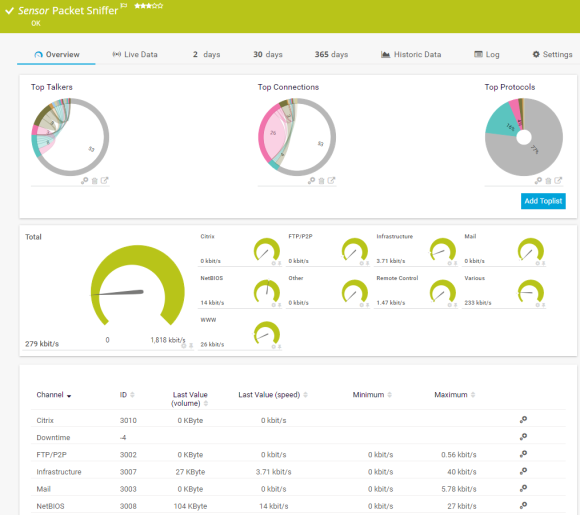
The Packet Sniffer sensor monitors the headers of data packets that pass a local network card using a built-in packet sniffer. You can choose from predefined channels. It can show the following and more:
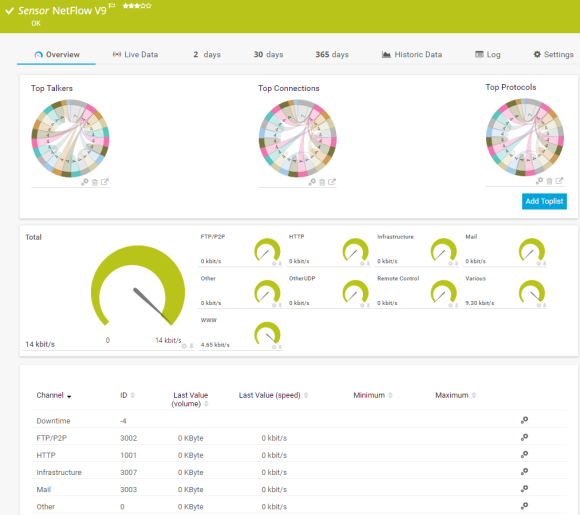
The NetFlow v9 sensor receives traffic data from a NetFlow v9-compatible device and shows the traffic by type. This sensor has several filter options to divide traffic into different channels. It can show the following and more:
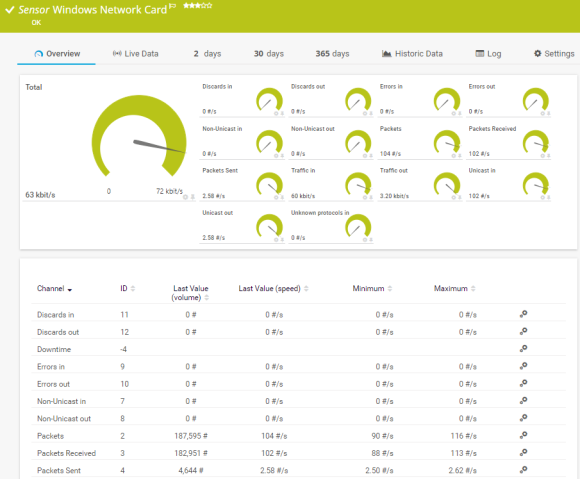
The Windows Network Card sensor monitors the bandwidth usage and traffic of a network interface via Windows Management Instrumentation (WMI) or Windows performance counters. It can show the following:
See the PRTG Manual for a list of all available sensor types.
Real-time notifications mean faster troubleshooting so that you can act before more serious issues occur.

The day starts well. Then, all of a sudden, the network crashes. E-mails stay put in the outbox, applications slow down to a snail’s pace, and the technical support hotline doesn’t stop ringing anymore.
The sysadmin immediately gets to work. They need to look for a tool that displays their network’s traffic to get down to the root cause of the failure. They search, compare data, and, after a very long time, finally find and troubleshoot the issue. The problem: in the meantime, they’ve not only lost a lot of time, but also nerves and money.
With a network traffic monitoring & analysis tool like PRTG, the sysadmin can monitor the traffic in their network round the clock. They’ll quickly be able to tell if the volume of data has increased, and with it the strain on the entire IT infrastructure.
At the first sign of a possible disruption, PRTG sends them an alert so that they can take action proactively and upgrade the weak spots in their network. This way, they can go about their daily business with peace of mind knowing that if PRTG doesn’t notify them, everything’s working fine.
Custom alerts and data visualization let you quickly identify and prevent all kinds of performance issues as well as security threats.
Set up PRTG in minutes and use it on almost any mobile device.

Partnering with innovative IT vendors, Paessler unleashes synergies to create
new and additional benefits for joined customers.

Combining PRTG’s broad monitoring feature set with IP Fabric’s automated network assurance creates a new level of network visibility and reliability.

Paessler and Plixer provide a complete solution adding flow and metadata analysis to a powerful network monitoring tool.

With ScriptRunner Paessler integrates a powerful event automation platform into PRTG Network Monitor.
Real-time notifications mean faster troubleshooting so that you can act before more serious issues occur.
Network Monitoring Software – Version 24.4.102.1351 (November 12th, 2024)
Download for Windows and cloud-based version PRTG Hosted Monitor available
English, German, Spanish, French, Portuguese, Dutch, Russian, Japanese, and Simplified Chinese
Network devices, bandwidth, servers, applications, virtual environments, remote systems, IoT, and more
Choose the PRTG Network Monitor subscription that's best for you

Network traffic is defined as the amount of data that passes through a network at a given point in time.
For analyzing network traffic, you can use technologies such as SNMP, WMI, packet sniffing, or flow (NetFlow, jFlow, sFlow, IPFIX). Choosing the right technology depends on the system you use, the manufacturers of your network devices, and the load on your network.
Network traffic analysis is the process of collecting and examining data from a network in order to understand and improve its performance. It can help identify bottlenecks in the system that may be causing slowdowns or impacting quality of service for end users.
PRTG is the perfect tool for network monitoring and analysis. It is known for being a powerful tool for system administrators and IT professionals, allowing them to detect network issues quickly and troubleshoot network errors in real-time.
What’s more: PRTG not only offers network traffic monitoring – with it, you can also monitor your entire IT infrastructure and benefit from a comprehensive & customizable alerting, notification, reporting, and visualization system.
NetFlow is a protocol for collecting, aggregating, and recording traffic flow data in a network. NetFlow data provide a more granular view of bandwidth and network traffic in comparison to SNMP, for example. NetFlow was developed by Cisco and is integrated in Cisco’s IOS software on the company’s routers and switches.
In PRTG, “sensors” are the basic monitoring elements. One sensor usually monitors one measured value in your network, for example the traffic of a switch port, the CPU load of a server, or the free space on a disk drive. On average, you need about 5-10 sensors per device or one sensor per switch port.
Paessler conducted trials in over 600 IT departments worldwide to tune its network monitoring software closer to the needs of sysadmins. The result of the survey: over 95% of the participants would recommend PRTG – or already have.

Paessler PRTG is used by companies of all sizes. Sysadmins love PRTG because it makes their job a whole lot easier.
Bandwidth, servers, virtual environments, websites, VoIP services – PRTG keeps an eye on your entire network.
Everyone has different monitoring needs. That’s why we let you try PRTG for free.