Custom alerts and data visualization let you quickly identify and prevent issues with low performance, slow network speed, bandwidth bottlenecks, and network congestion.
No matter where you are in the IT team, there’s no denying that you wish your network resembled a top-fuel dragster. Do you find yourself stuck with a go-cart? Don’t stay in the back of the pack; turbo-boost your network with Paessler PRTG network throughput monitoring. PRTG makes it easier to fine-tune network performance so your organization can enjoy a smooth-running infrastructure that functions at top speed.
When it comes to finding and fixing network bottlenecks, PRTG network throughput monitoring is your best friend.
Using preconfigured sensors and technologies like SNMP, NetFlow, and packet sniffing, PRTG gives you a clear overview of your network traffic so you can send performance issues where they belong.
Flex your monitoring muscles with PRTG’s flexible customizations. Define individual warning and error thresholds to stay on top of any potential performance problems.
PRTG's customizable alerts ensure you can respond quickly if available bandwidth is dangerously low or network latency is repeatedly too high, keeping your network humming along without a hitch.
No more dropped balls from juggling multiple monitoring tools. PRTG streamlines your network monitoring into one comprehensive solution, reducing complexity and compatibility issues.
Detailed historical data help you analyze and troubleshoot if peak loads occur at regular intervals that lead to packet loss or other issues. This means fewer headaches, fewer midnight calls, and happier CTOs.
Don’t let cracks in your security cost you in throughput. We all know a secure network is a fast network.
PRTG ensures that SSL encryption protects all communications within your monitoring system, using only the most secure ciphers for SSL/TLS connections. Your data stays safe, and your network stays speedy.
Diagnose network issues by continuously tracking your network’s overall throughput. Show response times, transfer speeds, jitter, high throughput, and other key metrics in real time. Visualize monitoring data in clear graphs and dashboards to identify problems more easily. Gain the visibility you need to troubleshoot potential issues such as high bandwidth usage, high latency, low throughput, and peak traffic patterns.

Live traffic data graph in PRTG

Device tree view of the complete monitoring setup

Custom PRTG dashboard for keeping an eye on the entire IT infrastructure
Live traffic data graph in PRTG
Device tree view of the complete monitoring setup
“All-around winning
network monitor”
“The real beauty of PRTG is the endless possibilities it offers”
“PRTG Network Monitor
is very hard to beat”
PRTG is like having an all-seeing eye over your entire network infrastructure. From CPU and memory to servers, storage devices, and other endpoints, our solution monitors it all – in detail.
By consolidating network monitoring into one tool, you shore up your weak spots for a bulletproof network and faster troubleshooting.
PRTG keeps a close eye on crucial elements affecting network throughput: uptime, downtime, hardware health, bandwidth, application performance, and virtual servers.
It even classifies network traffic, measures Quality of Service (QoS), and detects unusual activity to keep your network in top shape.
Whether you're in the office, at home, or on vacation, PRTG keeps you informed about your network's performance. You're always in the loop with continuous monitoring and real-time metrics displayed through graphical maps and dashboards.
PRTG’s apps for iOS and Android and automatic alerts ensure you never miss a beat.
Getting started with PRTG is a breeze. Its agentless monitoring solution means you can skip complicated installation and configuration processes.
Start monitoring your network's throughput in no time. Less fuss, more focus on important tasks.
PRTG lets you check whether your ISP is actually providing the amount of network throughput and bandwidth that you have paid for. The best way to do so is to generate several peak loads during a specified period of time and measure performance with PRTG. Find one option here:
If your bandwidth is advertised at 8 megabits per second, it should take approximately 0.5 seconds to download a 500 KB file. If the connection is also used by others, you may see jitter on the graph. Otherwise, the graph should resemble a straight line.
PRTG comes with more than 250 native sensor types for monitoring your entire on-premises, cloud, and hybrid cloud environment out of the box. Check out some examples below!
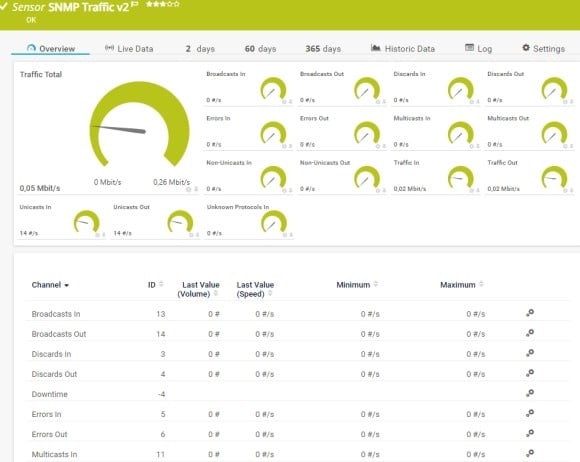
The SNMP Traffic v2 sensor monitors bandwidth and traffic on a device. It can show the following:
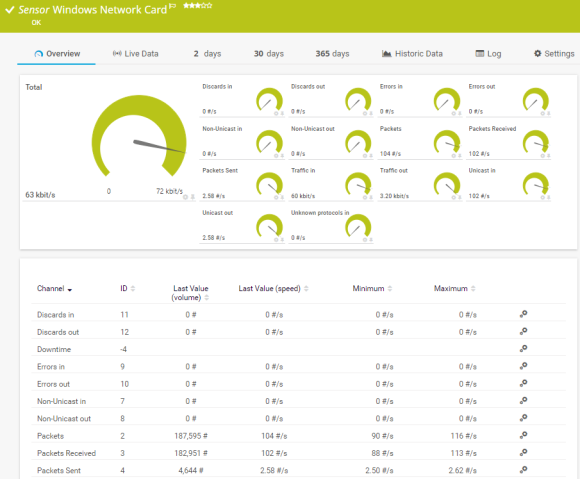
The Windows Network Card sensor monitors the bandwidth usage and traffic of a network interface via Windows Management Instrumentation (WMI) or Windows performance counters. It can show the following:
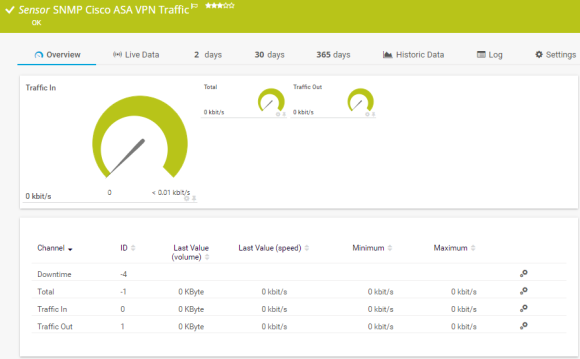
The SNMP Cisco ASA VPN Traffic sensor monitors the traffic of an Internet Protocol Security (IPsec) VPN connection on a Cisco Adaptive Security Appliance. It can show the following:
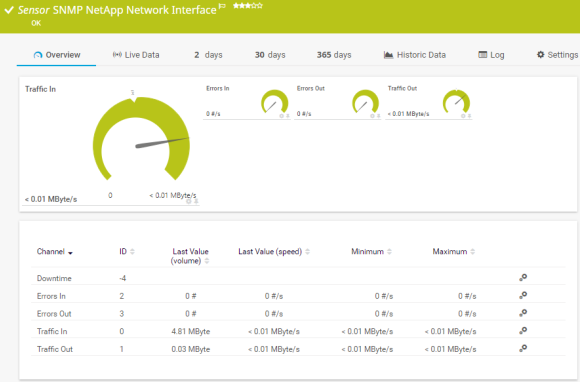
The SNMP NetApp Network Interface sensor monitors a network card of a NetApp storage system. It can show the following:
See the PRTG Manual for a list of all available sensor types.

Real-time notifications mean faster troubleshooting so that you can act before more serious issues occur.
Set up PRTG in minutes and use it on almost any mobile device.


“Excellent tool for detailed monitoring. Alarms and notifications work greatly. Equipment addition is straight forward and server initial setup is very easy. ...feel safe to purchase it if you intend to monitor a large networking landscape.”
Partnering with innovative IT vendors, Paessler unleashes synergies to create
new and additional benefits for joined customers.
Integrating monitoring results from PRTG into NetBrain maps makes the foundation for network automation.
IT that works constitutes a business-critical basis for a company's success. Availability and security must be defined for the respective purpose and closely monitored – by OT and IT alike.

With ScriptRunner Paessler integrates a powerful event automation platform into PRTG Network Monitor.
Custom alerts and data visualization let you quickly identify and prevent issues with low performance, slow network speed, bandwidth bottlenecks, and network congestion.
Network Monitoring Software – Version 24.4.102.1351 (November 12th, 2024)
Download for Windows and cloud-based version PRTG Hosted Monitor available
English, German, Spanish, French, Portuguese, Dutch, Russian, Japanese, and Simplified Chinese
Network devices, bandwidth, servers, applications, virtual environments, remote systems, IoT, and more
Choose the PRTG Network Monitor subscription that's best for you


Network throughput refers to the amount of data (without "overhead”) that can be transmitted by a network at any given time. It is usually displayed as an average and measured in bits per second (bps, mbps, gbps).
Throughput is an important value for measuring the performance of a network connection. Large numbers of lost data packets or errors during data transfers eventually lead to lower throughput and drops in performance.
If your network is slow and sluggish, one of the first things you’ll want to look at is your network throughput. Together with bandwidth, throughput plays a vital role in a network’s performance.
PRTG shows you which applications, users, and protocols consume the most bandwidth. As a result, you can take specific actions to free up space.
By monitoring statistics, you’ll be able to tell if shutting down individual applications and users is enough, or if you need to acquire more network bandwidth, use more network devices such as routers and switches, or implement more load balancing to optimize network performance.
Absolutely! PRTG provides comprehensive monitoring for network throughput across physical, virtual, and cloud environments, ensuring every aspect of your network's performance is covered.
While PRTG focuses on monitoring, it also includes robust security features like SSL encryption to secure your network communications. For enhanced security, consider integrating PRTG with specialized network security software to ensure your throughput remains unaffected by potential threats.
Yes! PRTG includes sensors for monitoring environmental conditions like temperature and humidity, which can impact network hardware performance. By ensuring optimal conditions, PRTG helps maintain consistent network throughput and prevents potential damage to your devices.
In PRTG, “sensors” are the basic monitoring elements. One sensor usually monitors one measured value in your network, for example the traffic of a switch port, the CPU load of a server, or the free space on a disk drive. On average, you need about 5-10 sensors per device or one sensor per switch port.
Paessler conducted trials in over 600 IT departments worldwide to tune its network monitoring software closer to the needs of sysadmins. The result of the survey: over 95% of the participants would recommend PRTG – or already have.

Paessler PRTG is used by companies of all sizes. Sysadmins love PRTG because it makes their job a whole lot easier.
Bandwidth, servers, virtual environments, websites, VoIP services – PRTG keeps an eye on your entire network.
Everyone has different monitoring needs. That’s why we let you try PRTG for free.