Custom alerts and data visualization let you quickly identify and prevent bandwidth hogs or bandwidth bottlenecks.
To keep your LAN infrastructure performing at its best, you need a comprehensive network monitoring software. Paessler PRTG acts as your all-in-one network diagnostics tool, providing insights to maintain peak performance, reduce downtime, and optimize user experience. From monitoring bandwidth usage to analyzing traffic patterns, PRTG delivers a complete health check of your network.
PRTG provides deep insights into your network’s bandwidth usage, traffic patterns, throughput, and QoS metrics. Customizable dashboards give you an at-a-glance overview of critical parameters, helping you detect issues early.
With threshold-based alerts, you’ll be notified the moment network performance drops, allowing for immediate action.
Our network bandwidth monitoring solution helps identify network bottlenecks by analyzing key performance metrics such as bandwidth utilization and response times.
When these thresholds aren’t met, PRTG’s notification system makes sure you can address the issues swiftly, keeping your network running at optimal efficiency.
PRTG supports a wide array of technologies and protocols for analyzing bandwidth consumption and traffic patterns, including SNMP, packet sniffing, NetFlow, sFlow, jFlow, and IPFIX, making it adaptable to any network setup.
With customizable alerts, you can tailor PRTG to focus on the most critical performance metrics for your infrastructure.
PRTG’s dashboards transform complex data into easily understandable visualizations, allowing you to quickly assess bandwidth usage, traffic, and performance.
These customizable dashboards let you prioritize the metrics that matter most to your operations, providing a clear view of your network’s health.
Diagnose network issues by continuously tracking network traffic data. Show traffic flow, bandwidth usage, quality of service (QoS) stats, and other key metrics in real time. Visualize monitoring data in clear graphs and dashboards to identify problems more easily. Gain the overview you need to troubleshoot critical applications as well as performance issues with your network devices.

Live traffic data graph in PRTG

Device tree view of the complete monitoring setup

Custom PRTG dashboard for keeping an eye on the entire IT infrastructure
Live traffic data graph in PRTG
Device tree view of the complete monitoring setup
“All-around winning
network monitor”
“The real beauty of PRTG is the endless possibilities it offers”
“PRTG Network Monitor
is very hard to beat”
PRTG is more than just a LAN bandwidth monitor – it provides comprehensive oversight for your entire IT infrastructure. From a unified platform, you can monitor everything from routers and switches to firewalls and network interfaces.
This integrated approach simplifies your monitoring, reduces tool redundancy, and gives you full visibility across your network.
In today’s fast-paced environment, timely information is critical. PRTG delivers real-time statistics and near-instant alerts, keeping you informed about your network’s status 24/7.
Whether it’s an unexpected traffic spike, a resource-heavy application, or a sudden outage, PRTG’s alerts ensure that issues are addressed before they impact performance.
PRTG doesn’t just monitor current conditions – it helps you stay ahead of potential issues. By setting custom thresholds for key metrics, PRTG alerts you before minor fluctuations become major disruptions.
This proactive approach helps optimize network uptime and performance, giving you the foresight needed to maintain smooth operations.
Despite its sophisticated capabilities, PRTG is designed for ease of use. The intuitive interface makes setup simple, and agentless monitoring means quick deployment.
With comprehensive visualization tools, you can easily manage your network’s health – even without extensive monitoring expertise.
PRTG comes with more than 250 native sensor types for monitoring your entire on-premises, cloud, and hybrid cloud environment out of the box. Check out some examples below!
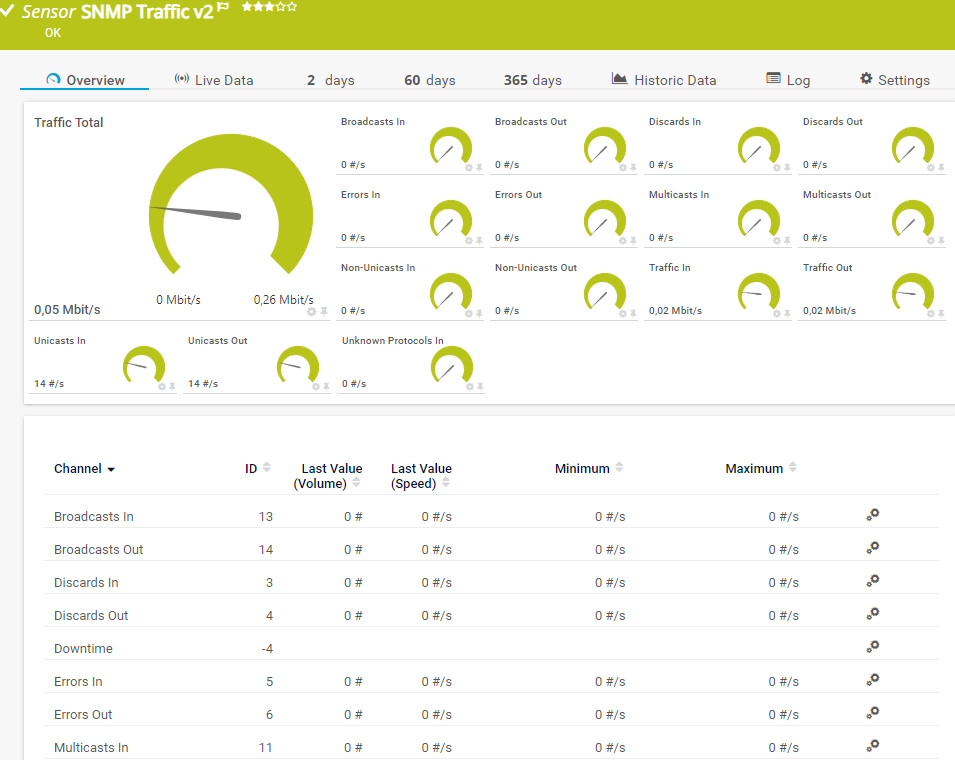
The SNMP Traffic v2 sensor monitors bandwidth and traffic on a device. It can show the following:
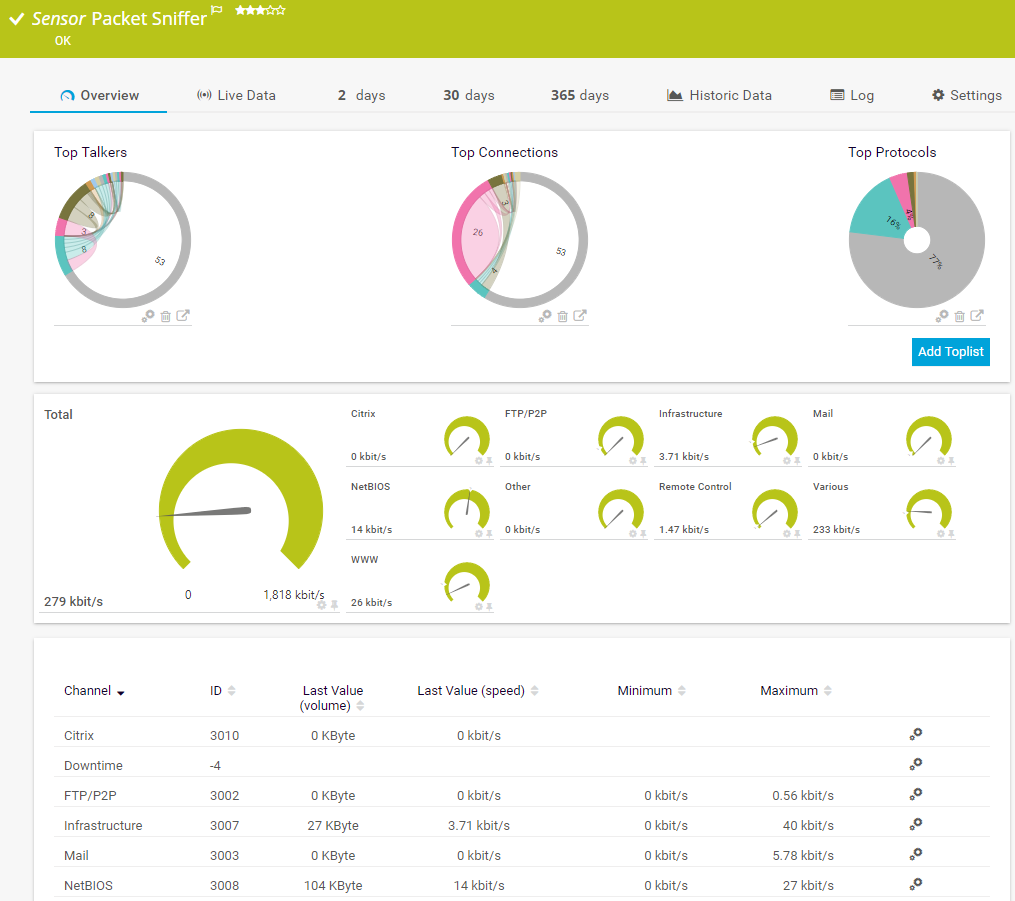
The Packet Sniffer sensor monitors the headers of data packets that pass a local network card using a built-in packet sniffer. You can choose from predefined channels. It can show the following and more:
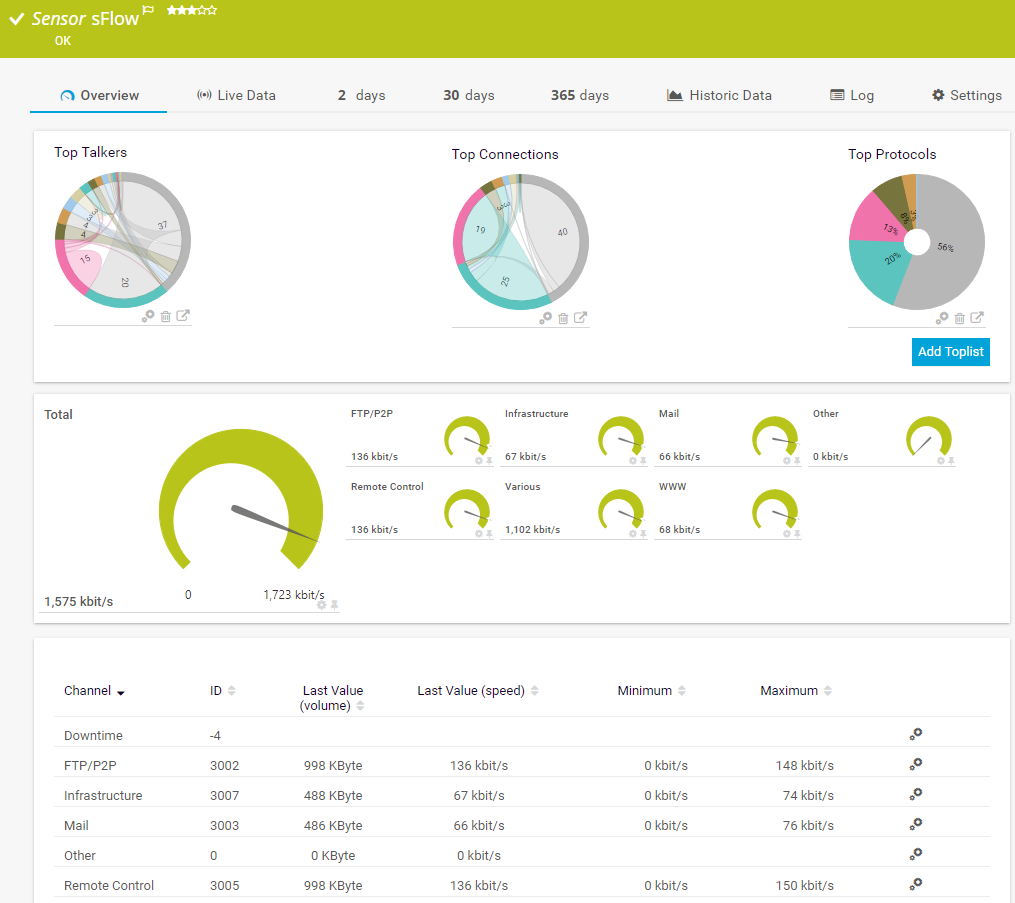
The sFlow sensor receives traffic data from an sFlow v5-compatible device and shows the traffic by type. This sensor has several filter options to divide traffic into different channels. It can show the following and more:
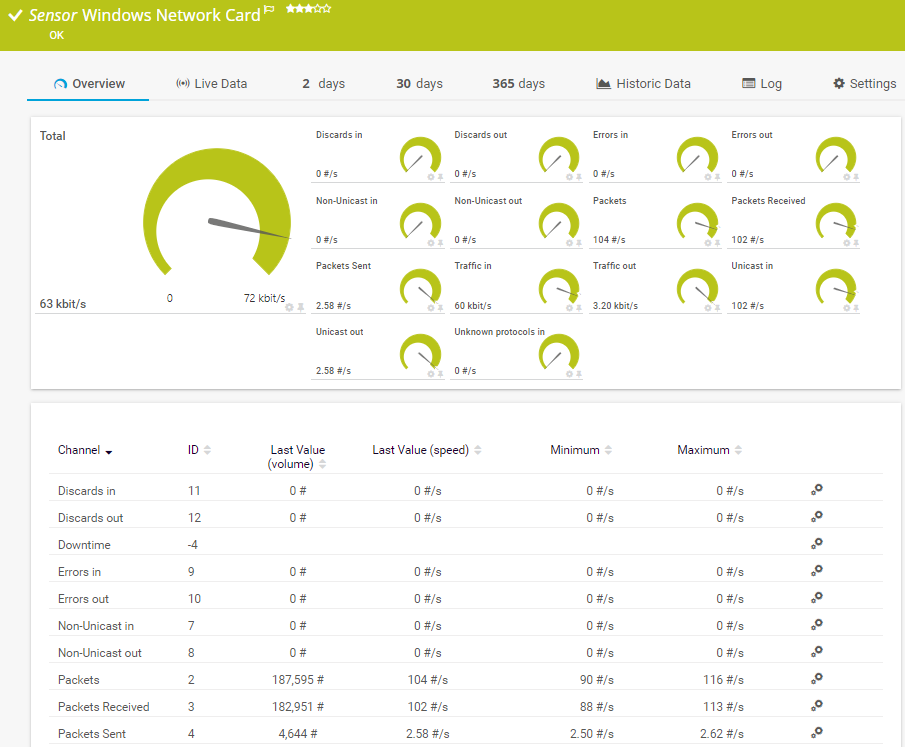
The Windows Network Card sensor monitors the bandwidth usage and traffic of a network interface via Windows Management Instrumentation (WMI) or Windows performance counters. It can show the following:
See the PRTG Manual for a list of all available sensor types.

Custom alerts and data visualization let you quickly identify and prevent bandwidth hogs or bandwidth bottlenecks.
PRTG is set up in a matter of minutes and can be used on a wide variety of mobile devices.


“Great interface, intuitive, full REST support. custom scripts, rest sensors add extra value. We have been using PRTG for 10 years now in multiple environments and use cases. it has by far the best interface and very easy to setup without prior experience.”
Partnering with innovative IT vendors, Paessler unleashes synergies to create
new and additional benefits for joined customers.
Integrating monitoring results from PRTG into NetBrain maps makes the foundation for network automation.
IT that works constitutes a business-critical basis for a company's success. Availability and security must be defined for the respective purpose and closely monitored – by OT and IT alike.

With ScriptRunner Paessler integrates a powerful event automation platform into PRTG Network Monitor.
Real-time notifications mean faster troubleshooting so that you can act before more serious issues occur.
Network Monitoring Software – Version 24.4.102.1351 (November 12th, 2024)
Download for Windows and cloud-based version PRTG Hosted Monitor available
English, German, Spanish, French, Portuguese, Dutch, Russian, Japanese, and Simplified Chinese
Network devices, bandwidth, servers, applications, virtual environments, remote systems, IoT, and more
Choose the PRTG Network Monitor subscription that's best for you


Absolutely! PRTG can provide detailed bandwidth usage data for specific devices, including routers, switches, or firewalls. Using SNMP or flow protocols, you get a granular view of where the most bandwidth is being consumed and which devices or applications are the most resource-intensive.
Indeed it does! PRTG is one of the bandwidth monitoring tools that is compatible with multiple data formats, including NetFlow, sFlow, IPFIX, and jFlow. This versatility ensures you can monitor network traffic from a wide array of devices, regardless of manufacturer.
PRTG acts as your network’s investigator. Its real-time monitoring, comprehensive reports, and threshold-based alerts make it easy to identify bottlenecks and bandwidth issues. You can quickly determine which applications or devices are consuming excessive bandwidth and take steps to optimize your network traffic distribution.
Absolutely! PRTG is designed to scale with your network, whether you’re managing a small business setup or a vast enterprise infrastructure. It supports distributed monitoring and multiple protocols, making it a powerful solution for networks of all sizes and complexities.
In PRTG, “sensors” are the basic monitoring elements. One sensor usually monitors one measured value in your network, for example the traffic of a switch port, the CPU load of a server, or the free space on a disk drive. On average, you need about 5-10 sensors per device or one sensor per switch port.
Paessler conducted trials in over 600 IT departments worldwide to tune its network monitoring software closer to the needs of sysadmins. The result of the survey: over 95% of the participants would recommend PRTG – or already have.

Paessler PRTG is used by companies of all sizes. Sysadmins love PRTG because it makes their job a whole lot easier.
Bandwidth, servers, virtual environments, websites, VoIP services – PRTG keeps an eye on your entire network.
Everyone has different monitoring needs. That’s why we let you try PRTG for free.