Custom alerts and data visualizations let you quickly identify and prevent bandwidth, memory, and other server performance issues.
Lots of different pieces need to work reliably, consistently, and in harmony for your servers to perform at their best.
One single bottleneck – not enough RAM, or a disk read-and-write error, for instance – could affect your whole IT infrastructure.
Paessler PRTG is designed to give you a complete view of all the metrics that could affect your server environment. Perfect for local and distributed networks, it keeps a constant eye on your hardware and software, so you can easily maintain (and improve) server availability, speed, and stability.

Diagnose network issues by continuously tracking CPUs, physical and logical drives, and other server components. Show disk usage, response time, memory utilization, uptime, CPU utilization, bandwidth, and other key metrics in real time. Visualize monitoring data in clear graphs and dashboards to identify problems more easily. Gain the overview you need to troubleshoot and fix bottlenecks, bad system resource utilization, and outages, and maximize server infrastructure performance.

Live traffic data graph in PRTG
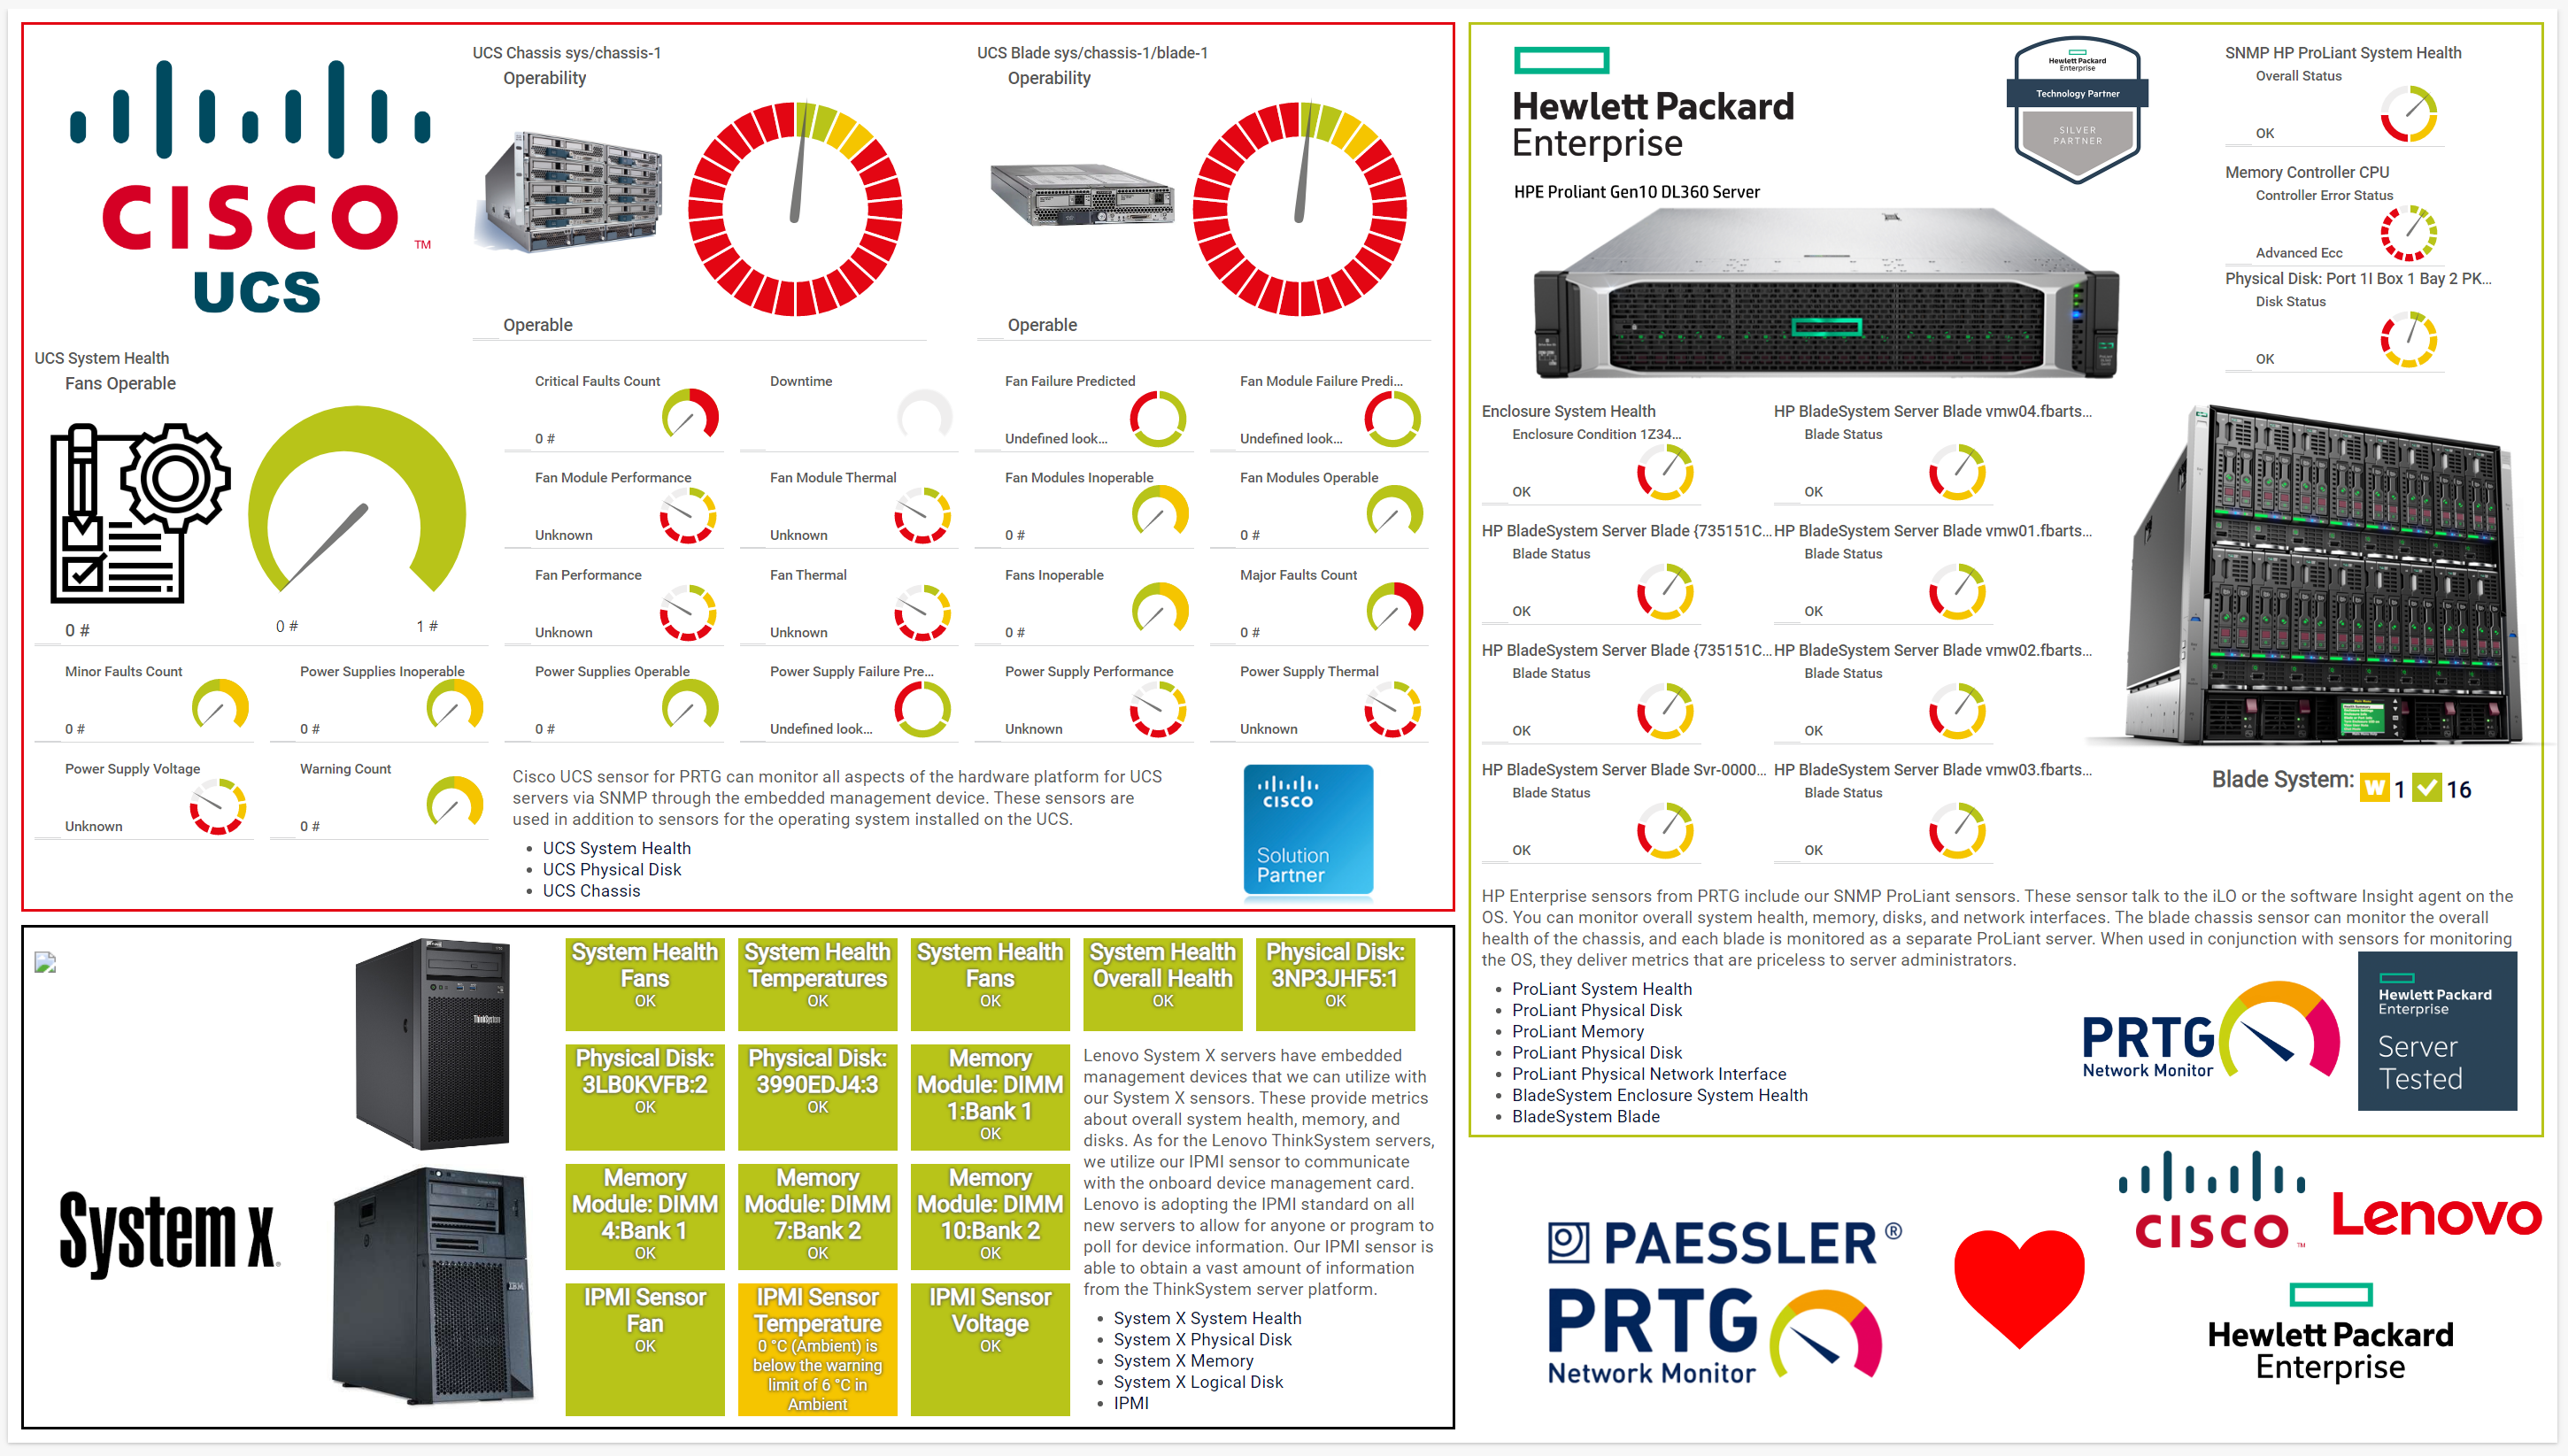
Dashboard Cisco, HPE, Lenovo in PRTG

Device tree view of the complete monitoring setup

Custom PRTG dashboard for keeping an eye on the entire IT infrastructure
Live traffic data graph in PRTG
Dashboard Cisco, HPE, Lenovo in PRTG
“All-around winning
network monitor”
“The real beauty of PRTG is the endless possibilities it offers”
“PRTG Network Monitor
is very hard to beat”
PRTG comes with more than 250 native sensor types for monitoring your entire on-premises, cloud, and hybrid cloud environment out of the box. Check out some examples below!
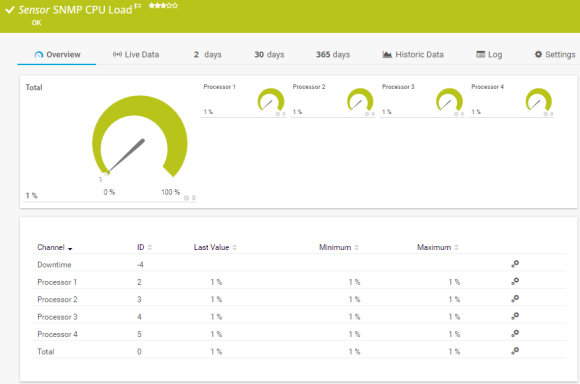
The SNMP CPU Load sensor monitors the system load. It can show the following:
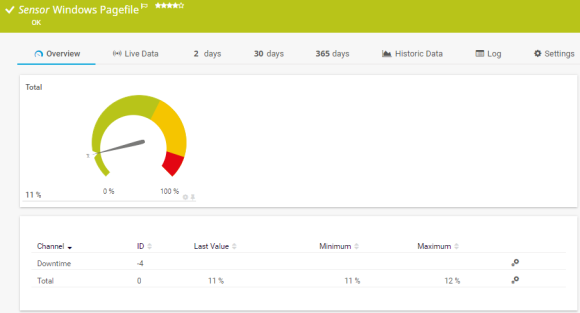
The Windows Pagefile sensor monitors the Windows pagefile usage via Windows Management Instrumentation (WMI) or Windows performance counters. It can show the following:
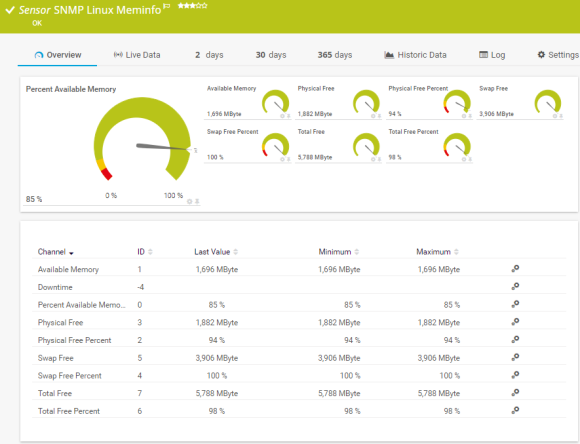
The SNMP Linux Meminfo sensor monitors the memory usage of a Linux/Unix system. It can show the following:
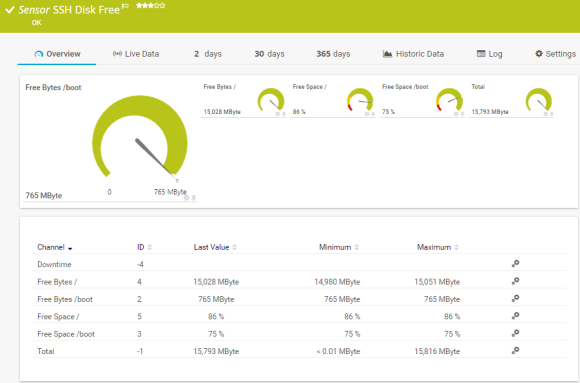
The SSH Disk Free sensor monitors the free space on disks of a Linux/Unix system using Secure Shell (SSH). It can show the following:
See the PRTG Manual for a list of all available sensor types.

Custom alerts and data visualizations let you quickly identify and prevent bandwidth, memory, and other server performance issues.
PRTG is set up in a matter of minutes and can be used on a wide variety of mobile devices.

As one of the leading players in the IT monitoring industry, Paessler has also become an authorized Dell partner for building integrated solutions around the Dell technology ecosystem.
What does this mean for you?
Partnering with innovative IT vendors, Paessler unleashes synergies to create
new and additional benefits for joined customers.

By integrating PRTG with Martello iQ, you can add a fast analytics layer to improve uptime, visualize your IT environment, and integrate all of your IT systems into a single pane of glass.
Integrating monitoring results from PRTG into NetBrain maps makes the foundation for network automation.

Siemon and Paessler bring together intelligent building technology and advanced monitoring and make your vision of intelligent buildings and data centers become reality.
Real-time notifications mean faster troubleshooting so that you can act before more serious issues occur.
Network Monitoring Software – Version 24.4.102.1351 (November 12th, 2024)
Download for Windows and cloud-based version PRTG Hosted Monitor available
English, German, Spanish, French, Portuguese, Dutch, Russian, Japanese, and Simplified Chinese
Network devices, bandwidth, servers, applications, virtual environments, remote systems, IoT, and more
Choose the PRTG Network Monitor subscription that's best for you


Server performance refers to how well a computer server does its job. It's like a waiter in a restaurant – good performance means it quickly and accurately serves your requests. Factors like speed, efficiency, and handling lots of tasks at once contribute to server performance. When a server performs well, websites load fast, and online activities run smoothly. Monitoring and improving server performance help ensure a better experience for users.
PRTG is a proprietary network monitoring system that takes the effort out of ensuring your servers always perform at their best. With more than 250 preconfigured sensors, our server monitoring software gives you a complete and comprehensive overview of every component that might impact your servers at a glance, so you can answer this question (and address the problem) double quick.
Available for Windows-based on-premises servers or as a cloud-hosted SaaS solution, it's capable of monitoring unlimited devices, bringing critical system data together in one simple, intuitive interface you can access from anywhere: at the office, at home, or on the go.
Not exactly. PRTG is a monitoring tool and no server performance test software. This means it's primarily designed to track performance metrics and alert you when they dip below pre-established thresholds, not to run tests.
That said, you can simulate performance tests in the following way:
Monitoring distributed servers with PRTG is as easy as it gets. Set up remote probes close to the endpoints of the servers you want to monitor, and PRTG will gather the performance data for you in one place. No more trips to remote server farms (unless you fancy one).
In PRTG, “sensors” are the basic monitoring elements. One sensor usually monitors one measured value in your network, for example the traffic of a switch port, the CPU load of a server, or the free space on a disk drive. On average, you need about 5-10 sensors per device or one sensor per switch port.
Paessler conducted trials in over 600 IT departments worldwide to tune its network monitoring software closer to the needs of sysadmins. The result of the survey: over 95% of the participants would recommend PRTG – or already have.

Paessler PRTG is used by companies of all sizes. Sysadmins love PRTG because it makes their job a whole lot easier.
Bandwidth, servers, virtual environments, websites, VoIP services – PRTG keeps an eye on your entire network.
Everyone has different monitoring needs. That’s why we let you try PRTG for free.