TP-Link monitoring with PRTG
Keep a 24/7 eye on the health and performance of your business routers and switches
- Centrally monitor traffic, system status, and firmware updates
- Receive instant, real-time alerts on potential issues
- Deploy SNMP, flow, syslog, and other technologies for detailed insights
PRTG TP-Link monitoring: What you’ll find on this page
PRTG makes TP-Link monitoring as easy as it gets
Custom alerts and data visualization let you quickly identify and prevent connectivity and performance issues on your routers and switches.
Gain an ally in technical support with PRTG’s TP-Link monitoring
TP-Link equipment is known for being reliable and affordable, making it a favorite for home and business networks alike. Still, even the best hardware needs consistent monitoring to keep it running well. That's where Paessler PRTG comes in. It provides a comprehensive way to ensure your TP-Link routers, switches, access points, and other devices are available and performing at their best.
Easy network device integration
Managing and monitoring TP-Link devices across diverse network environments can be complex and time-consuming without a unified, compatible solution.
PRTG has the exact tools to oversee your TP-Link hardware effectively. It works with both everyday and professional TP-Link devices, smart plugs, power adapters, and popular routers, providing a full picture of your network.
Quick installation and setup
Nobody wants to waste time getting a monitoring system up and running. PRTG stands out with its plug-and-play approach so you can begin collecting information from your routers and switches in minutes.
Just enable SNMP on your devices, load the required MIB files, and PRTG will start showing you real-time data on your network's performance.
Beyond the monitoring basics
Basic monitoring tools lack the depth needed to uncover performance bottlenecks, resource inefficiencies, and potential security vulnerabilities in network devices.
Beyond simple checks for connectivity, PRTG tracks important factors such as CPU usage, bandwidth, and unusual network traffic. This detailed oversight helps you spot performance issues, identify resource-intensive processes, and fine-tune your network for better efficiency.
Prevent problems before they start
Prevent issues instead of fixing them after they happen. By constantly monitoring your TP-Link devices, PRTG can detect potential issues and alert you before they impact your users.
If PRTG notices a sudden increase in bandwidth usage on a particular interface, for example, you can identify the cause and take steps before it leads to network congestion. With monitoring the uptime of your TP-Link routers, you can catch connectivity problems that could affect important services.
Custom alerts and notifications
Delayed responses to network issues can risk data loss and more. PRTG's real-time alert system lets you set custom thresholds for important metrics. Receive instant notifications via email, SMS, or push notifications when something unusual does occur.
Take alerts to the next level by customizing your alerts to suit. Create template-based escalation levels and make sure that the right team is informed at the right time.
What TP-Link monitoring looks like in PRTG
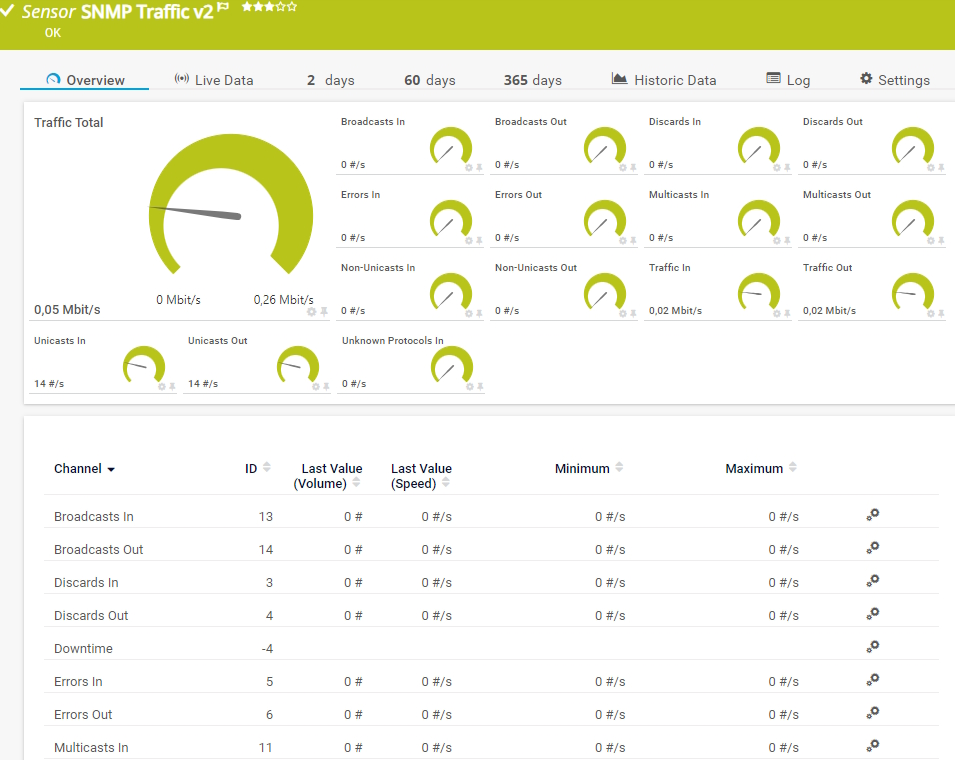
Diagnose network issues by continuously tracking the availability, health, and performance of your TP-Link network devices. Show uptime, hardware health, CPU load, memory usage, data traffic, bandwidth usage, and other key metrics in real time. Visualize monitoring data in clear graphs and dashboards to identify problems more easily. Gain the overview you need to troubleshoot all kinds of issues with your TP-Link environment.
Start monitoring TP-Link devices with PRTG and see how it can make your network more reliable and your job easier.
4 more reasons why to choose PRTG as your TP-Link monitoring tool
Get an all-in-one monitoring tool
It’s common to have a mix of hardware from different brands in a network. PRTG offers a single network management system that includes monitoring TP-Link devices and more.
Monitor your entire network, including firewalls, servers, applications, and cloud services, from one easy-to-use dashboard.
Customize and scale to fit your need
Every network is different. PRTG's flexible sensor system allows you to customize your monitoring setup to meet your exact needs.
Whether you're monitoring a few routers or hundreds of devices across multiple locations, PRTG scales smoothly.
Enjoy a user-friendly interface
PRTG's straightforward web interface and apps for mobile devices (available for iOS and Android) make it simple to check your network's status anytime, anywhere.
Customizable dashboards allow you to view important information quickly, while detailed options provide deeper insights when needed. This user-friendly interface ensures you can quickly find the information needed to make decisions without getting bogged down in complicated settings.
Generate detailed reports
With PRTG's reporting system, you can easily generate comprehensive reports on your TP-Link devices' performance over time.
These reports provide useful data for understanding long-term patterns and help you make informed decisions about capacity planning, upgrades, and troubleshooting.
Your TP-Link monitor at a glance – even on the go
Set up PRTG in minutes and use it on almost any mobile device.


Find the root cause of the problem with our PRTG TP-Link monitoring solution
Real-time notifications mean faster troubleshooting so that you can act before more serious issues occur.
PRTG is compatible with all major vendors, products, and systems
Explore our preconfigured PRTG sensors for TP-Link monitoring
PRTG comes with more than 250 native sensor types for monitoring your entire on-premises, cloud, and hybrid cloud environment out of the box. Check out some examples below!
Create innovative solutions with Paessler’s partners
Partnering with innovative vendors, Paessler unleashes synergies to create
new and additional benefits for joined customers.
INSYS icom
With the combination of PRTG and Insys, the monitoring specialist Paessler and the industrial gateway manufacturer INSYS icom offer a practical possibility to merge IT and OT.
“Excellent tool for detailed monitoring. Alarms and notifications work greatly. Equipment addition is straight forward and server initial setup is very easy. ...feel safe to purchase it if you intend to monitor a large networking landscape.”
Infrastructure and Operations Engineer in the Communications Industry, firm size 10B - 30B USD
PRTG makes TP-Link monitoring as easy as it gets
Custom alerts and data visualization let you quickly identify and prevent connectivity and performance issues on your routers and switches.

PRTG: The multi-tool for sysadmins
Adapt PRTG individually and dynamically to your needs and rely on a strong API:- HTTP API: Access monitoring data and manipulate monitoring objects via HTTP requests
- Custom sensors: Create your own PRTG sensors for customized monitoring
- Custom notifications: Create your own notifications and send action triggers to external systems
- REST Custom sensor: Monitor almost everything that provides data in XML or JSON format
We asked: would you recommend PRTG?
Over 95% of our customers say yes!
Paessler conducted trials in over 600 IT departments worldwide to tune its network monitoring software closer to the needs of sysadmins.
The result of the survey: over 95% of the participants would recommend PRTG – or already have.
Still not convinced?
More than 500,000
sysadmins love PRTG
Paessler PRTG is used by companies of all sizes. Sysadmins love PRTG because it makes their job a whole lot easier.
Monitor your entire IT infrastructure
Bandwidth, servers, virtual environments, websites, VoIP services – PRTG keeps an eye on your entire network.
Try Paessler PRTG
for free
Everyone has different monitoring needs. That’s why we let you try PRTG for free.
Start monitoring TP-Link devices with PRTG and see how it can make your network more reliable and your job easier.
|
PRTG |
Network Monitoring Software - Version 25.1.104.1961 (April 7th, 2025) |
|
Hosting |
Download for Windows and cloud-based version PRTG Hosted Monitor available |
Languages |
English, German, Spanish, French, Portuguese, Dutch, Russian, Japanese, and Simplified Chinese |
Pricing |
Up to 100 sensors for free (Price List) |
Unified Monitoring |
Network devices, bandwidth, servers, applications, virtual environments, remote systems, IoT, and more |
Supported Vendors & Applications |
|


