![]()
Oracle monitoring with PRTG
Maintain Oracle database integrity and accuracy
- Monitor Oracle SQL database availability and health round the clock
- Get immediately alerted in case of peformance problems
- Easily spot and drill down to database errors before they go critical
Our users give top ratings for monitoring with Paessler PRTG


PRTG Oracle monitoring: What you’ll find on this page

PRTG makes monitoring Oracle databases as easy as it gets
Custom alerts and data visualizations let you quickly identify and prevent corrupted data, hardware errors, low disk space, and other database performance issues.
Automated monitoring for Oracle databases of all shapes and sizes
SQL databases are an absolutely critical part of your network.
They keep your data accurate, consistent, and reliable, and applications and services working efficiently. More importantly, they ensure your organization runs smoothly (and your colleagues and bosses are happy).
Don't let corrupt data, faulty configurations, and other database issues bring your network down. With Paessler PRTG's powerful network monitoring software, you can consistently maintain optimal availability and performance.
3 reasons why to choose PRTG as your monitoring tool
A single source of truth
All your database health stats in one place. Get a comprehensive overview of hardware status, availability, execution times, read/write speed, disk space, memory, and other important database performance indicators, and prepare reports for your higher-ups in a few clicks.
Effortless customization
Want to monitor specific parameters using self-defined SQL queries? Need to create custom reports or optimize business processes? PRTG has got you covered. Our Oracle monitoring software is flexible by design, so you can choose what to track and how the data's presented.
Better performance
When it comes to your network's health, prevention is always better than cure. PRTG spots potential issues before they become critical errors. That means they're easier and quicker to fix, saving you stress and frustration (and angry calls from annoyed colleagues).
What Oracle observability looks like in PRTG
Diagnose network issues by continuously tracking Oracle database servers across your network. Show response times, wait times, disk space, active sessions, and other performance metrics in real time. Visualize monitoring data in clear graphs and dashboards to identify problems more easily. Gain the overview you need to troubleshoot configuration errors, underperformance, and other issues with your Oracle instances for enhanced end-user experience.

Device tree view of the complete monitoring setup
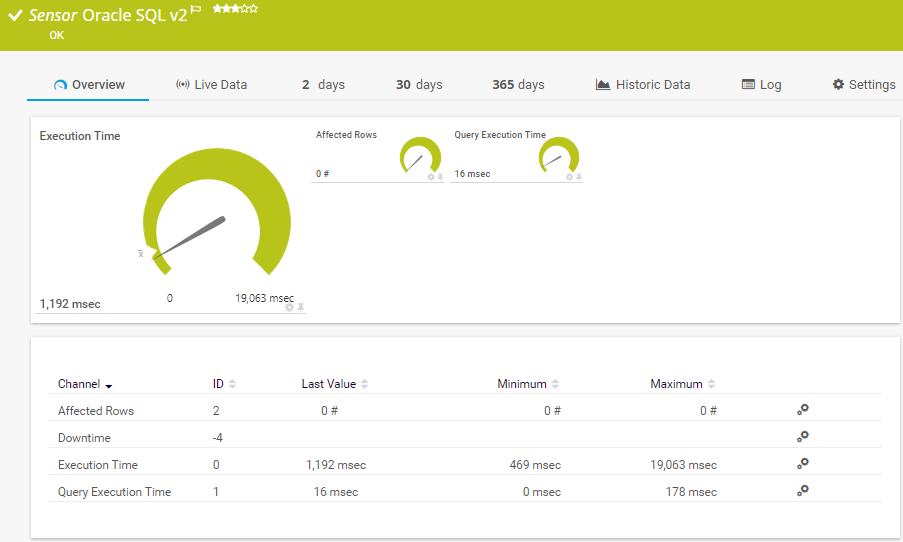
Oracle SQL v2 sensor in PRTG
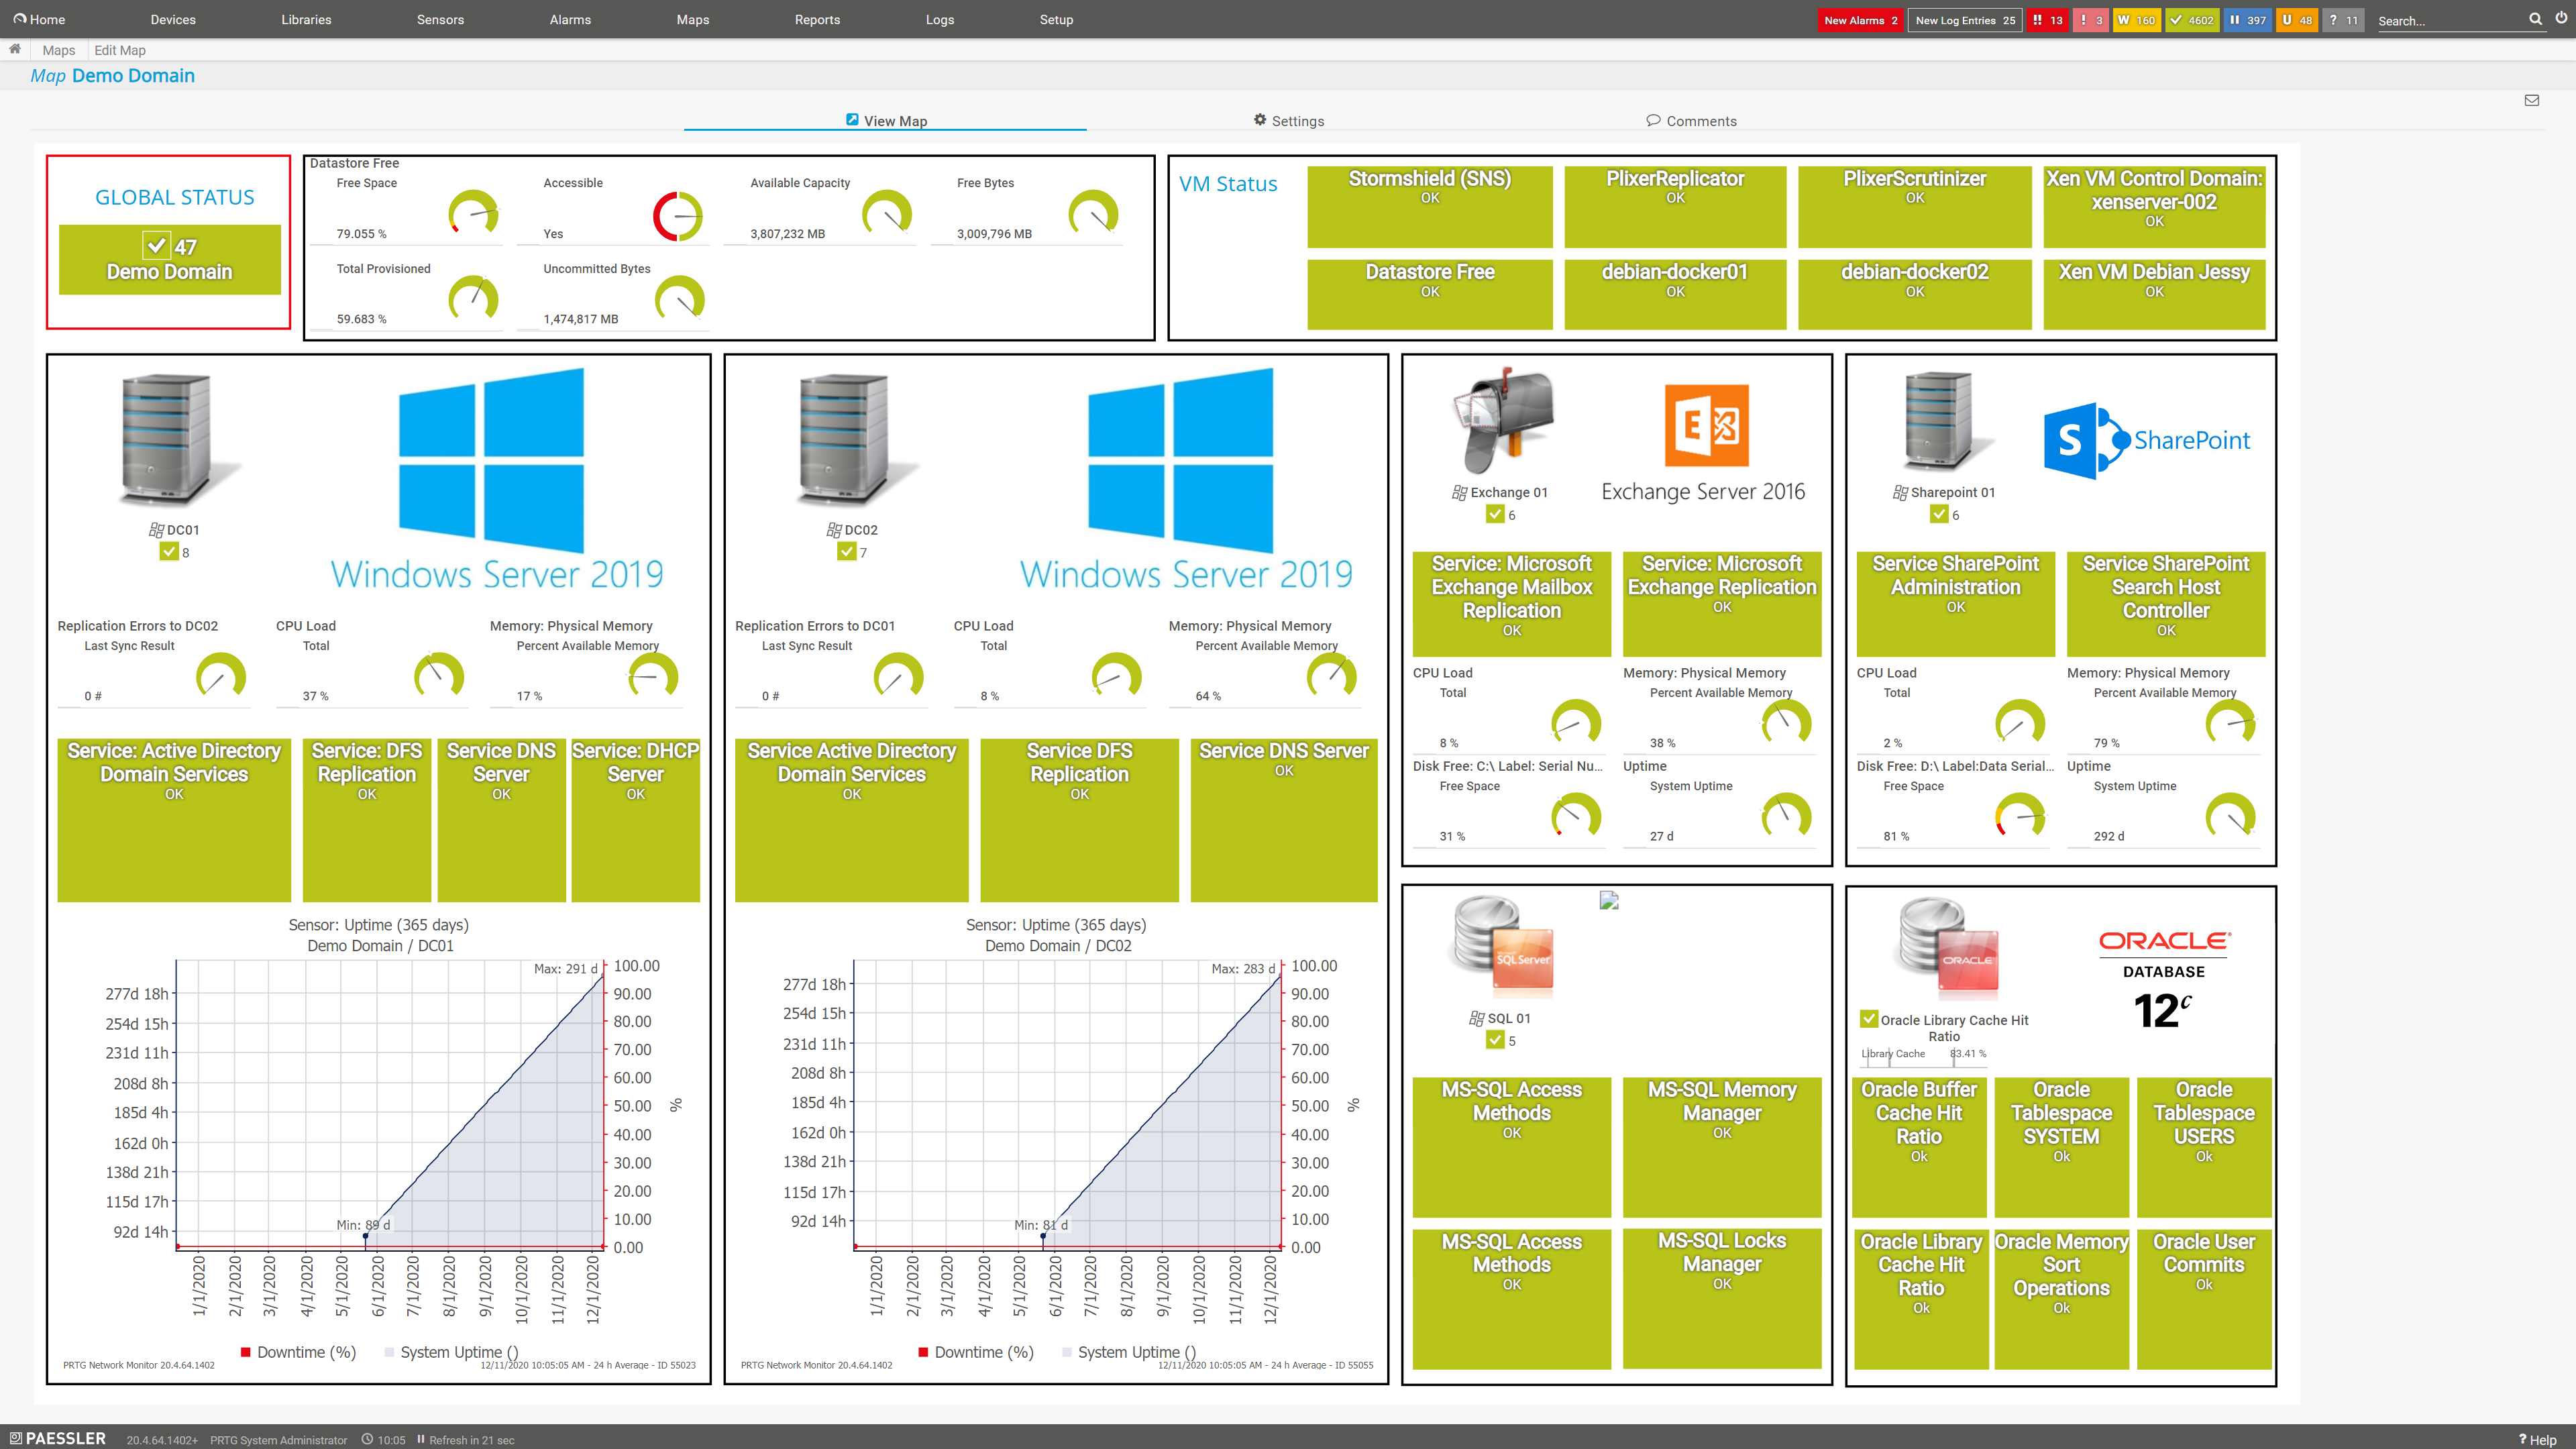
Custom PRTG dashboard for keeping an eye on the entire IT infrastructure
Start Oracle monitoring with PRTG and see how it can make your network more reliable and your job easier.
IT experts agree: Paessler PRTG is a great solution for IT infrastructure monitoring

“All-around winning
network monitor”

“The real beauty of PRTG is the endless possibilities it offers”

“PRTG Network Monitor
is very hard to beat”
How to monitor database instances: PRTG Oracle-monitoring in action
PRTG's preconfigured sensors for Oracle monitoring track key stats of your Oracle SL databases round the clock. If something isn't working as it should, PRTG alerts you straight away via SMS, email, in-app push notification, and other methods, so you can troubleshoot and fix the issue double quick.
PRTG is compatible with all major vendors, products, and systems
![]()
Your Oracle monitor at a glance – even on the go
Set up PRTG in minutes and use it on almost any mobile device.


Find the root cause of the problem with our PRTG Oracle monitoring solution
Real-time notifications mean faster troubleshooting so that you can act before more serious issues occur.
Create innovative solutions with Paessler’s partners
Partnering with innovative vendors, Paessler unleashes synergies to create
new and additional benefits for joined customers.


UVnetworks
UVexplorer integrates tightly with PRTG to bring fast and accurate network discovery, detailed device inventory, and automatic network mapping to the PRTG platform.
“Excellent tool for detailed monitoring. Alarms and notifications work greatly. Equipment addition is straight forward and server initial setup is very easy. ...feel safe to purchase it if you intend to monitor a large networking landscape.”
Infrastructure and Operations Engineer in the Communications Industry, firm size 10B - 30B USD
PRTG makes monitoring Oracle databases as easy as it gets
Custom alerts and data visualizations let you quickly identify and prevent corrupted data, hardware errors, low disk space, and other database performance issues.

PRTG: The multi-tool for sysadmins
Adapt PRTG individually and dynamically to your needs and rely on a strong API:- HTTP API: Access monitoring data and manipulate monitoring objects via HTTP requests
- Custom sensors: Create your own PRTG sensors for customized monitoring
- Custom notifications: Create your own notifications and send action triggers to external systems
- REST Custom sensor: Monitor almost everything that provides data in XML or JSON format
More than just a monitoring tool:
Reasons our customers love PRTG


Still not convinced?
![]()
More than 500,000
sysadmins love PRTG
Paessler PRTG is used by companies of all sizes. Sysadmins love PRTG because it makes their job a whole lot easier.
![]()
Monitor your entire IT infrastructure
Bandwidth, servers, virtual environments, websites, VoIP services – PRTG keeps an eye on your entire network.
![]()
Try Paessler PRTG
for free
Everyone has different monitoring needs. That’s why we let you try PRTG for free.
![]()
Start Oracle monitoring with PRTG and see how it can make your network more reliable and your job easier.
|
PRTG |
Network Monitoring Software - Version 25.1.104.1961 (April 7th, 2025) |
|
Hosting |
Download for Windows and cloud-based version PRTG Hosted Monitor available |
Languages |
English, German, Spanish, French, Portuguese, Dutch, Russian, Japanese, and Simplified Chinese |
Pricing |
Up to 100 sensors for free (Price List) |
Unified Monitoring |
Network devices, bandwidth, servers, applications, virtual environments, remote systems, IoT, and more |
Supported Vendors & Applications |
|
Discover more monitoring insights and stories

Solutions for all your monitoring needs

Powerful stories from the monitoring world

Combining the broad monitoring feature set of PRTG with IP Fabric’s automated network assurance creates a new level of network visibility and reliability.