Custom alerts and data visualization let you quickly identify and prevent packet loss, latency, and other network performance issues.
Get all-in-one network monitoring with PRTG
Although other free online tools measure network speed, only PRTG gives you comprehensive network monitoring for more in-depth analysis.
In professional settings, PRTG helps admins keep an eye on their network speed, data transmission, and network throughput. This way, you can identify the areas that are putting too much strain on your network.
PRTG helps you sort through the many different reasons for a network slowing down. Individual applications may turn out to be bandwidth hogs. Backups can lead to problems with data throughput.
And sometimes the problem lies in an overloaded switch, or an outdated router that is unable to process the increased amount of traffic. PRTG helps you get to the bottom of the issue quickly.
Open-source software, a complex array of specialized speed test tools, or PRTG all-in-one monitoring software? The choice should be easy. PRTG is a centralized tool that identifies, measures, and tests all the important data in your network, saving you time and stress.
You can also access historical data on bandwidth consumption over longer periods of time, and use the built-in reporting system to create custom reports.
Diagnose network issues by continuously tracking network bandwidth usage and speed. Show network traffic flow data, bandwidth utilization, VoIP and QoS measurements, latency, upload and download speeds, and other key metrics in real time. Visualize monitoring data in clear graphs and dashboards to identify problems more easily. Gain the overview you need to troubleshoot bandwidth bottlenecks and other network performance issues.

Live traffic data graph in PRTG

Device tree view of the complete monitoring setup

Custom PRTG dashboard for keeping an eye on the entire IT infrastructure
Live traffic data graph in PRTG
Device tree view of the complete monitoring setup
“All-around winning
network monitor”
“The real beauty of PRTG is the endless possibilities it offers”
“PRTG Network Monitor
is very hard to beat”
PRTG comes with more than 250 native sensor types for monitoring your entire on-premises, cloud, and hybrid cloud environment out of the box. Check out some examples below!
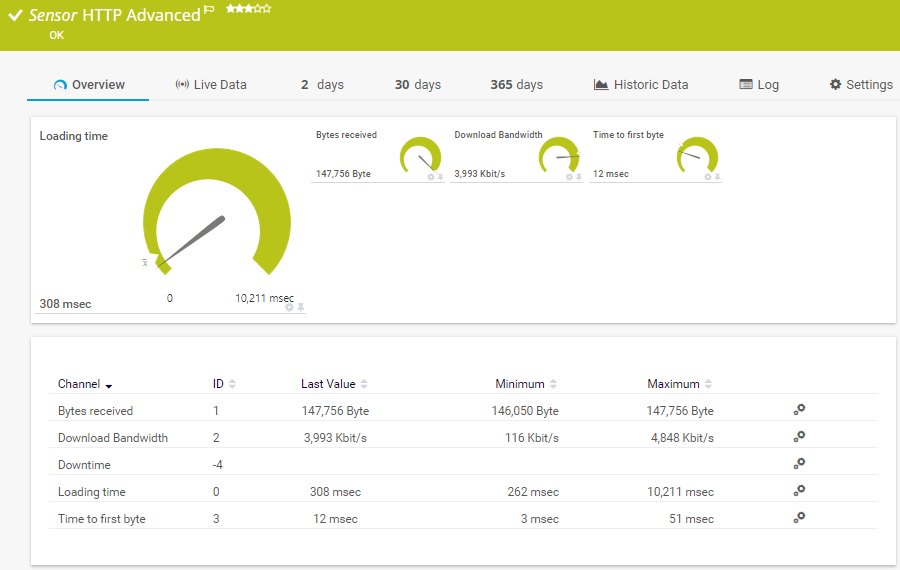
The HTTP Advanced sensor monitors the source code of a web page using HTTP. It supports authentication, content checks, and other advanced parameters. It can show the following:
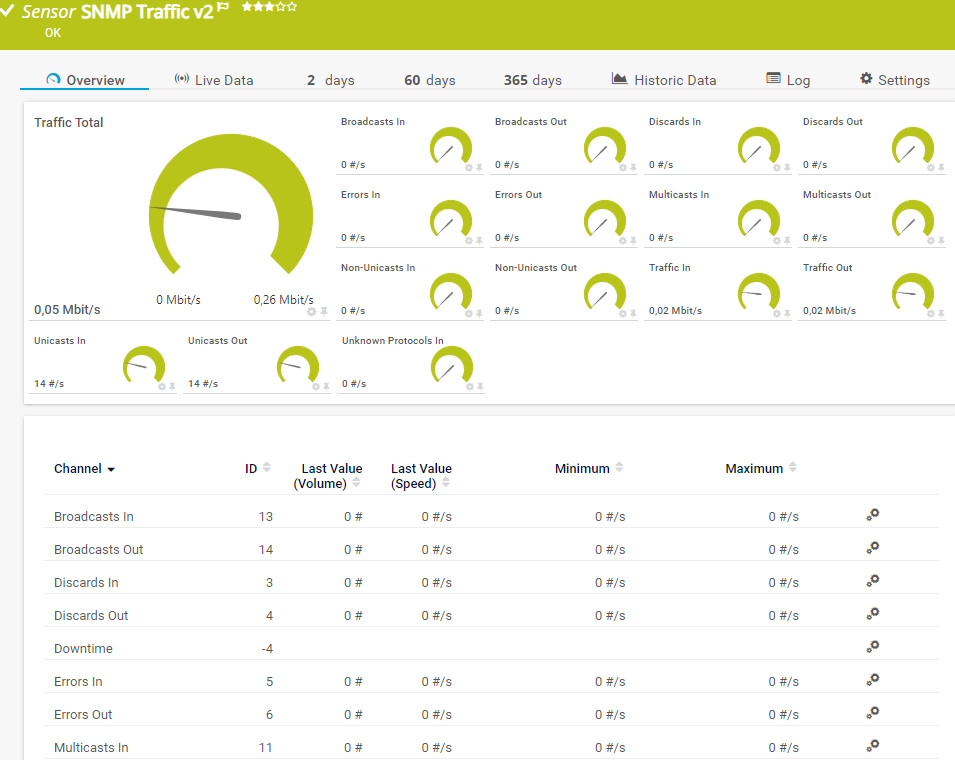
The SNMP Traffic v2 sensor monitors bandwidth and traffic on a device. It can show the following:
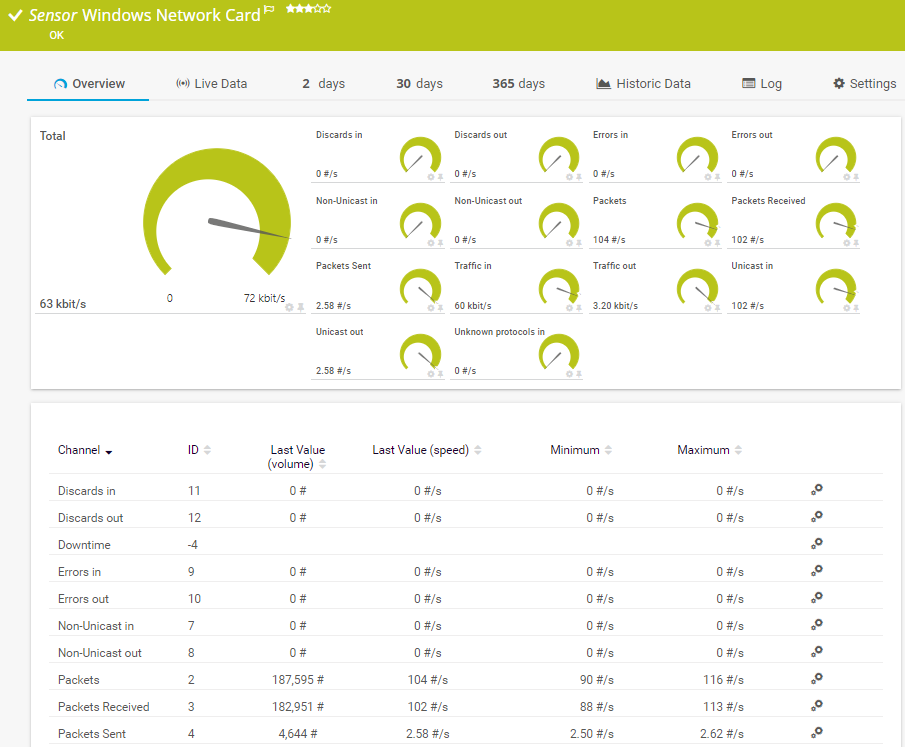
The Windows Network Card sensor monitors the bandwidth usage and traffic of a network interface via Windows Management Instrumentation (WMI) or Windows performance counters. It can show the following:
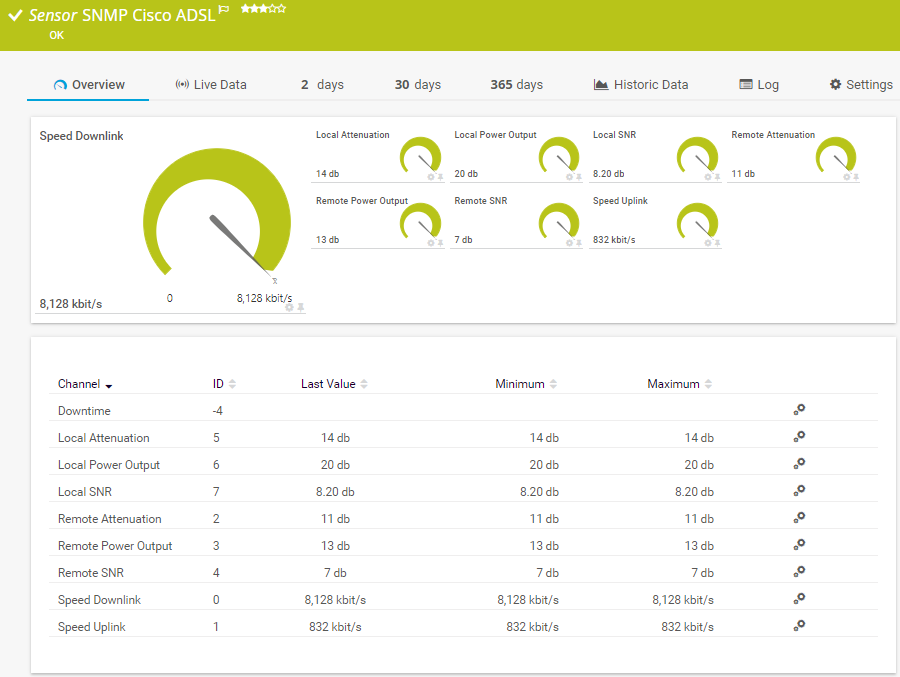
The SNMP Cisco ADSL sensor monitors asymmetric digital subscriber line (ADSL) statistics of a Cisco router. It can show the following:
See the PRTG Manual for a list of all available sensor types.

Custom alerts and data visualization let you quickly identify and prevent packet loss, latency, and other network performance issues.
PRTG is set up in a matter of minutes and can be used on a wide variety of mobile devices.


“Excellent tool for detailed monitoring. Alarms and notifications work greatly. Equipment addition is straight forward and server initial setup is very easy. ...feel safe to purchase it if you intend to monitor a large networking landscape.”
Partnering with innovative IT vendors, Paessler unleashes synergies to create
new and additional benefits for joined customers.

By integrating PRTG with Martello iQ, you can add a fast analytics layer to improve uptime, visualize your IT environment, and integrate all of your IT systems into a single pane of glass.

With ScriptRunner Paessler integrates a powerful event automation platform into PRTG Network Monitor.

UVexplorer integrates tightly with PRTG to bring fast and accurate network discovery, detailed device inventory, and automatic network mapping to the PRTG platform.
Real-time notifications mean faster troubleshooting so that you can act before more serious issues occur.
Network Monitoring Software – Version 24.4.102.1351 (November 12th, 2024)
Download for Windows and cloud-based version PRTG Hosted Monitor available
English, German, Spanish, French, Portuguese, Dutch, Russian, Japanese, and Simplified Chinese
Network devices, bandwidth, servers, applications, virtual environments, remote systems, IoT, and more
Choose the PRTG Network Monitor subscription that's best for you


Network speed, often referred to as network bandwidth or data transfer rate, is defined as the amount of data that can be transmitted over a network connection in a given period of time. It is typically measured in bits per second (bps), along with larger units like kilobits per second (Kbps), megabits per second (Mbps), and gigabits per second (Gbps).
A 100 Mbps connection means:
Network speed monitoring is the process of measuring and tracking the performance of a network in terms of its speed, bandwidth utilization, latency, and other related metrics. The goal is to ensure the network operates efficiently, troubleshoot performance issues, and optimize resource usage.
Key components of network speed monitoring include:
Testing network transmission speed is important for a variety of reasons, as it provides valuable insights into the performance, reliability, and efficiency of your network. Here are some key reasons why you should regularly test your network transmission speed:
You’ll get a good feel for the possible transmission speed, even if the actual bandwidth is unable to be determined with 100% accuracy. Be sure to practice good judgment when carrying out this procedure to avoid putting unnecessary strain on your data line.
In PRTG, “sensors” are the basic monitoring elements. One sensor usually monitors one measured value in your network, for example the traffic of a switch port, the CPU load of a server, or the free space on a disk drive. On average, you need about 5-10 sensors per device or one sensor per switch port.
Paessler conducted trials in over 600 IT departments worldwide to tune its network monitoring software closer to the needs of sysadmins. The result of the survey: over 95% of the participants would recommend PRTG – or already have.

Paessler PRTG is used by companies of all sizes. Sysadmins love PRTG because it makes their job a whole lot easier.
Bandwidth, servers, virtual environments, websites, VoIP services – PRTG keeps an eye on your entire network.
Everyone has different monitoring needs. That’s why we let you try PRTG for free.