![]()
Database performance monitoring with PRTG
Reduce the impact of bottlenecks on your database systems
- Monitor databases of any size and complexity in real time
- Quickly diagnose the root causes of performance problems
- Learn the best path forward for proactive database optimization
Our users give top ratings for monitoring with Paessler PRTG


PRTG database performance monitoring: What you’ll find on this page

PRTG makes database monitoring as easy as it gets
Custom alerts and data visualization let you quickly identify and prevent performance issues such as slow response times or hardware overloads.
Fix issues fast & optimize database performance with PRTG
Performance bottlenecks lead to serious business impacts, such as slow responses, delayed transactions, and poor end user experience. Paessler PRTG, your all-in-one database monitoring tool, helps keep your colleagues happy by making sure your databases stay reliable, fast, and efficient.
Monitor & manage database resource usage
Performance degradation is a slowly growing beast that can often be left by the wayside. Without proper resource consumption monitoring, your relational database system can suffer system overloads, data corruption, and higher operational costs, among other issues.
PRTG makes degradation a thing of the past by helping with load balancing and database optimization.
Check query performance to locate bad actors
Monitoring query performance metrics is the key to smooth, responsive applications. PRTG database performance monitoring provides a range of query data, such as execution time, how they’re written, whether they effectively use indexes, and how resources are used.
Get the data you need to locate and optimize slow queries.
Identify & track errors and failures in real time
High error rates point to underlying issues that can significantly impact your business processes. If these errors aren’t addressed, they can lead to system downtime, data loss, and worse.
PRTG helps database administrators quickly identify failed queries, connectivity problems, hardware malfunctions, and more, so problems can be proactively resolved.
Easily handle multiple user sessions
When your database has multiple users, high performance and efficient data access are crucial for a good user experience. Concurrency control makes sure that each user and operation can access the database without issues with integrity.
PRTG helps by tracking locking mechanisms, deadlocks, and isolation levels, so you can optimize for concurrent access.
Back up your backup with replication monitoring
Copying data from one database SQL server to another helps maintain data redundancy and high availability in the event of data loss or corruption.
PRTG checks your backups and helps verify that data is being accurately copied and stored, providing defense against data loss and failures.
What database performance monitoring looks like in PRTG
Diagnose network issues by continuously tracking response time, latency, query execution time, and hardware health. Show key database performance metrics in real time. Visualize monitoring data in clear graphs and dashboards to identify problems more easily. Gain the overview you need to troubleshoot database bottlenecks, outages, and other database performance issues.
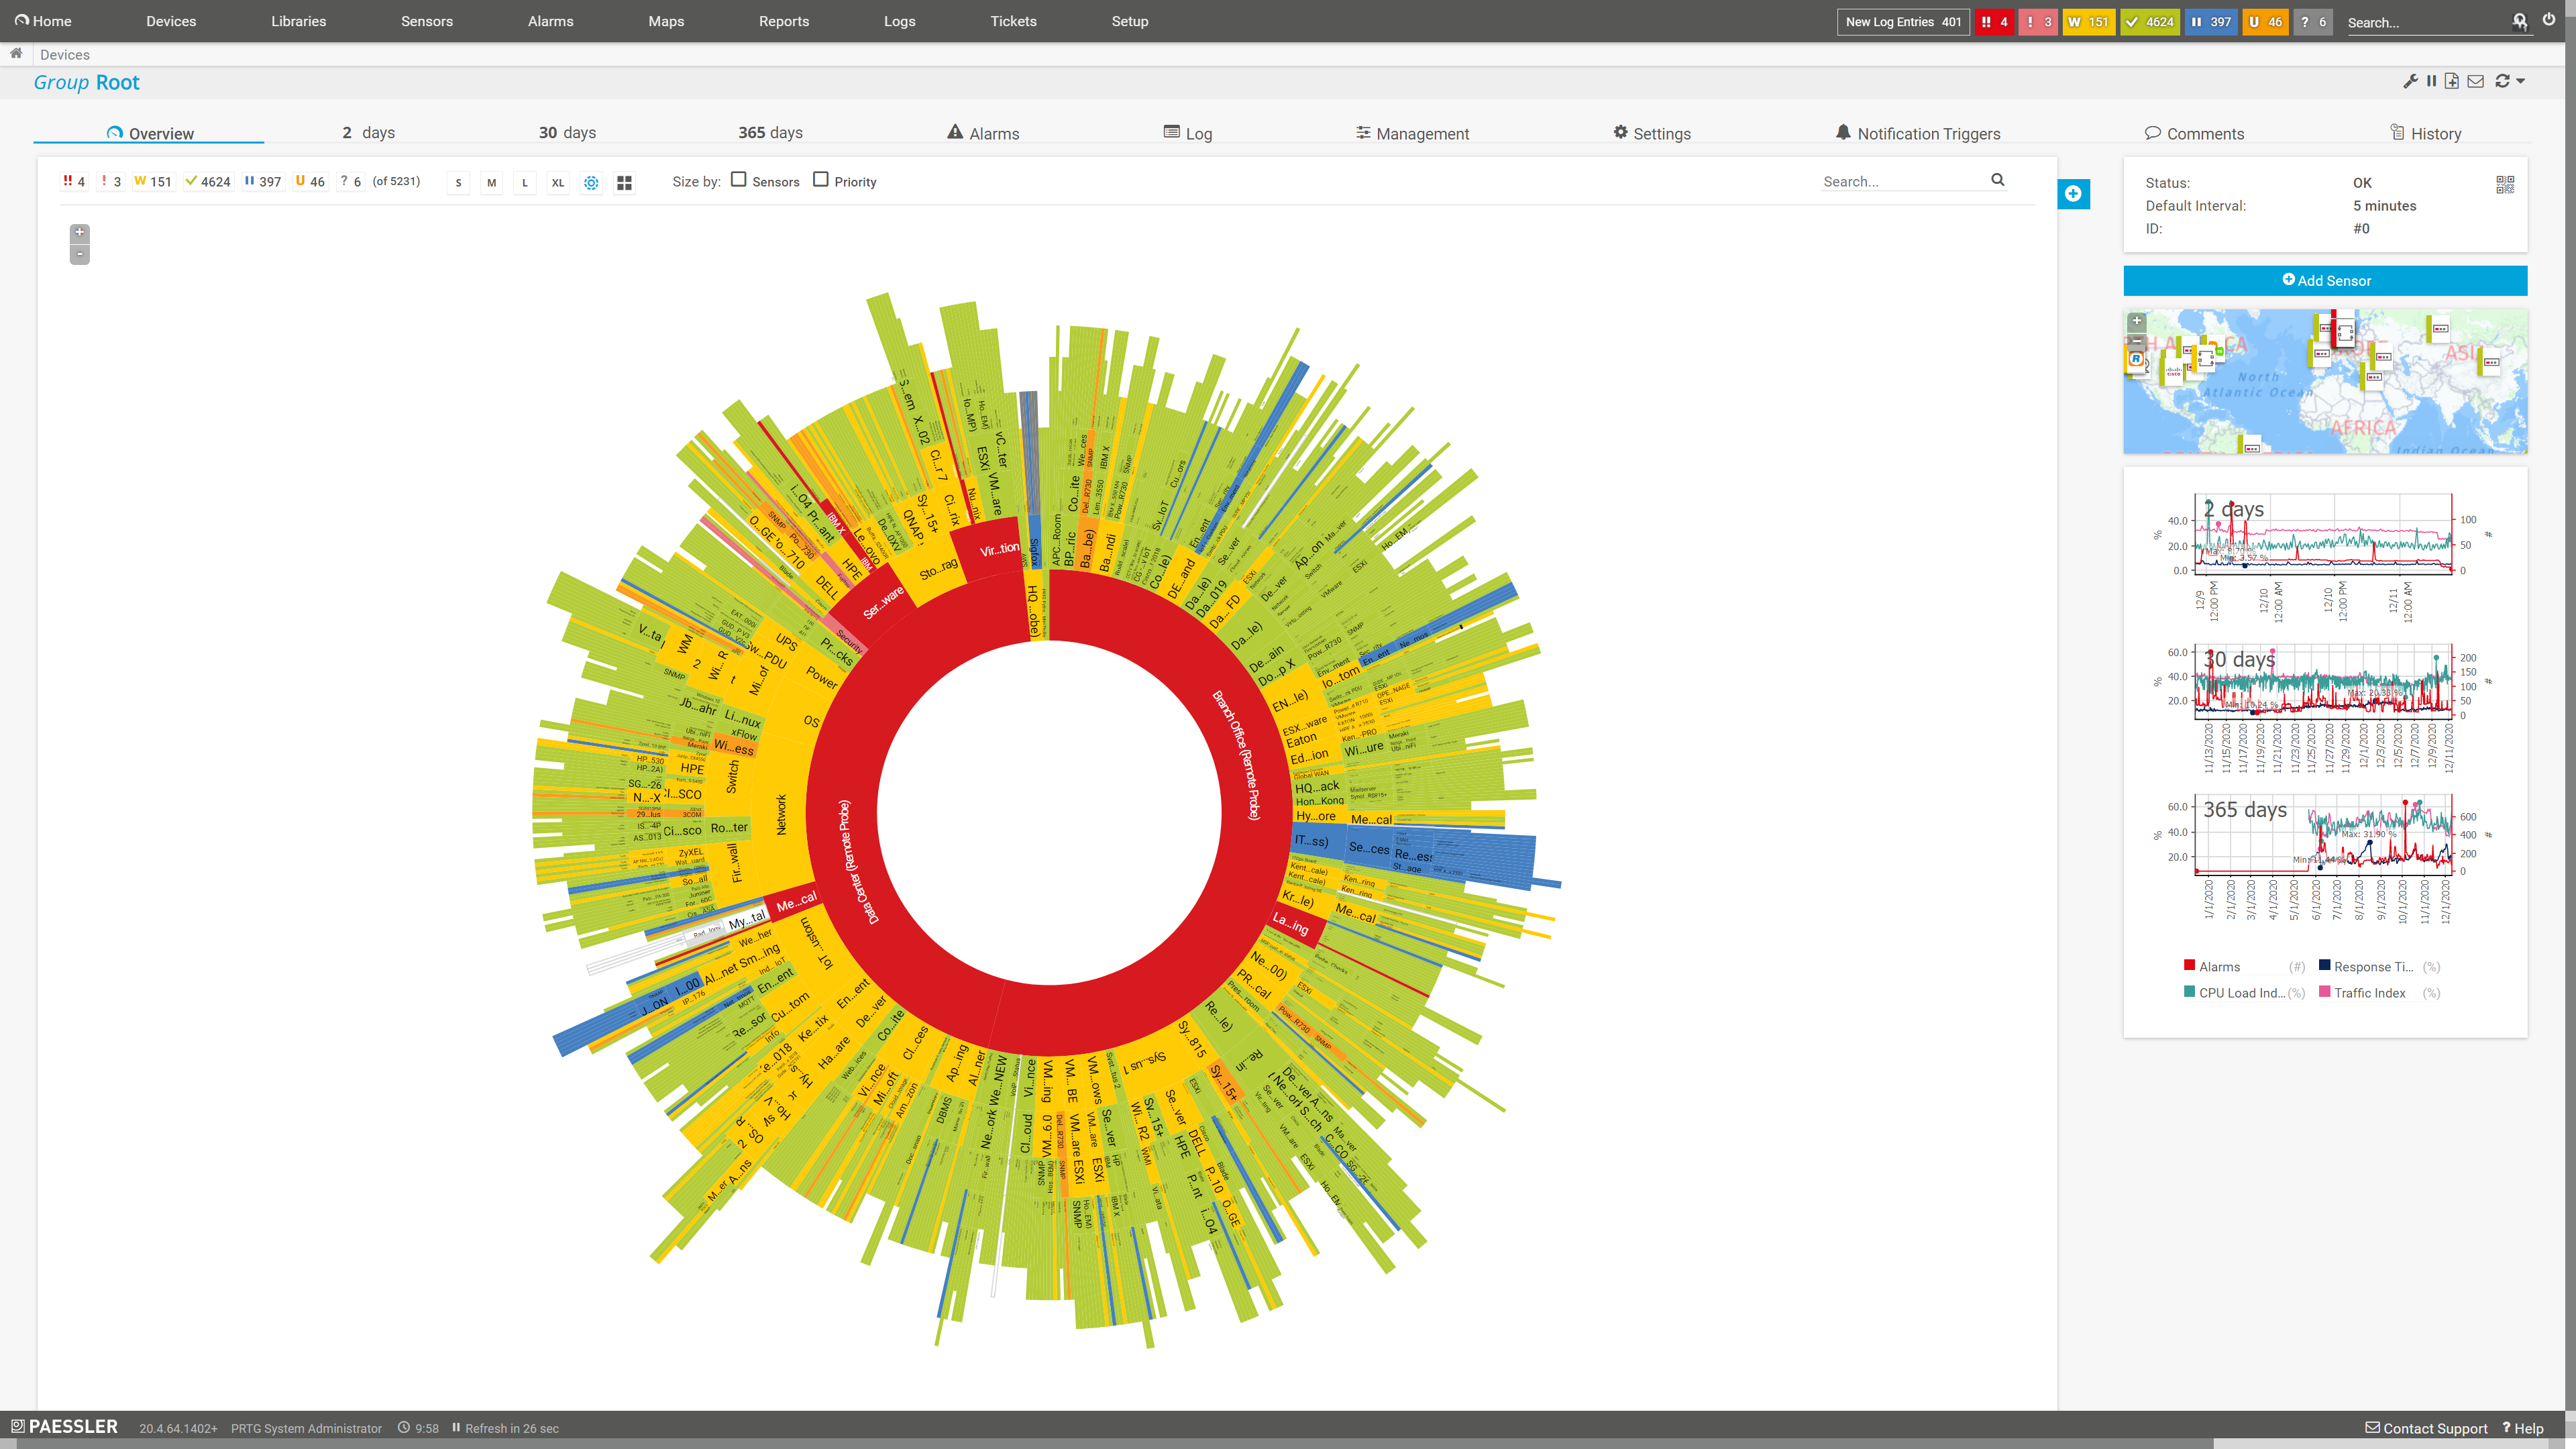
Sunburst view of the entire monitoring setup
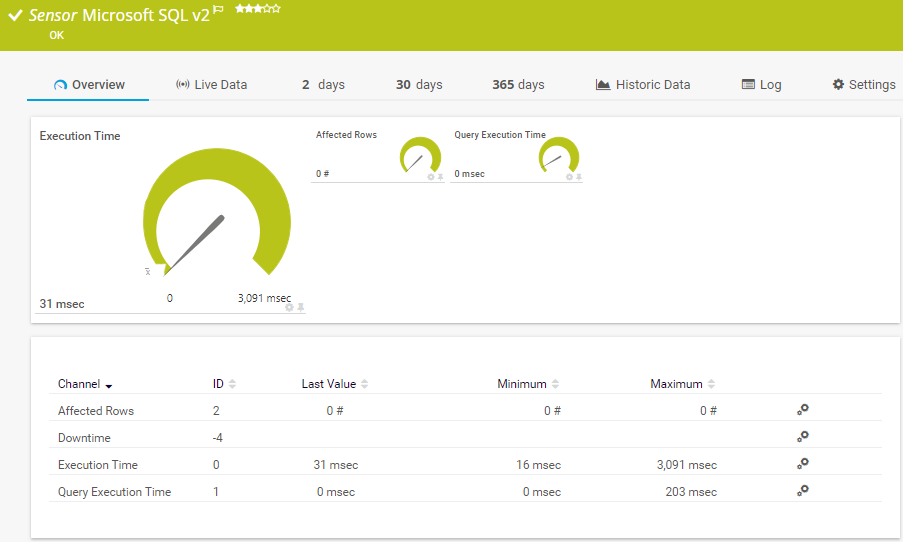
Preconfigured Microsoft SQL v2 sensor in PRTG
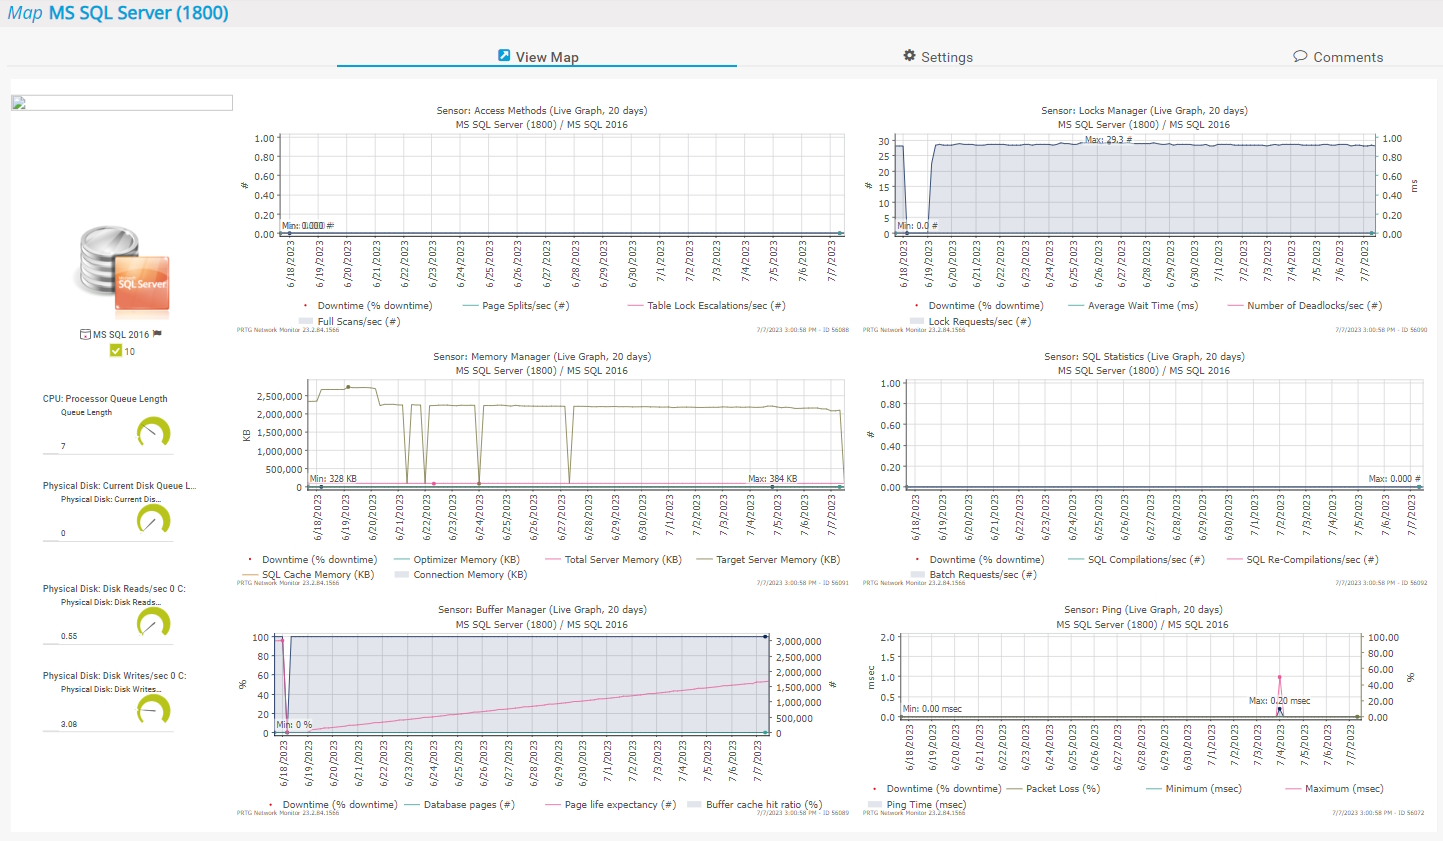
Custom PRTG map for MS SQL monitoring
Start monitoring database server performance with PRTG and see how it can make your network more reliable and your job easier.
IT experts agree: Paessler PRTG is a great solution for IT infrastructure monitoring

“All-around winning
network monitor”

“The real beauty of PRTG is the endless possibilities it offers”

“PRTG Network Monitor
is very hard to beat”
5 reasons why PRTG is your ideal database performance monitoring tool
Easily monitor all of your databases
PRTG offers customizable dashboards that let you see all your databases at a glance. You can quickly check query, connection, and return times to ensure everything is running smoothly.
Get a detailed performance overview
Thanks to custom sensors and individual SQL queries, PRTG can also monitor specific datasets from your databases. For example, you'll be able to see if your online store is slow or if certain datasets are causing problems.
Promptly identify any issues that arise
Poor database performance may be the result of overloaded hardware or bandwidth bottlenecks. PRTG sends you an immediate alert so you can take the necessary action to stop downtime in its tracks. Your coworkers will thank you for it!
Easily integrate with your databases
PRTG comes with a variety of preconfigured sensors for all the biggest database environments, including MySQL, Oracle SQL, Microsoft SQL, and PostgreSQL. For other databases (SAP, IBM), also check PRTG Database Observer.
Scale PRTG with your organization
PRTG is designed to be a flexible, scalable, network monitoring tool. Our database performance monitoring capabilities can expand to encompass your entire IT infrastructure, and is helpful for any size organization.
Your database performance monitor at a glance – even on the go
Set up PRTG in minutes and use it on almost any mobile device.


Find the root cause of the problem with our PRTG database performance monitoring solution
Real-time notifications mean faster troubleshooting so that you can act before more serious issues occur.
PRTG is compatible with all major vendors, products, and systems
![]()
Create innovative solutions with Paessler’s partners
Partnering with innovative vendors, Paessler unleashes synergies to create
new and additional benefits for joined customers.


ScriptRunner
With ScriptRunner, Paessler integrates a powerful event automation platform into PRTG Network Monitor.
“Excellent tool for detailed monitoring. Alarms and notifications work greatly. Equipment addition is straight forward and server initial setup is very easy. ...feel safe to purchase it if you intend to monitor a large networking landscape.”
Infrastructure and Operations Engineer in the Communications Industry, firm size 10B - 30B USD
PRTG makes database performance monitoring as easy as it gets
Custom alerts and data visualization let you quickly identify and prevent performance issues such as slow response times or hardware overloads.

PRTG: The multi-tool for sysadmins
Adapt PRTG individually and dynamically to your needs and rely on a strong API:- HTTP API: Access monitoring data and manipulate monitoring objects via HTTP requests
- Custom sensors: Create your own PRTG sensors for customized monitoring
- Custom notifications: Create your own notifications and send action triggers to external systems
- REST Custom sensor: Monitor almost everything that provides data in XML or JSON format
We asked: would you recommend PRTG?
Over 95% of our customers say yes!
Paessler conducted trials in over 600 IT departments worldwide to tune its network monitoring software closer to the needs of sysadmins.
The result of the survey: over 95% of the participants would recommend PRTG – or already have.

Still not convinced?
![]()
More than 500,000
sysadmins love PRTG
Paessler PRTG is used by companies of all sizes. Sysadmins love PRTG because it makes their job a whole lot easier.
![]()
Monitor your entire IT infrastructure
Bandwidth, servers, virtual environments, websites, VoIP services – PRTG keeps an eye on your entire network.
![]()
Try Paessler PRTG
for free
Everyone has different monitoring needs. That’s why we let you try PRTG for free.
![]()
Start monitoring database performance with PRTG and see how it can make your network more reliable and your job easier.
|
PRTG |
Network Monitoring Software - Version 25.1.104.1961 (April 7th, 2025) |
|
Hosting |
Download for Windows and cloud-based version PRTG Hosted Monitor available |
Languages |
English, German, Spanish, French, Portuguese, Dutch, Russian, Japanese, and Simplified Chinese |
Pricing |
Up to 100 sensors for free (Price List) |
Unified Monitoring |
Network devices, bandwidth, servers, applications, virtual environments, remote systems, IoT, and more |
Supported Vendors & Applications |
|
Discover more monitoring insights and stories

Solutions for all your monitoring needs

