![]()
Downtime monitoring with PRTG
Ensure 99.999% uptime of your network round the clock
- Use real-time alerts to immediately detect devices which are down
- Optimize online services downtime & website availability
- Track performance trends & network downtime with historical data
Our users give top ratings for monitoring with Paessler PRTG


PRTG downtime monitoring: What you’ll find on this page

PRTG makes downtime monitoring as easy as it gets
Custom alerts and data visualization let you quickly identify and prevent all kinds of network downtime issues.
Don’t let your network let you down: How you solve 4 common downtime causes with PRTG
Unscheduled downtime is not only annoying but can also have a negative impact on your business if left unattended. That’s why it’s so important to understand the root cause of an outage. Only then can you develop successful monitoring strategies. Paessler PRTG is your all-in-one network monitoring tool to address different downtime issues.
Locate hardware defects
Every system administrator knows that hardware components like CPUs, RAM, and routers are frequent culprits of downtime.
PRTG provides you with different sensors like the SNMP CPU Load sensor, the SNMP Memory sensor, or the SNMP Hardware Status sensor, so you can quickly identify and fix hardware issues.
Identify cybersecurity threats
Network attacks, for example DDoS, malware, or ransomware, are unfortunately regular events that can cause some serious downtime if you don’t detect them in time.
Deploying the File sensor to check your system files for suspicious changes, the SNMP Traffic sensor to recognize unusual bandwidth activity, or the SSL Certificate sensor to check if your certificates are up to date, help you detect and respond to threats effectively.
Quickly fix storage failures
Full storage disks are not only incredibly annoying and slow down work processes, they can also lead to unexpected infrastructure downtime.
Monitoring storage disks with the WMI Disk Health or WMI HDD Health sensors, or any other dedicated PRTG sensor to monitor downtime gives you the ability to intervene early and prevent capacity issues.
Troubleshoot app errors
We all know that faulty applications, especially critical ones like databases or web servers, can cause significant downtime.
To make sure this doesn’t happen to you, PRTG offers a number of dedicated database, event log, and web server sensors for easy integration. With their help, you can easily prevent issues and maintain best user experience.
What downtime monitoring looks like in PRTG
Diagnose network issues by continuously tracking the downtime of your servers, routers, switches, and other devices. Show hardware failures, network security threats, storage issues, application malfunctions, and other key metrics in real time. Visualize monitoring data in clear graphs and dashboards to identify problems more easily. Gain the visibility you need to troubleshoot and prevent downtime.

Device tree overview of the complete monitoring setup
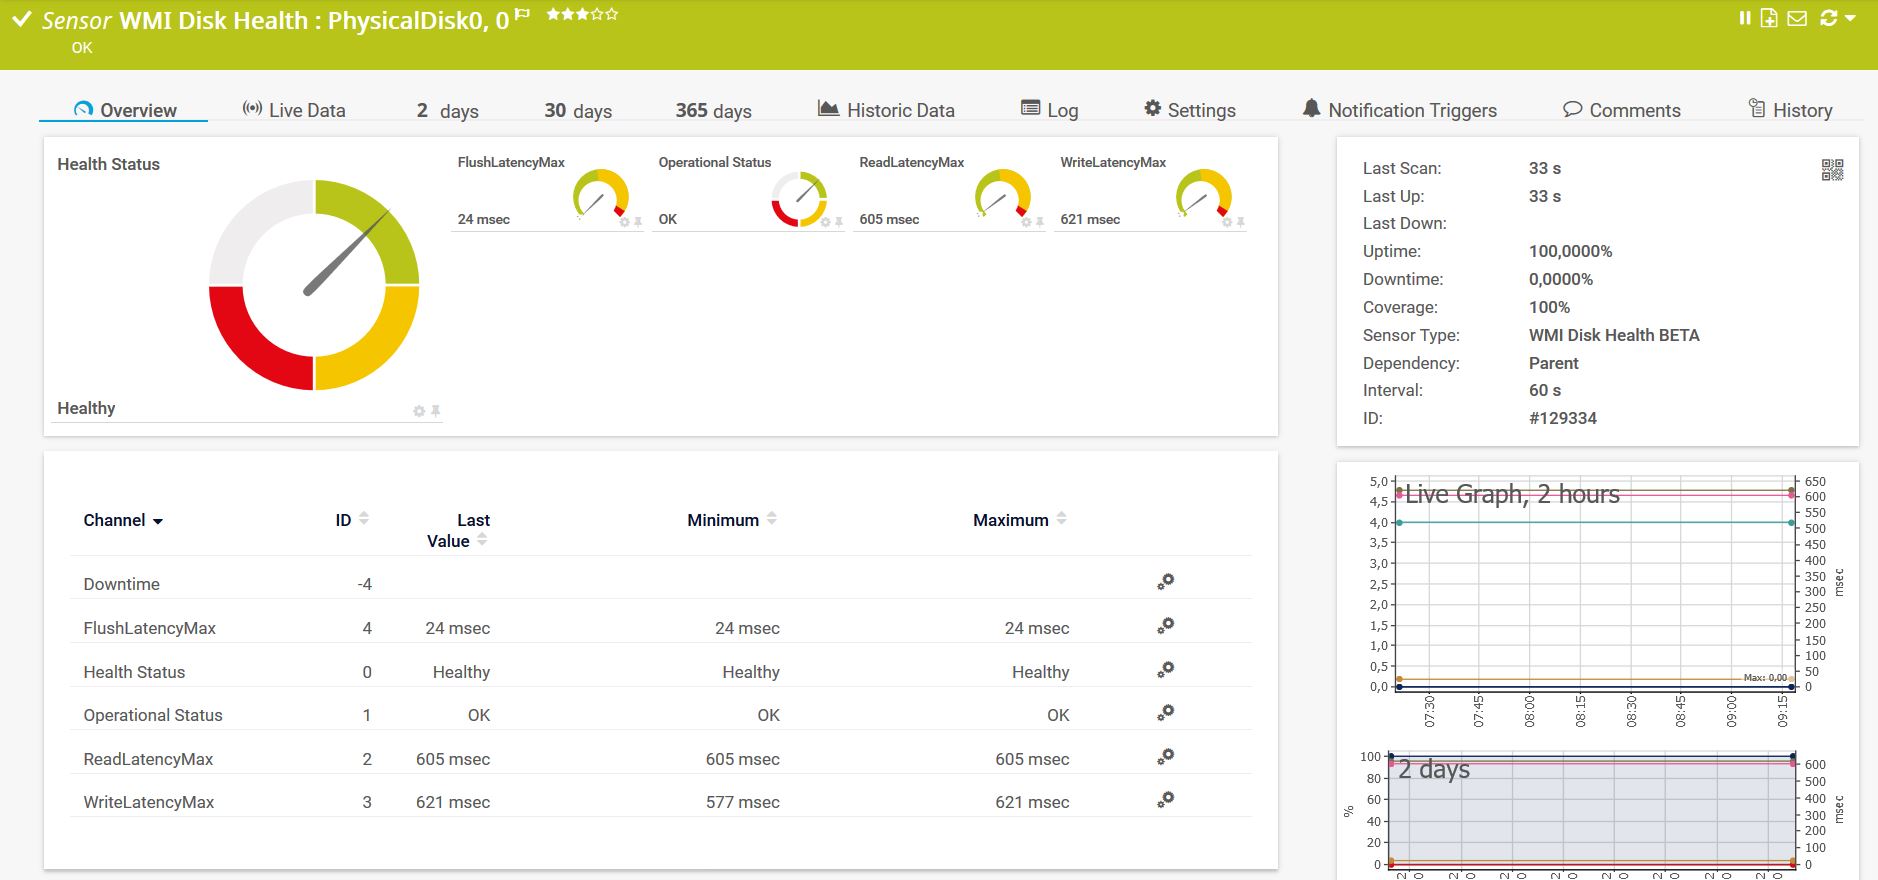
Preconfigured WMI Disk Health sensor in PRTG

Custom PRTG dashboard for keeping an eye on the entire IT infrastructure
Start monitoring downtime with PRTG and see how it can make your network more reliable and your job easier.
IT experts agree: Paessler PRTG is a great solution for IT infrastructure monitoring

“All-around winning
network monitor”

“The real beauty of PRTG is the endless possibilities it offers”

“PRTG Network Monitor
is very hard to beat”
3 reasons why to choose PRTG as your downtime monitoring tool
Troubleshooting will probably always be a part of your daily tasks. But an even more important goal is the prevention of downtime so you can keep your business up and running. Monitoring potential downtime culprits with PRTG gives you the power to proactively improve network performance while simultaneously reducing downtime.
Receive downtime alerts and notifications
PRTG detects network anomalies, application failures, or bandwidth bottlenecks in real time.
Acting as a downtime notification system, your monitoring software immediately alerts you via SMS, email, push notification, Slack message, and more when the thresholds you configure are exceeded and sends notifications to the right teams for a quick resolution.
Customize reporting to fit your needs
Do you need customized reports of your monitoring data for your different stakeholders? With PRTG’s powerful reporting system, you can show updates on your network, device, or service downtimes exactly the way you need them.
Thanks to customizable rules and a powerful API integration for even more customization, all decisions can be based on data.
Take a closer look at your historical data
We all want to make informed decisions when it comes to our work. To make those decisions, you need data, lots and lots of reliable data.
That you don’t need to dig through all the data yourself, PRTG comes with historic data reports for every sensor you deploy – an easy way to increase the performance of your network significantly.
Your downtime monitor at a glance – even on the go
Set up PRTG in minutes and use it on almost any mobile device.


Find the root cause of the problem with our PRTG downtime monitoring solution
Real-time notifications mean faster troubleshooting so that you can act before more serious issues occur.
PRTG is compatible with all major vendors, products, and systems
![]()
PRTG is downtime monitoring software... but also so much more
PRTG is not only a downtime monitor, but also offers a wide range of monitoring features for you to improve your overall network management, such as server monitoring, website monitoring, or network traffic analysis. The convenient auto-discovery feature, which takes care of the setup of your monitoring environment after the quick and easy installation, is just one of many helpful functionalities.
Use detailed monitoring dashboards
The best dashboards are those that show you important data immediately. But setting up your own dashboards in a new monitoring environment is often time-consuming.
To save you valuable time, PRTG provides a drag-and-drop map editor for creating network maps and dashboards with detailed overviews of your network’s health in no time.
Streamline combined IT/OT operations
Tired of using one software for OT monitoring and another for IT infrastructure monitoring? With PRTG, your monitoring operations are ready for the future.
With IT and OT network monitoring in one application, you not only save time and resources. You can also check the status of all your devices from a single pane of glass.
Keep an eye on your bandwidth
PRTG excels at bandwidth monitoring thanks to its numerous sensors that track all aspects of bandwidth usage.
Whether you want to know how good the connection to your remote data centers is or how fast you can access the cloud, you will always have the latest data sets at your fingertips to manage your network traffic effectively.
Create innovative solutions with Paessler’s partners
Partnering with innovative vendors, Paessler unleashes synergies to create
new and additional benefits for joined customers.


ScriptRunner
With ScriptRunner, Paessler integrates a powerful event automation platform into PRTG Network Monitor.
“Excellent tool for detailed monitoring. Alarms and notifications work greatly. Equipment addition is straight forward and server initial setup is very easy. ...feel safe to purchase it if you intend to monitor a large networking landscape.”
Infrastructure and Operations Engineer in the Communications Industry, firm size 10B - 30B USD
PRTG makes downtime monitoring as easy as it gets
Custom alerts and data visualization let you quickly identify and prevent all kinds of network downtime issues.

PRTG: The multi-tool for sysadmins
Adapt PRTG individually and dynamically to your needs and rely on a strong API:- HTTP API: Access monitoring data and manipulate monitoring objects via HTTP requests
- Custom sensors: Create your own PRTG sensors for customized monitoring
- Custom notifications: Create your own notifications and send action triggers to external systems
- REST Custom sensor: Monitor almost everything that provides data in XML or JSON format
More than just a monitoring tool:
Reasons our customers love PRTG


Still not convinced?
![]()
More than 500,000
sysadmins love PRTG
Paessler PRTG is used by companies of all sizes. Sysadmins love PRTG because it makes their job a whole lot easier.
![]()
Monitor your entire IT infrastructure
Bandwidth, servers, virtual environments, websites, VoIP services – PRTG keeps an eye on your entire network.
![]()
Try Paessler PRTG
for free
Everyone has different monitoring needs. That’s why we let you try PRTG for free.
![]()
Start monitoring downtime with PRTG and see how it can make your network more reliable and your job easier.
|
PRTG |
Network Monitoring Software - Version 25.1.102.1373 (January 9th, 2025) |
|
Hosting |
Download for Windows and cloud-based version PRTG Hosted Monitor available |
Languages |
English, German, Spanish, French, Portuguese, Dutch, Russian, Japanese, and Simplified Chinese |
Pricing |
Up to 100 sensors for free (Price List) |
Unified Monitoring |
Network devices, bandwidth, servers, applications, virtual environments, remote systems, IoT, and more |
Supported Vendors & Applications |
|
Discover more monitoring insights and stories

Solutions for all your monitoring needs

Powerful stories from the monitoring world

Combining the broad monitoring feature set of PRTG with IP Fabric’s automated network assurance creates a new level of network visibility and reliability.