Paessler PRTG

Free network mapping software that also monitors performance

  • Maps all properties & devices at once
  • Creates interactive maps of your network
  • Alerts you before problems occur
 

Our users give top ratings for monitoring with Paessler PRTG


PRTG network mapping features


Mapping and monitoring in one solution: the PRTG advantage

Compare Paessler PRTG to other tools.

network-scanner

PRTG vs. pure network scanners and network mapping tools

Unlike PRTG, pure network scanners and mapping tools require significant time-consuming, manual work to provide valuable maps of complex networks. Although they detect the network with all its components and deliver results in the form of a list, this information must be manually applied to create dynamic network charts and maps.

Moreover, you can build only static network diagrams that function as a pure network overview. Network topology mappers like PRTG, on the other hand, let you display a live diagram of your physical network elements.


speed

PRTG vs. other network monitoring software

Other network monitoring tools with the mapping option fall short of the optimized troubleshooting and network planning functionality of PRTG. Many do deliver information on the availability and condition of detected components, as well as network traffic and performance.

They also promise further assistance with an auto-mapping functionality that displays network devices identified through a network scan (such as switches, routers, firewalls, servers, or applications) in automatically generated network maps. However, the outcome of such auto-generated maps is often not very satisfactory at all.


speed

PRTG vs. auto-mapping tools

The automatically generated maps of auto-mapping solutions often fall short in terms of readability and usability – compared to the structured, easy-to-use network maps in PRTG. They scan the network and integrate the identified devices directly in network diagrams and maps.

However, many devices and connections are displayed one-dimensionally on oversized maps. This might be acceptable as a one-off inventory, but such network diagrams are usually not very helpful for daily troubleshooting and network planning activities.

Integrated network mapping solutions like PRTG are clearly superior to the combination of network scanners and mapping tools when it comes to usability and delivering data on the actual status of devices.


PRTG is compatible with all major vendors & manufacturers

vendors applications blue


Map and monitor your network for free and see how PRTG can make your IT infrastructure more reliable and your job easier.


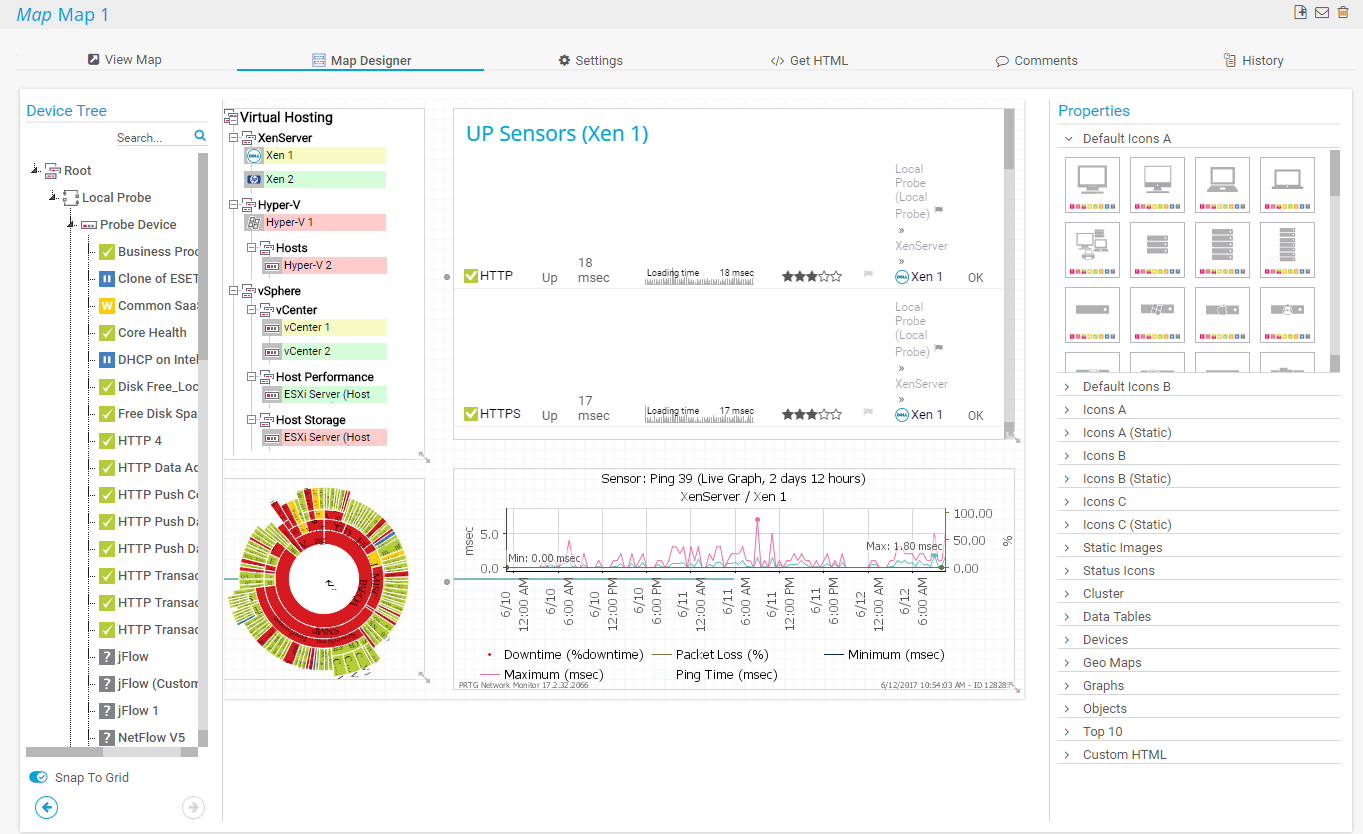
Drag & drop map editor with integrated monitoring

After the automatic network discovery detects all IT components – switches, routers, firewalls, servers and applications, storage systems and virtual servers – you can quickly integrate everything into structured network maps.

It's easy! Just use the built-in drag & drop map editor which comes with a large number of device and status icons, symbols, images, and much more out-of-the-box. Or use custom HTML to generate multi-layer maps so that you can drill down through multiple layers to quickly identify the root cause of an issue.

Easily integrate automated layer-2 maps or maps with a large number of devices by using an external tool or a network topology mapper. See our overview of network mapping tools.


Trusted by 500,000 users and recognized by industry analysts as a leader


logo

“Save two weeks working
weeks per year”

logo

“All-around winning
network monitor”

logo it brief

“The real beauty of PRTG is the endless possibilities it offers”

logo

“Outstanding cloud
monitoring”


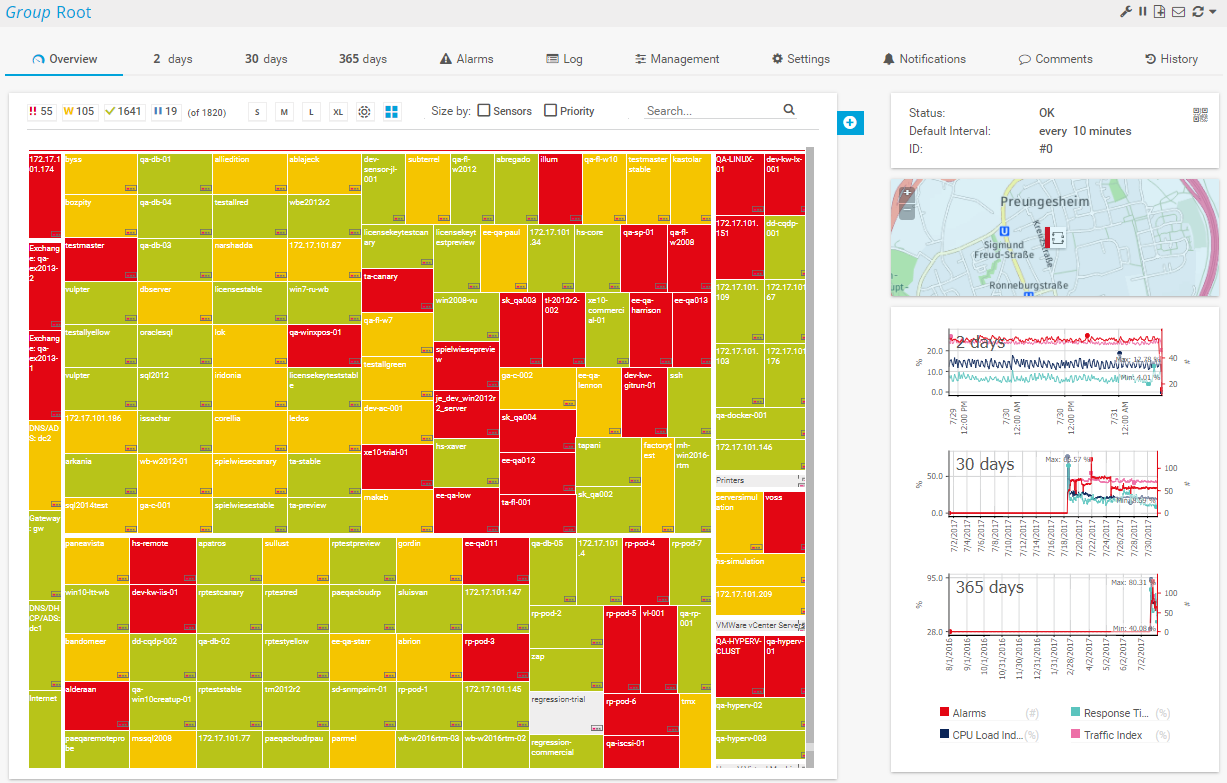
The Sunburst view: your network status at a glance

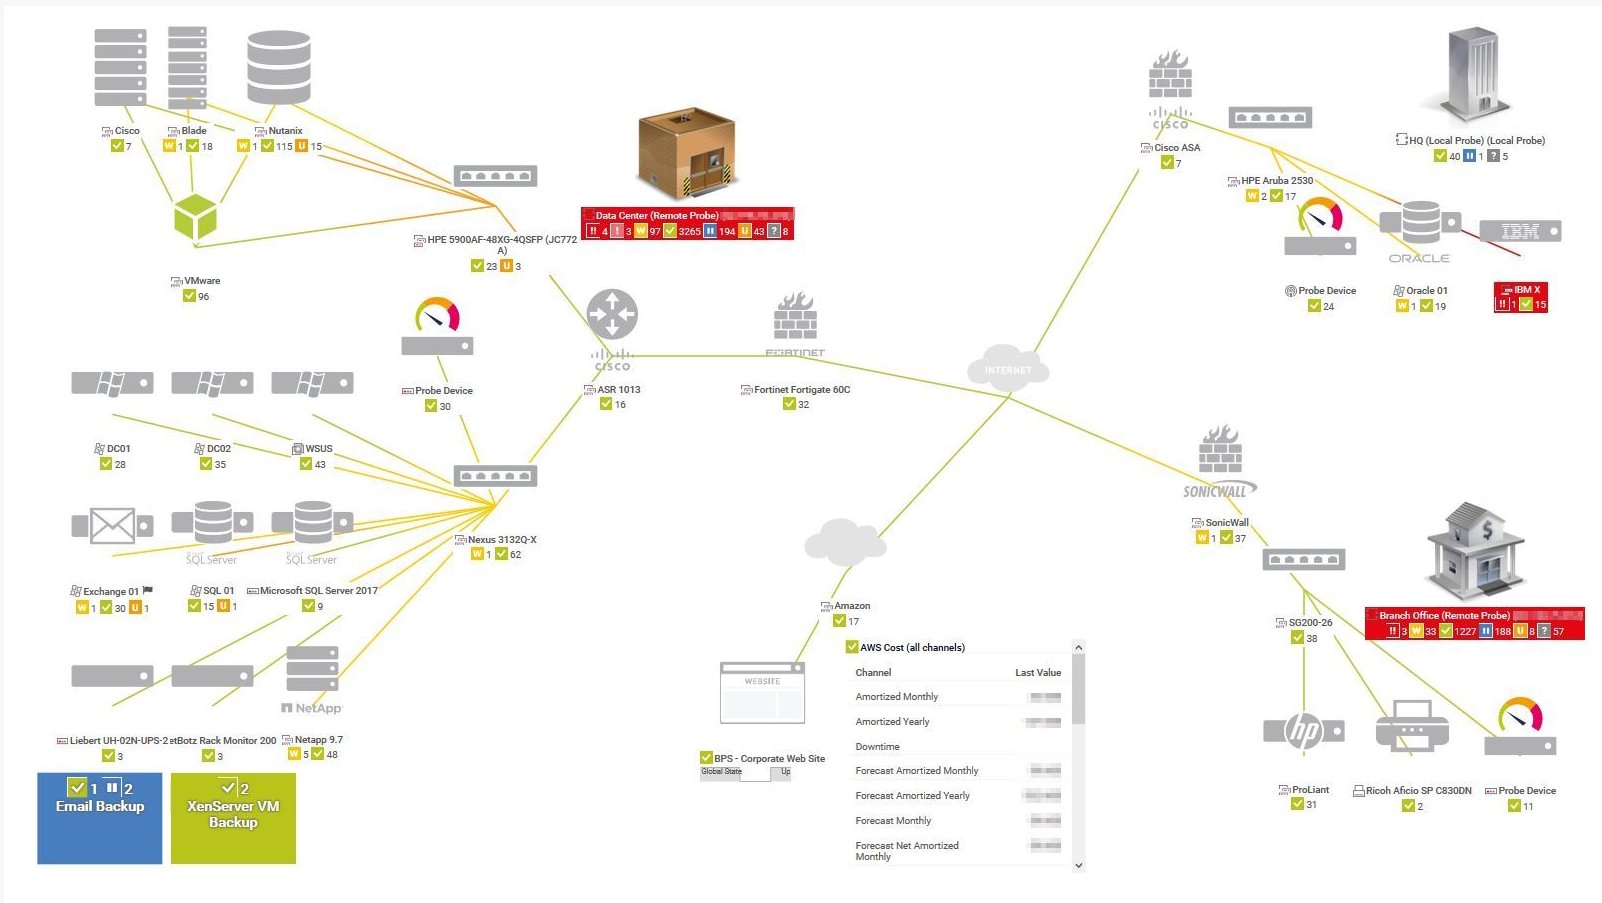
In addition to easy-to-read maps that you can easily create from scratch, PRTG offers monitoring capabilities which you won't find in other, pure network scanning and mapping tools. PRTG maps and dashboards not only show devices and their physical and logical connections, but also deliver actionable information on their status.

Clear color coding enables you to quickly see your network's status at one glance. What's more: all map items are interactive and clickable for faster troubleshooting. You can even add custom background images such as a floor plan to show each device’s location.

A great visibility option: the PRTG Sunburst view shows you your entire network and its current status in almost real-time.


Map and monitor your network for free and see how PRTG can make your IT infrastructure more reliable and your job easier.


Network diagrams: customize for any audience

The PRTG map editor makes it easy to create high-level status dashboards for the management or detailed dashboards with more in-depth information for your colleagues.

For example, create a custom-tailored map for the system administrator that shows all network devices, their status, and their exact location in the building. Or create a map for the IT manager that shows the status of your entire network at one glance in a kind of bird's-eye view – to also support your reporting visually.

The flexible, easy-to use map editor of PRTG makes everyone's job easier.


Network mapping with unified monitoring

The PRTG network mapping solution is also a powerful, all-in-one monitoring tool.

Over 500,000 administrators worldwide use PRTG to monitor their server performance, LAN, virtual environments, the accessibility of their websites, and more. PRTG is the best network analysis solution and performance monitoring tool for Windows and supports all important protocols like SNMP, NetFlow, WMI, or Packet Sniffing.

Even the free trial edition of PRTG includes all network scanning and mapping features.


Shareable dashboards: grant private or public access

Each created dashboard has a unique URL that you can use for internal or external access.

Publish the dashboard internally for colleagues or the management team, or to show it on network operation center screens.

You can also make the dashboard publicly available using a public URL, or integrate it directly into other web pages via iFrame.


Map and monitor your IT infrastructure for free and see how PRTG can make your network more reliable and your job easier.


Create innovative solutions with Paessler’s partners

Partnering with innovative vendors, Paessler unleashes synergies to create
new and additional benefits for joined customers.

Martello

By integrating PRTG with Martello iQ, you can add a fast analytics layer to improve uptime, visualize your IT environment, and integrate all of your IT systems into a single pane of glass.

Read more

Plixer

Paessler and Plixer provide a complete solution adding flow and metadata analysis to a powerful network monitoring tool.

Read more

Siemon

Siemon and Paessler bring together intelligent building technology and advanced monitoring and make your vision of intelligent buildings and data centers become reality.

Read more


quote andreas reimann

“The support we received from Paessler was extremely reassuring. Their reaction time, know-how, and solutions were outstanding in every department.”

Andreas Reimann, Senior Networking Communication Architect at Zürich Airport. Zürich Airport uses more than 4,500 sensors for its monitoring


We'll make you a monitoring expert

Gain practical knowledge on how to monitor your infrastructure with Paessler PRTG. Our training sessions are planned and provided by Paessler system engineers and are suitable for different experience levels.


Book a spot


Still not convinced?


love

More than 500,000 sysadmins love PRTG

Paessler PRTG is used by companies of all sizes. Sysadmins love PRTG because it makes their job a whole lot easier.

speed

Monitor your entire IT infrastructure

Bandwidth, servers, virtual environments, websites, VoIP services – PRTG keeps an eye on your entire network.

trial

Try Paessler PRTG
 for free

Everyone has different monitoring needs. That’s why we let you try PRTG for free.


PRTG

Network Monitoring Software - Version 24.4.102.1351 (November 12th, 2024)

Hosting

Download for Windows and cloud-based version PRTG Hosted Monitor available

Languages

English, German, Spanish, French, Portuguese, Dutch, Russian, Japanese, and Simplified Chinese

Pricing

Up to 100 sensors for free (Price List)

Unified Monitoring

Network devices, bandwidth, servers, applications, virtual environments, remote systems, IoT, and more

Supported Vendors & Applications

More
cisco logo grey 40 dell logo grey 40 hp logo grey 40 ibm grey40 netapp grey40 linux grey40 aws grey40 windows grey40 vmware grey40 citrix grey40 exchange grey40 apache grey40 oracle grey40


Paessler PRTG 

Map and monitor your IT infrastructure for free and see how PRTG can make your network more reliable and your job easier. 


FAQs about network mapping


1. What is network mapping?

Network mapping is the process of visually representing a network's physical and logical connections. It allows network administrators to see how devices and systems interact and helps in organizing and analyzing network data and optimizing the network infrastructure.

2. What is a sensor in PRTG?

In PRTG, “sensors” are the basic monitoring elements. One sensor usually monitors one measured value in your network, for example the traffic of a switch port, the CPU load of a server, or the free space on a disk drive. On average, you need about 5-10 sensors per device or one sensor per switch port.

3. How does network mapping help with network management?

Network mapping enhances network management by providing a visual representation of the network's structure, which helps in identifying and resolving network issues quickly. It improves monitoring and troubleshooting by allowing administrators to identify problems, understand data flow and thus optimize the overall network performance.


4. What are the benefits of combining network mapping and network monitoring?

Using both network mapping and network monitoring helps admins visualize network dependencies and track important performance metrics, leading to more efficient troubleshooting and minimized downtime. This synergy ensures a comprehensive view of the network and enables a proactive management and quicker resolution of issues.