Custom alerts and data visualization let you quickly identify and prevent VPN connection and security issues.
Diagnose network issues by continuously tracking your virtual private network. Show incoming and outgoing traffic by IP address, bandwidth, data packet speed, packet loss, latency, the number of active VPN sessions and remote workers, and other key network performance metrics in real time. Visualize monitoring data in clear graphs and dashboards to identify problems more easily. Gain the overview you need to troubleshoot VPN connection errors, suspicious user activity, bad routing, and other performance issues.

Live traffic data graph in PRTG
IT Infrastructure Overview

Device tree view of the complete monitoring setup

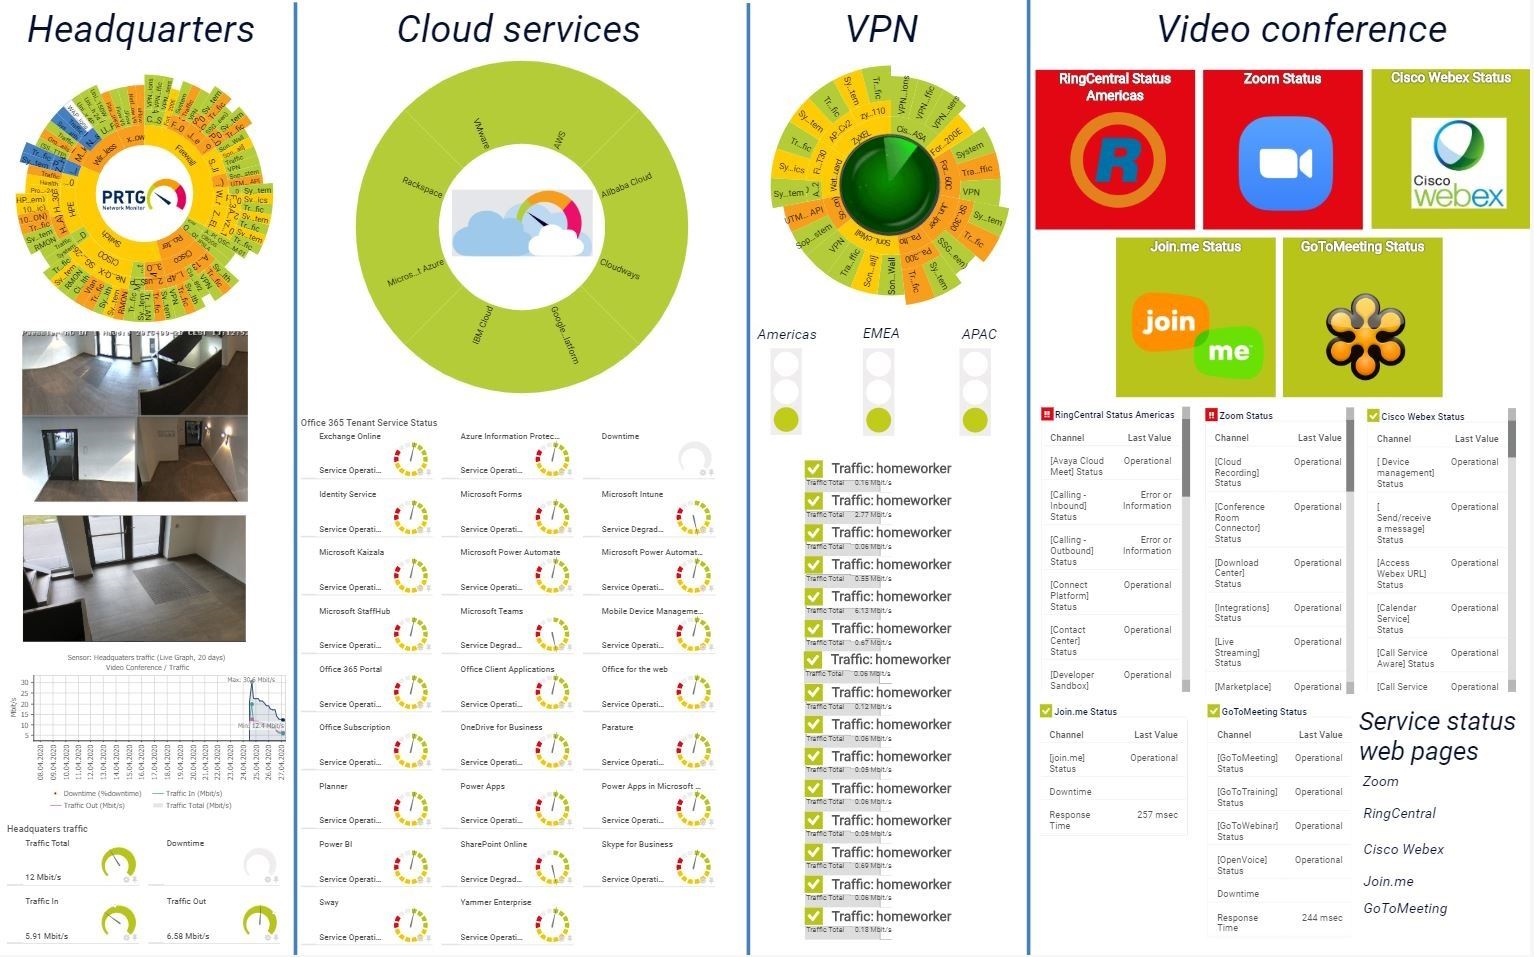
Custom PRTG dashboard for keeping an eye on the entire IT infrastructure
Live traffic data graph in PRTG
IT Infrastructure Overview
“All-around winning
network monitor”
“The real beauty of PRTG is the endless possibilities it offers”
“PRTG Network Monitor
is very hard to beat”
PRTG comes with more than 250 native sensor types for monitoring your entire on-premises, cloud, and hybrid cloud environment out of the box. Check out some examples below!
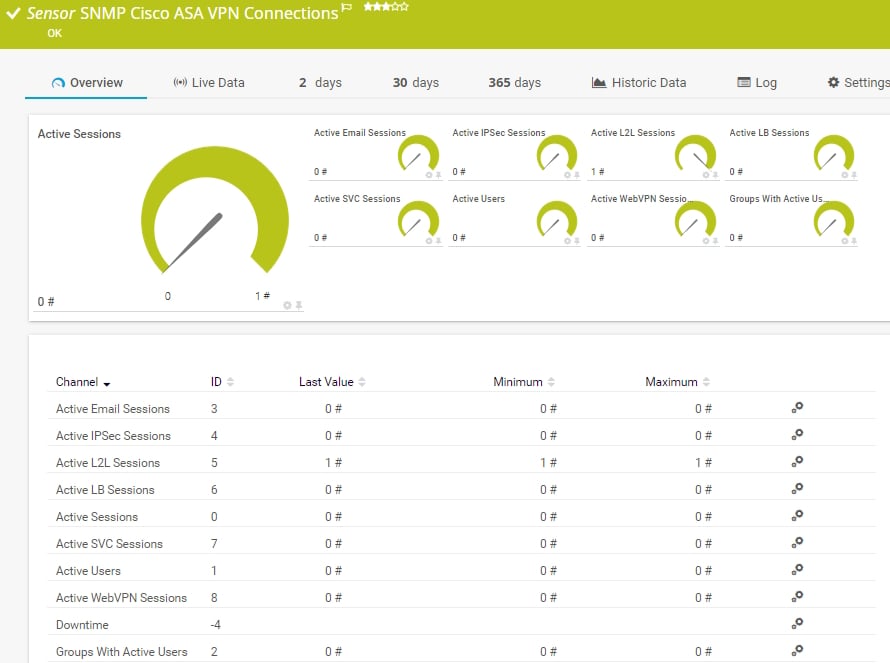
The SNMP Cisco ASA VPN Connections sensor monitors the VPN connections on a Cisco Adaptive Security Appliance. It can show the following:
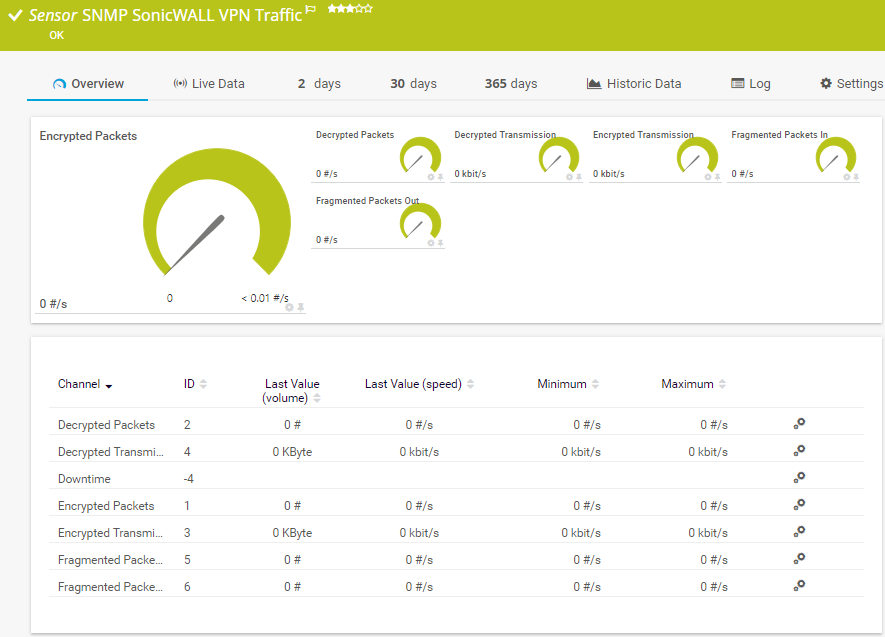
The SNMP SonicWall VPN Traffic sensor monitors the traffic of an Internet Protocol Security (IPsec) VPN on a SonicWall Network Security Appliance (NSA) . It can show the following:
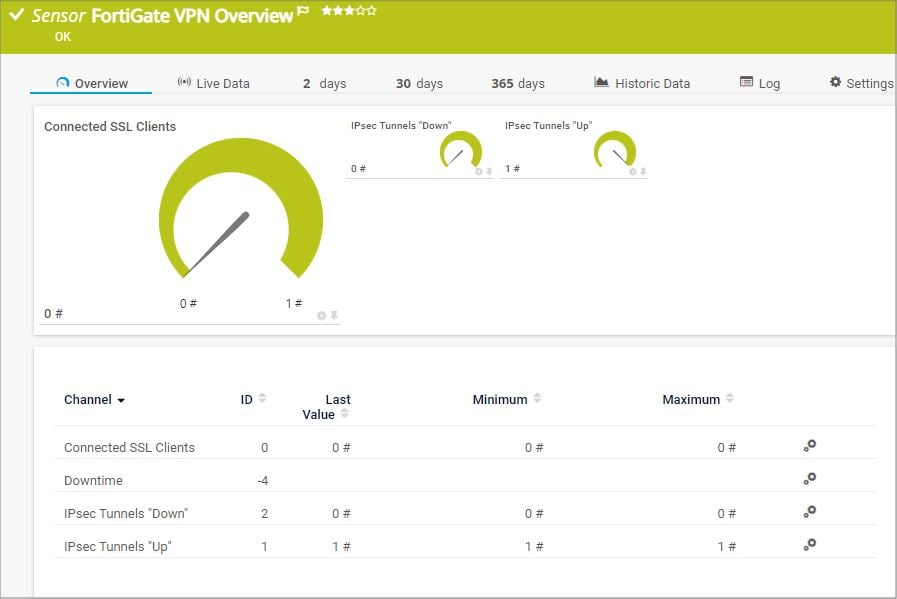
The FortiGate VPN Overview sensor monitors the virtual private network (VPN) connections of a Fortinet FortiGate system. It can show the following:
See the PRTG Manual for a list of all available sensor types.

Real-time notifications mean faster troubleshooting so that you can act before more serious issues occur.
Set up PRTG in minutes and use it on almost any mobile device.

Partnering with innovative IT vendors, Paessler unleashes synergies to create
new and additional benefits for joined customers.

Combining PRTG’s broad monitoring feature set with IP Fabric’s automated network assurance creates a new level of network visibility and reliability.

Rhebo and PRTG offer a comprehensive monitoring solution for IT and OT environments: from condition monitoring through to anomaly and threat detection.

With the combination of PRTG and Insys, the monitoring specialist Paessler and the industrial gateway manufacturer INSYS icom offer a practical possibility to merge IT and OT.
Custom alerts and data visualization let you quickly identify and prevent VPN connection and security issues.
Network Monitoring Software – Version 24.4.102.1351 (November 12th, 2024)
Download for Windows and cloud-based version PRTG Hosted Monitor available
English, German, Spanish, French, Portuguese, Dutch, Russian, Japanese, and Simplified Chinese
Network devices, bandwidth, servers, applications, virtual environments, remote systems, IoT, and more
Choose the PRTG Network Monitor subscription that's best for you


VPN stands for “virtual private network”. It is a method by which two endpoints create a single, private connection, or VPN tunnel, while using a larger network infrastructure such as the Internet or a WAN. When established, a VPN acts like a direct connection to a private network.
With VPNs, employees who do not work within the company network (such as those working remote) are able to securely access company applications and collective resources. Branch offices can also connect, and mobile workers are able to effectively work with clients.
With the encrypted transportation of sensitive company data come strict requirements regarding security and connection stability. To meet these requirements, PRTG offers VPN network monitoring.
To make a VPN partner’s connection to a company network secure, VPNs use remote access secured via SSL/TLS with the Internet as a path. This path ends at a VPN gateway, or the dial-in node of the company network. Beyond this point, the VPN partner acts as a regular network client, accessing applications and data and using collaborative tools like all other clients.
Along with VPNs for connecting branches to the network (end-to-site VPN), there are also VPNs for connecting two networks (site-to-site VPN) and for the direct connection between VPN partners (end-to-end VPN). VPN monitoring tools like PRTG check virtual networks for availability, VPN connection types, load, and errors, as well as connected user accounts and transferred data volumes and packets.
PRTG is not only VPN monitoring software – with our all-in-one network monitoring tool, you can keep an eye on your entire IT infrastructure, including:
In PRTG, “sensors” are the basic monitoring elements. One sensor usually monitors one measured value in your network, for example the traffic of a switch port, the CPU load of a server, or the free space on a disk drive. On average, you need about 5-10 sensors per device or one sensor per switch port.
Paessler conducted trials in over 600 IT departments worldwide to tune its network monitoring software closer to the needs of sysadmins. The result of the survey: over 95% of the participants would recommend PRTG – or already have.

Paessler PRTG is used by companies of all sizes. Sysadmins love PRTG because it makes their job a whole lot easier.
Bandwidth, servers, virtual environments, websites, VoIP services – PRTG keeps an eye on your entire network.
Everyone has different monitoring needs. That’s why we let you try PRTG for free.