Custom alerts and data visualization let you quickly identify and prevent poor availability, suspicious activity, and other security and performance issues.
Are your Apache web servers running properly? Is your organization’s website or online store available and accessible? Are your internal and external communications reliable?
If you don’t monitor all the Apache modules running on your network, there’s no way you’ll be able to answer these questions. Given how important Apache web servers are to your organization’s continued success – almost 25% of the world’s web-facing computers run on them – can you afford to remain in the dark?
PRTG’s preconfigured Apache sensors keep a close eye on access logs, configuration files, latency, CPU usage, and other key Apache metrics in real time. They even track the number of idle workers, the number of busy workers , and the number of requests.
More to the point, they monitor your chosen performance metrics round the clock, 365 days a year. Which means performance or security issues will never fall through the cracks.

Set up your monitoring environment in minutes and keep a close eye on Apache web services, without constant manual intervention. PRTG monitors critical metrics in real time, alerts you if there's a risk performance thresholds will get breached, and aggregates your data in custom dashboards for one-click reporting.
It's not how many resources you have at your disposal. It's how you use them that will make a difference. PRTG builds a complete picture of your network's footprint and highlights bottlenecks and other issues, so you can maximize performance without throwing more money at the problem.
Don't let potential problems go unnoticed. PRTG's built-in alarm system emails, texts, or sends you an in-app notification based on custom thresholds before a performance issue goes critical. Which means you can fix it before it disrupts your organization, impacts your customers’ user experience, or, worse, causes a blue screen of death.
Safeguard your organization's (and customers') sensitive data. Alongside performance, PRTG monitors your entire network's security – application performance, firewalls, config and log files, gateways, APIs, and more – enabling you to proactively close security loopholes and prevent malicious login attempts.
Diagnose network issues by continuously tracking the availability and performance of Apache web servers and other HTTP web services. Show response times, uptime, CPU load, bandwidth utilization, and other key metrics in real time. Visualize monitoring data in clear graphs and dashboards to identify problems more easily. Gain the overview you need to troubleshoot bandwidth bottlenecks, slow connectivity, and other network issues.

Live traffic data graph in PRTG
Map Web Server with PRTG

Device tree view of the complete monitoring setup

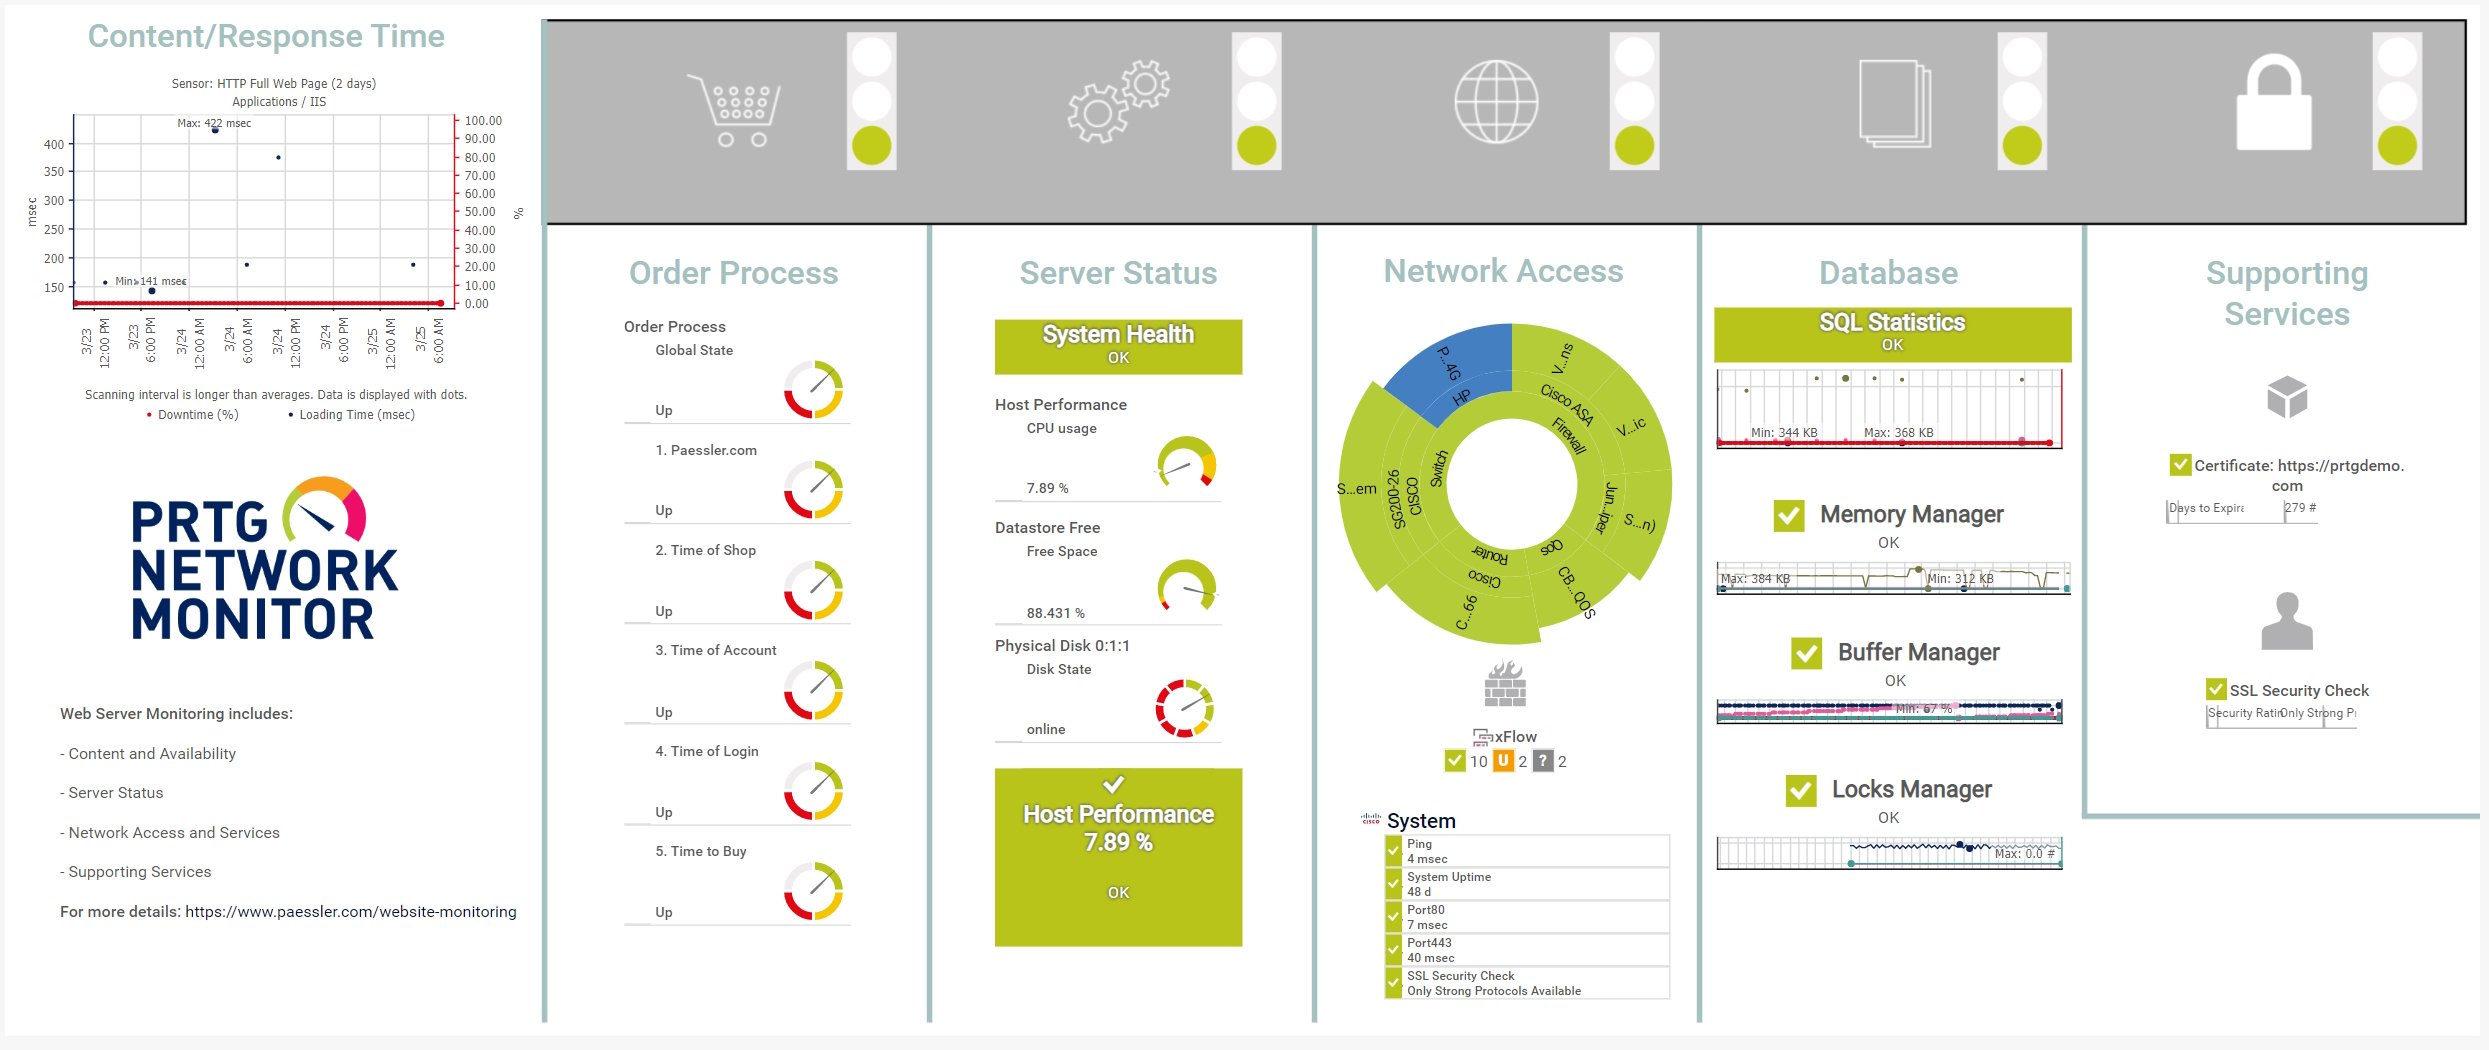
Custom PRTG dashboard for keeping an eye on the entire IT infrastructure
Live traffic data graph in PRTG
Map Web Server with PRTG
“All-around winning
network monitor”
“The real beauty of PRTG is the endless possibilities it offers”
“PRTG Network Monitor
is very hard to beat”
PRTG comes with more than 250 native sensor types for monitoring your entire on-premises, cloud, and hybrid cloud environment out of the box. Check out some examples below!
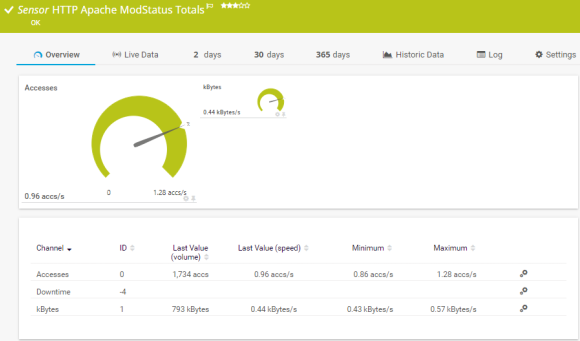
The HTTP Apache ModStatus Totals sensor monitors the activity of an Apache web server using mod_status over HTTP. It can show the following:
The HTTP Apache ModStatus Totals sensor monitors the activity of an Apache web server using mod_status over HTTP. It can show the following:
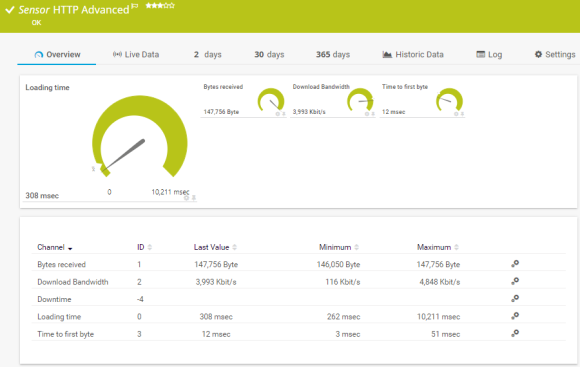
The HTTP Advanced sensor monitors the source code of a web page using HTTP. It supports authentication, content checks, and other advanced parameters. It can show the following:
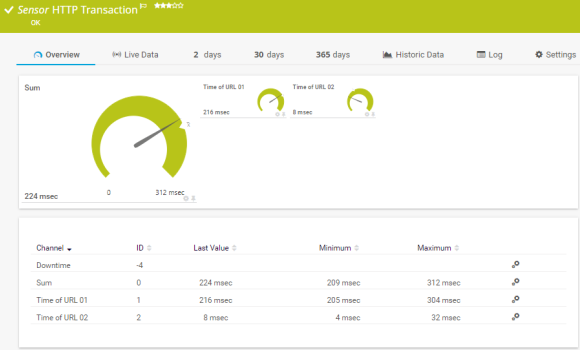
The HTTP Transaction sensor monitors an interactive website, such as a web shop, by performing a transaction using a set of HTTP URLs. The sensor monitors whether logins or shopping carts work properly. It can show the following:
See the PRTG Manual for a list of all available sensor types.

Custom alerts and data visualization let you quickly identify and prevent XXX.
PRTG is set up in a matter of minutes and can be used on a wide variety of mobile devices.

Partnering with innovative IT vendors, Paessler unleashes synergies to create
new and additional benefits for joined customers.

baramundi and PRTG create a secure, reliable and powerful IT infrastructure where you have everything under control - from the traffic in your firewall to the configuration of your clients.

With the combination of PRTG and Insys, the monitoring specialist Paessler and the industrial gateway manufacturer INSYS icom offer a practical possibility to merge IT and OT.

Siemon and Paessler bring together intelligent building technology and advanced monitoring and make your vision of intelligent buildings and data centers become reality.
Real-time notifications mean faster troubleshooting so that you can act before more serious issues occur.
Network Monitoring Software – Version 24.4.102.1351 (November 12th, 2024)
Download for Windows and cloud-based version PRTG Hosted Monitor available
English, German, Spanish, French, Portuguese, Dutch, Russian, Japanese, and Simplified Chinese
Network devices, bandwidth, servers, applications, virtual environments, remote systems, IoT, and more
Choose the PRTG Network Monitor subscription that's best for you


Apache HTTP servers are the most widely used open-source web servers in the world. An Apache HTTP server connects the physical server that hosts a company's website (or online store) with the Internet browser of a user. Strictly speaking, an Apache HTTP server is the Apache software running on a Windows, Linux, or Unix system. Apache HTTP servers are popular because they are open-source and cross-platform web servers.
In fact, Apache HTTP servers are default components of the IT infrastructures of countless companies around the world. This makes Apache monitoring all the more essential, as monitoring is the only way to ensure Apache systems are running properly at all times.
PRTG is a proprietary software tool that can track the health and performance of Apache’s open source web servers and other services in real time, round the clock. Available for Windows-based on-premises servers or as a cloud-hosted solution, it's capable of monitoring unlimited local, remote, and virtual devices, bringing critical system data together in one simple, intuitive interface you can access from anywhere: at the office, at home, or on the go.
PRTG has preconfigured sensors that are specifically designed to integrate seamlessly with Apache web servers and other services and collect data about CPU usage, memory usage, latency, bandwidth, throughput, and other key Apache metrics. The data is gathered in a centralized dashboard alongside all your other hardware, software, virtualized environment, and environmental metrics, creating a golden source of truth for your entire network's health and performance.
Once you download PRTG, the automatic network discovery does most of the work. Key in your preferred IP address range and it will detect every network component in that range – including Apache HTTP servers and other services – and assign the appropriate sensors. Once that's done, you can pick your preferred performance thresholds. Just make sure you set the right permissions for HTTP monitoring before you set up the sensors, or they won't be able to read the data.
In PRTG, “sensors” are the basic monitoring elements. One sensor usually monitors one measured value in your network, for example the traffic of a switch port, the CPU load of a server, or the free space on a disk drive. On average, you need about 5-10 sensors per device or one sensor per switch port.
Paessler conducted trials in over 600 IT departments worldwide to tune its network monitoring software closer to the needs of sysadmins. The result of the survey: over 95% of the participants would recommend PRTG – or already have.

Paessler PRTG is used by companies of all sizes. Sysadmins love PRTG because it makes their job a whole lot easier.
Bandwidth, servers, virtual environments, websites, VoIP services – PRTG keeps an eye on your entire network.
Everyone has different monitoring needs. That’s why we let you try PRTG for free.