Custom alerts and data visualization let you quickly identify and prevent QoS-related network issues and disruptions.
Business continuity depends on critical applications. A solid network is crucial for everything from sending legal documents over a secure connection to VoIP calls with important clients. Paessler PRTG is the key to keeping your IT infrastructure going and the future bright for your organization.
Don’t guess; know when and where your network is most vulnerable. Quality of Service (QoS) monitoring with PRTG helps you identify and prioritize traffic based on importance and sensitivity to delay.
Learn when your network is most likely to suffer congestion issues and accurately plan for potential bottlenecks.
It’s not enough to know your network is underperforming; you also need to know where to improve. Comprehensive QoS monitoring gives you the answer by measuring key performance metrics.
Track packet loss, measure latency, monitor jitter and the MOS, and make sure that your video conferences can take place without interruptions, all with PRTG.
Especially in enterprise-level organizations, QA is a necessary part of network management. Are your network policies being followed? Is your traffic correctly prioritized? Does your network performance meet your service level agreements (SLA)?
PRTG gives you the answers to these essential quality assurance questions via in-depth reports that you can easily customize according to your needs.
QoS monitoring tools can be aggressive with alerts, but you don’t have to pull your hair out. PRTG brings you real-time alerts through push, SMS, email, and more.
Customize your alerts based on your network’s unique needs and thresholds. And, with our PRTG apps for iOS or Android, you can get the alerts that matter immediately, wherever you are.
Diagnose network issues by continuously tracking your network’s quality of service, including data traffic and network bandwidth monitoring. Show network congestion, bottlenecks, and packet loss in real time. Visualize monitoring data in clear graphs and dashboards to identify problems more easily. Gain the overview you need to troubleshoot QoS-related issues with video conferencing, VoIP calls, and other business processes.

Device tree view of the complete monitoring setup

Custom PRTG dashboard for keeping an eye on the entire IT infrastructure

Live traffic data graph in PRTG
“All-around winning
network monitor”
“The real beauty of PRTG is the endless possibilities it offers”
“PRTG Network Monitor
is very hard to beat”
The same monitoring software that brings you custom alerts, custom reporting, custom sensors, and custom monitoring also brings you customizable dashboards.
PRTG lets you create tailored views, so you can highlight the important QoS metrics and monitor them at a glance.
PRTG includes preconfigured sensors specifically designed for QoS performance monitoring, making setup fast and easy. It’s user-friendly, making it accessible to beginner and experienced network admins.
So, while your competitors are still struggling to get their monitoring up, you’re already improving performance.
No more individual monitoring programs that fight with each other and provide conflicting reports.
PRTG is a high-performance, all-in-one monitoring tool that covers your entire IT infrastructure, not just your quality of service – including hardware, web servers, cloud services, virtualized environments, and more. You’re welcome!
PRTG comes with more than 250 native sensor types for monitoring your entire on-premises, cloud, and hybrid cloud environment out of the box. Check out some examples below!
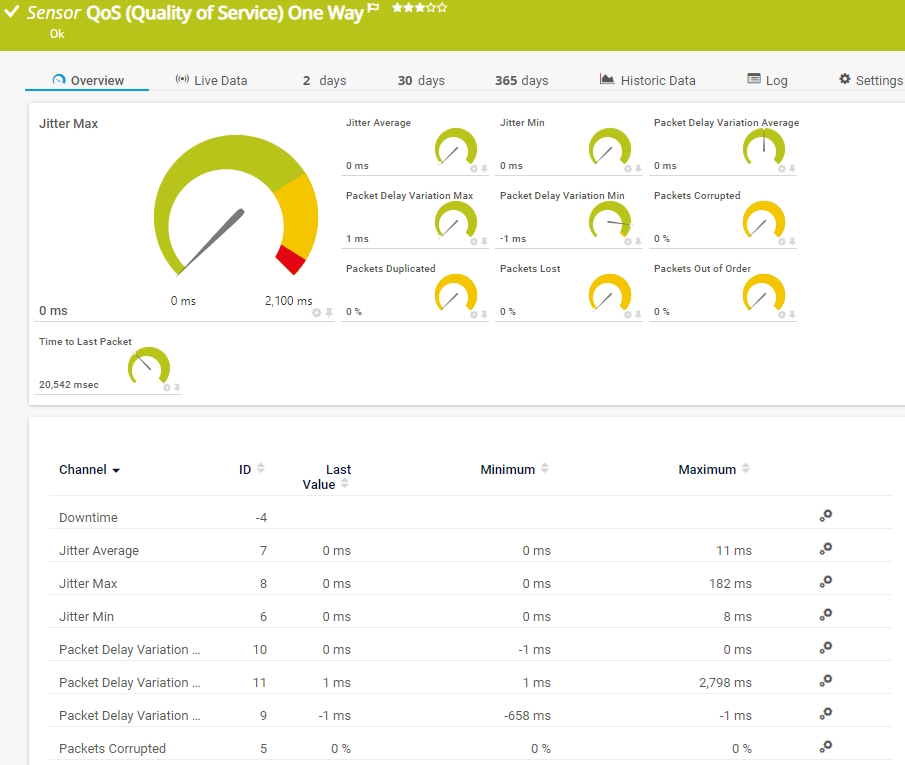
The QoS (Quality of Service) One Way sensor monitors parameters regarding the quality of a network connection between two probes. It can show the following:
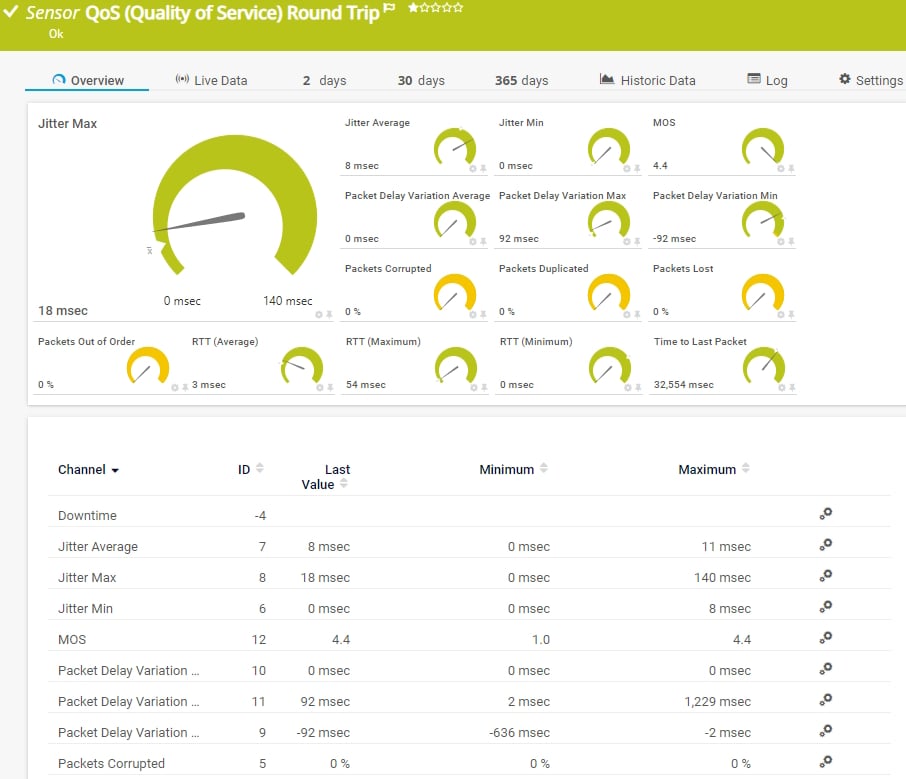
The QoS (Quality of Service) Round Trip sensor monitors parameters regarding the quality of a network connection between two probes. It can show the following:
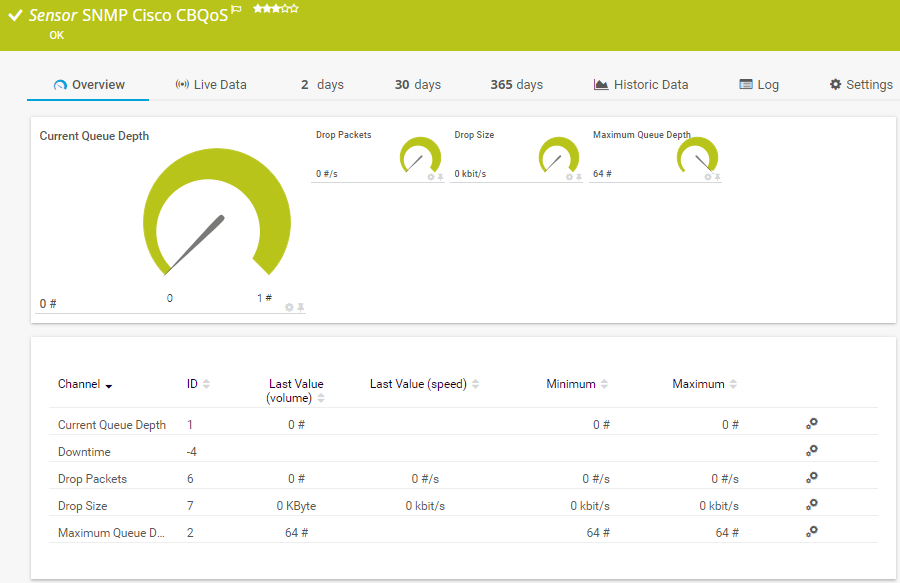
The SNMP Cisco CBQoS sensor monitors network parameters using Cisco's Class Based Quality of Service (CBQoS). It can show the following:
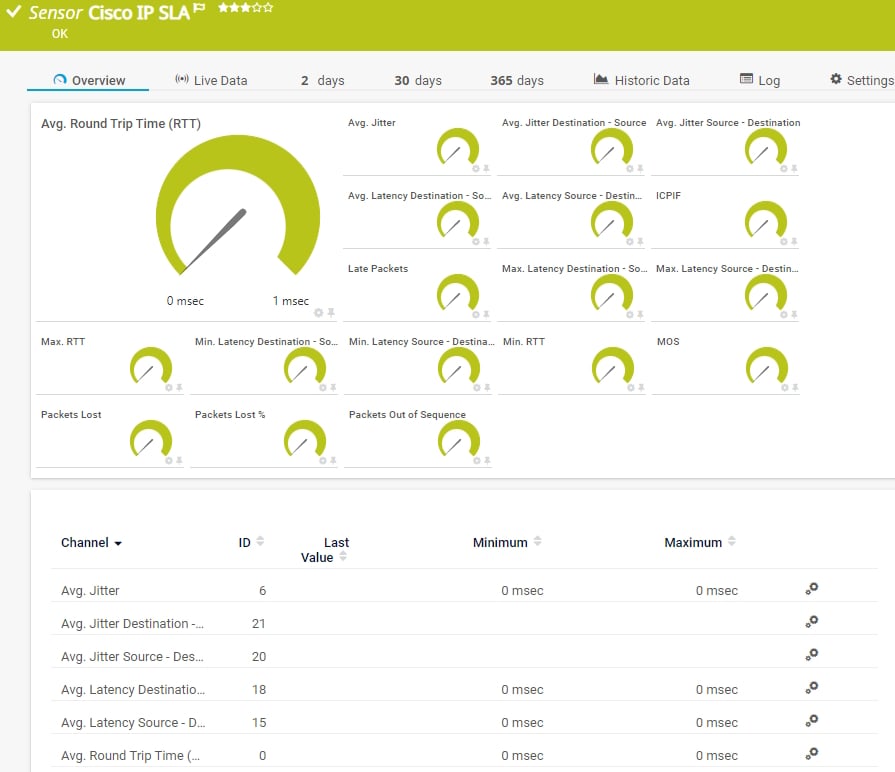
The Cisco IP SLA sensor monitors Voice over IP (VoIP) network parameters using IP service level agreements (SLA) from Cisco. It can show the following:
See the PRTG Manual for a list of all available sensor types.

Custom alerts and data visualization let you quickly identify and prevent QoS-related network issues and disruptions.
PRTG is set up in a matter of minutes and can be used on a wide variety of mobile devices.


“Excellent tool for detailed monitoring. Alarms and notifications work greatly. Equipment addition is straight forward and server initial setup is very easy. ...feel safe to purchase it if you intend to monitor a large networking landscape.”
Partnering with innovative IT vendors, Paessler unleashes synergies to create
new and additional benefits for joined customers.
By integrating PRTG with Martello iQ, you can add a fast analytics layer to improve uptime, visualize your IT environment, and integrate all of your IT systems into a single pane of glass.
Integrating monitoring results from PRTG into NetBrain maps makes the foundation for network automation.
Siemon and Paessler bring together intelligent building technology and advanced monitoring and make your vision of intelligent buildings and data centers become reality.
Real-time notifications mean faster troubleshooting so that you can act before more serious issues occur.
Network Monitoring Software – Version 26.1.116.1532 (February 9th, 2026)
Download for Windows and cloud-based version PRTG Hosted Monitor available
English, German, Spanish, French, Portuguese, Dutch, Russian, Japanese, and Simplified Chinese
Network devices, bandwidth, servers, applications, virtual environments, remote systems, IoT, and more
Choose the PRTG Network Monitor subscription that's best for you


Quality of service refers to the quality of a communication service from the point of view of the user. Both the establishment of the connection and the connection communication should be stable, with data packets transmitted free of errors and in their entirety. Quality of service is an extremely important consideration, especially for companies.
Quality of service is measured by four main parameters:
QoS monitoring, or Quality of Service monitoring, refers to the process of measuring and managing the performance and efficiency of a network's services to ensure they meet specific predefined standards and requirements. QoS is crucial in network environments where different types of traffic, such as voice, video, and data, coexist and compete for network resources.
Yes. QoS monitoring helps manage bandwidth more effectively by helping admins identify and prioritize critical traffic. This reduces congestion, improving the network.
The International Telecommunication Union (ITU-T) is responsible for telecommunications standards. It provides several recommendations regarding quality of service. For example: packet loss should be no higher than 5%, while with latency, delays of 125 milliseconds or less are still acceptable.
PRTG has even stricter QoS requirements than the ITU-T’s recommendations: a packet loss rate of 0%, and maximum latency and jitter values of 100 and 25 milliseconds.
In PRTG, “sensors” are the basic monitoring elements. One sensor usually monitors one measured value in your network, for example the traffic of a switch port, the CPU load of a server, or the free space on a disk drive. On average, you need about 5-10 sensors per device or one sensor per switch port.
Paessler conducted trials in over 600 IT departments worldwide to tune its network monitoring software closer to the needs of sysadmins. The result of the survey: over 95% of the participants would recommend PRTG – or already have.

Paessler PRTG is used by companies of all sizes. Sysadmins love PRTG because it makes their job a whole lot easier.
Bandwidth, servers, virtual environments, websites, VoIP services – PRTG keeps an eye on your entire network.
Everyone has different monitoring needs. That’s why we let you try PRTG for free.