Virtual server monitoring with PRTG
Secure your virtual machines’ continued reliability
- Monitor your whole virtual environment from one place, including server hardware
- Proactively detect and fix issues with custom real-time alerts and notifications
- Compatible with VMware, Hyper-V, Citrix XenServer & other major virtualization platforms
PRTG virtual server monitoring: What you’ll find on this page
Server virtualization = more efficiency + less downtime = happier admins
Virtualization saves money and space, improves availability, and simplifies disaster recovery.
But, because a virtual environment has both physical and virtual elements, keeping an eye on this critical part of today's enterprise data centers comes with its own unique set of challenges.
Our all-in-one virtual network monitoring software Paessler PRTG handles all the complexity so you don't have to.
Accurate, completely customizable, and designed to work with most major virtualization platforms, it can monitor every single variable you can think of round the clock, ensuring your virtual servers — and environment — run smoothly, so you and your colleagues can get on with your jobs.
PRTG makes virtual server monitoring easy
Custom alerts and data visualizations make it easy to monitor, identify, and prevent latency, high CPU load, low memory, and other performance issues.
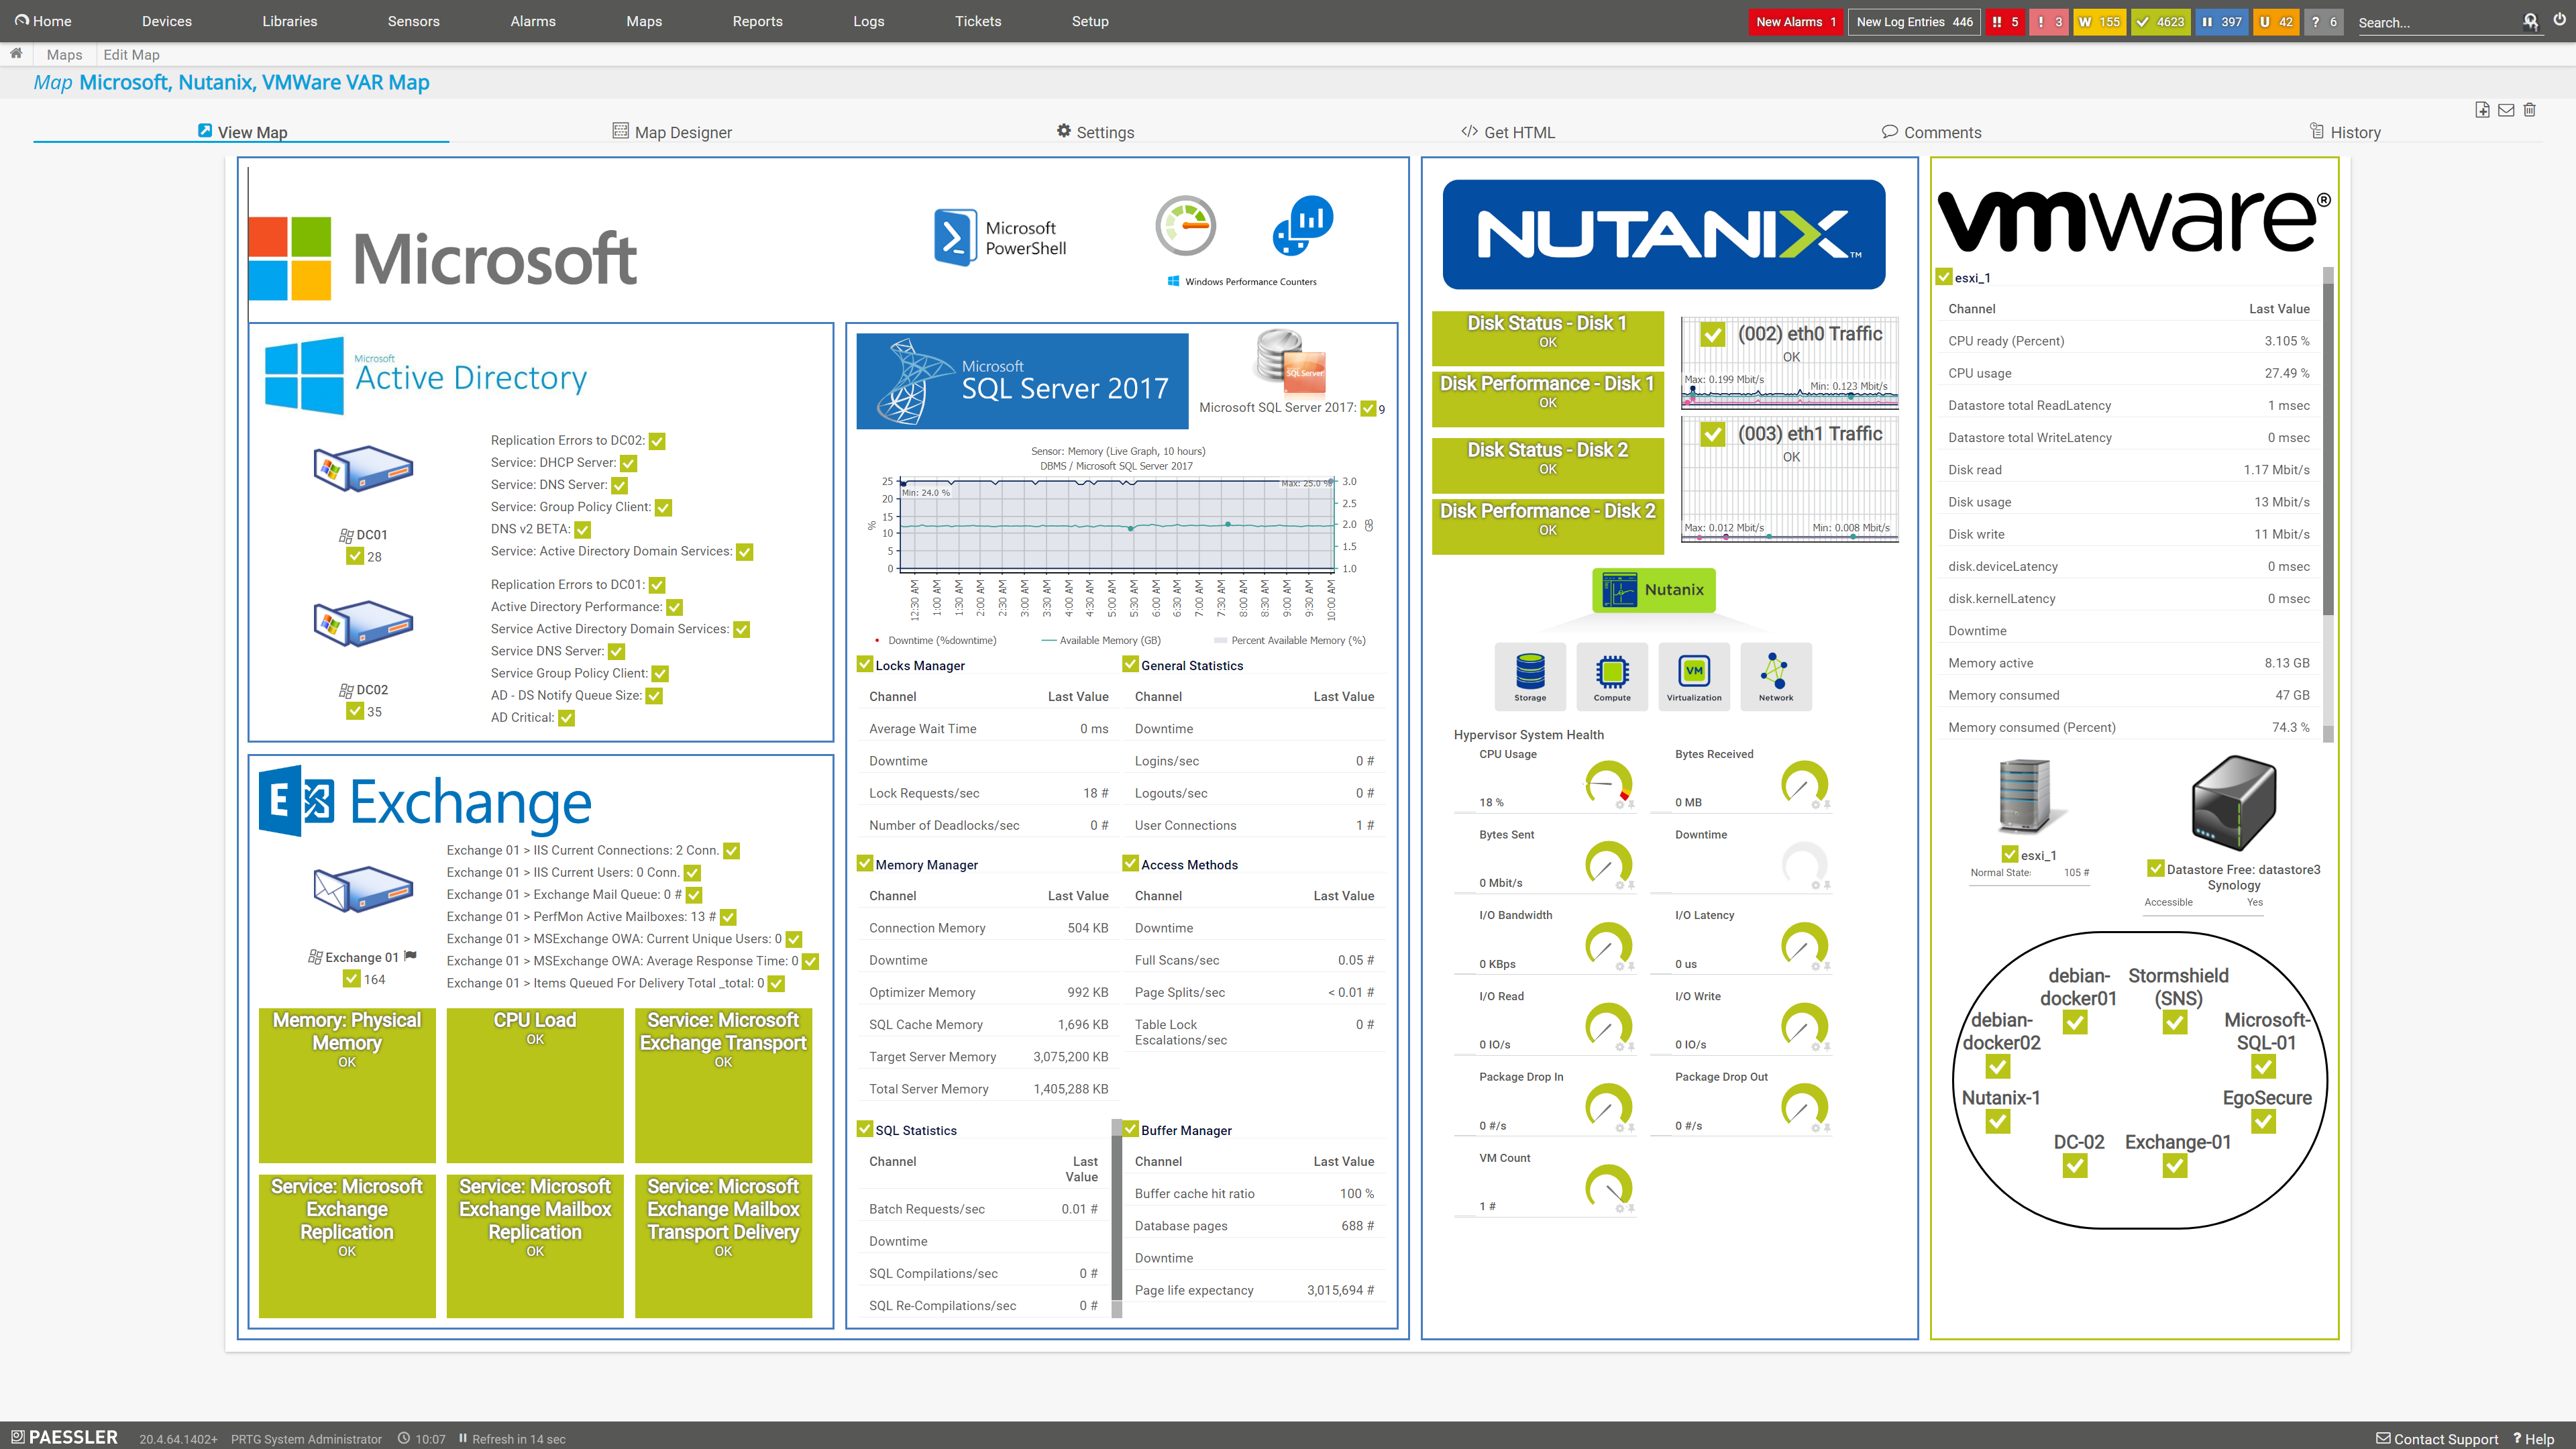
What virtual machine monitoring looks like in PRTG
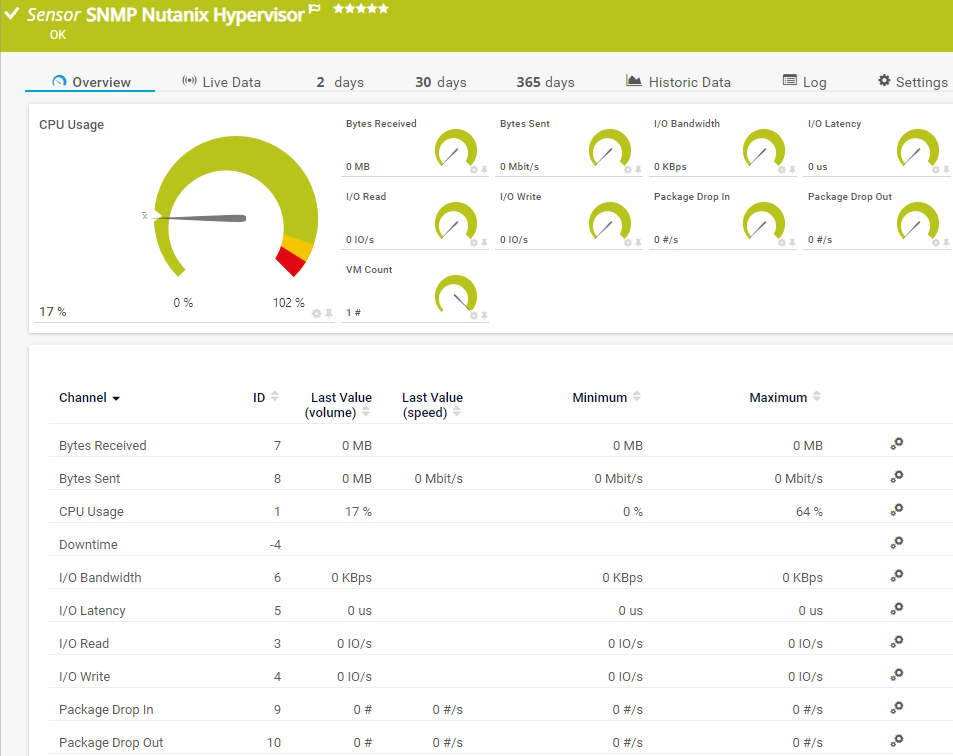
Diagnose network issues by continuously tracking physical servers, hypervisors, VMs, and other virtual server components. Show CPU load, memory usage, server performance and capacity, and other key metrics in real time. Visualize monitoring data in clear graphs and dashboards to identify problems more easily. Gain the overview you need to troubleshoot what's causing latency, bottlenecks, and other performance issues.
5 reasons why to choose PRTG as your virtual server monitoring tool
End-to-end visibility
Get a quick overview of your virtual servers' health, or zoom in to look at specific metrics up close. From overall performance to memory use, availability, and even the status of virtual machines and virtual desktops, PRTG can be as broad or as detailed as you need.
Quick and easy setup
With just a few clicks, you can add your virtual servers to PRTG and get started with your monitoring. Our preconfigured sensors receive all key data regarding your hosts, hypervisors, VMs, and applications. Neat, customizable dashboards ensure you constantly get the information you need.
Automatic real-time alerts
Pick your preferred thresholds and get on with your day. PRTG will monitor your virtual servers round the clock and let you know as soon as something's not right via SMS, email, push notification, or other methods, so you can fix it before any of your colleagues notice.
Proactive capacity planning
Is your virtual infrastructure reaching capacity? PRTG puts key performance data at your fingertips, making it easier to spot where you're under- or over-resourced, and plead the case for more investment with your less technical higher-ups.
Start monitoring virtual servers with PRTG and see how it can make your network more reliable and your job easier.
Hard data on every critical virtual component variable: Our preconfigured virtual server sensors
With preconfigured sensors for most major virtualization platforms, monitoring your virtual servers in PRTG is as simple as it gets.
Find the root cause of the problem with our PRTG virtual server monitoring solution
Real-time notifications mean faster troubleshooting so that you can act before more serious issues occur.
PRTG is compatible with all major vendors, products, and systems
Create innovative solutions with Paessler’s partners
Partnering with innovative vendors, Paessler unleashes synergies to create
new and additional benefits for joined customers.
Your virtual server monitor at a glance – even on the go
Set up PRTG in minutes and use it on almost any mobile device.


PRTG makes virtual server monitoring as easy as it gets
Custom alerts and data visualization let you quickly identify and prevent latency, high CPU load, low memory, and other performance issues.
“Excellent tool for detailed monitoring. Alarms and notifications work greatly. Equipment addition is straight forward and server initial setup is very easy. ...feel safe to purchase it if you intend to monitor a large networking landscape.”
Infrastructure and Operations Engineer in the Communications Industry, firm size 10B - 30B USD

PRTG: The multi-tool for sysadmins
Adapt PRTG individually and dynamically to your needs and rely on a strong API:- HTTP API: Access monitoring data and manipulate monitoring objects via HTTP requests
- Custom sensors: Create your own PRTG sensors for customized monitoring
- Custom notifications: Create your own notifications and send action triggers to external systems
- REST Custom sensor: Monitor almost everything that provides data in XML or JSON format
More than just a monitoring tool:
Reasons our customers love PRTG


Still not convinced?
More than 500,000
sysadmins love PRTG
Paessler PRTG is used by companies of all sizes. Sysadmins love PRTG because it makes their job a whole lot easier.
Monitor your entire IT infrastructure
Bandwidth, servers, virtual environments, websites, VoIP services – PRTG keeps an eye on your entire network.
Try Paessler PRTG
for free
Everyone has different monitoring needs. That’s why we let you try PRTG for free.
Start monitoring virtual servers with PRTG and see how it can make your network more reliable and your job easier.
|
PRTG |
Network Monitoring Software - Version 25.1.104.1961 (April 7th, 2025) |
|
Hosting |
Download for Windows and cloud-based version PRTG Hosted Monitor available |
Languages |
English, German, Spanish, French, Portuguese, Dutch, Russian, Japanese, and Simplified Chinese |
Pricing |
Up to 100 sensors for free (Price List) |
Unified Monitoring |
Network devices, bandwidth, servers, applications, virtual environments, remote systems, IoT, and more |
Supported Vendors & Applications |
|


Combining the broad monitoring feature set of PRTG with IP Fabric’s automated network assurance creates a new level of network visibility and reliability.