Custom alerts and data visualization let you quickly identify and prevent slow network speeds, congestion, and other network performance issues.
Stop letting network slowdowns call the shots. Paessler PRTG puts you back in control with clear, actionable insights that transform complex bandwidth testing into a straightforward process. Pinpoint bottlenecks, refine upload speed and download speed, and ensure top-tier network performance across any setup.
Diagnose network issues by continuously tracking bandwidth usage and throughput in your entire network. Show response time, upload and other key metrics in real time. Visualize monitoring data in clear graphs and dashboards to identify problems more easily. Gain the overview you need to troubleshoot bandwidth bottlenecks and other network performance issues.

Live traffic data graph in PRTG

Device tree view of the complete monitoring setup

Custom PRTG dashboard for keeping an eye on the entire IT infrastructure
Live traffic data graph in PRTG
Device tree view of the complete monitoring setup
“All-around winning
network monitor”
“The real beauty of PRTG is the endless possibilities it offers”
“PRTG Network Monitor
is very hard to beat”
PRTG's intelligent monitoring tools give you the confidence to maintain fast, reliable connections – no matter the challenge.
PRTG gives you more than just a basic speed test – it provides detailed throughput metrics that guide more informed broadband decisions. Get a crystal-clear view of download and upload speed, making sure you invest in the right plans and infrastructure upgrades.
Stop guessing where the problem lies. PRTG reveals how your routers and internet providers perform under real conditions, exposing bottlenecks and inconsistencies. Make proactive adjustments to maintain maximum speed and keep your entire internet connection stable and efficient.
PRTG's real-time monitoring and automated tests do the heavy lifting, notifying you the moment your network deviates from normal. By spotting issues instantly – be it a sudden drop in Mbps or a misconfigured IP address – you'll stay a step ahead in maintaining reliable connectivity.
Most IT environments today are complex, with a mix of options. PRTG's network bandwidth tester works with all of them. Monitor bandwidth across Wi-Fi zones, ethernet connections, and hybrid setups spanning on-prem Windows and Linux, as well as cloud systems.
PRTG comes with more than 250 native sensor types for monitoring your entire on-premises, cloud, and hybrid cloud environment out of the box. Check out some examples below!
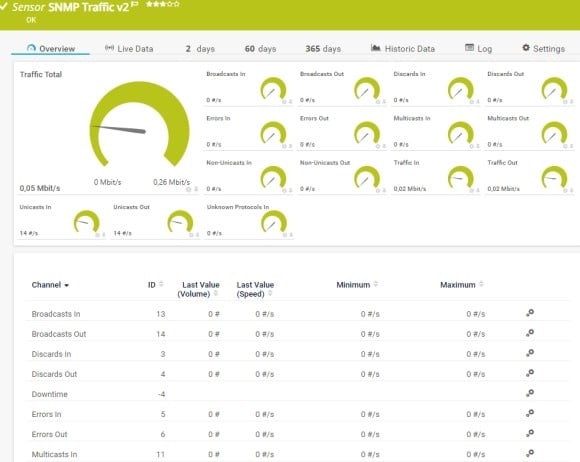
The SNMP Traffic v2 sensor monitors bandwidth and traffic on a device. It can show the following:
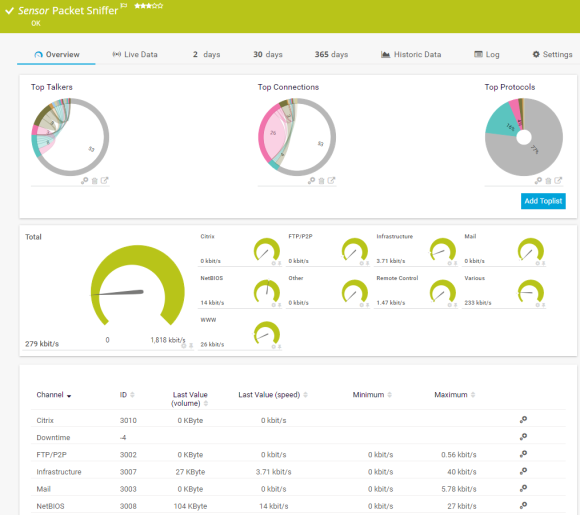
The Packet Sniffer sensor monitors the headers of data packets that pass a local network card using a built-in packet sniffer. You can choose from predefined channels. It can show the following and more:
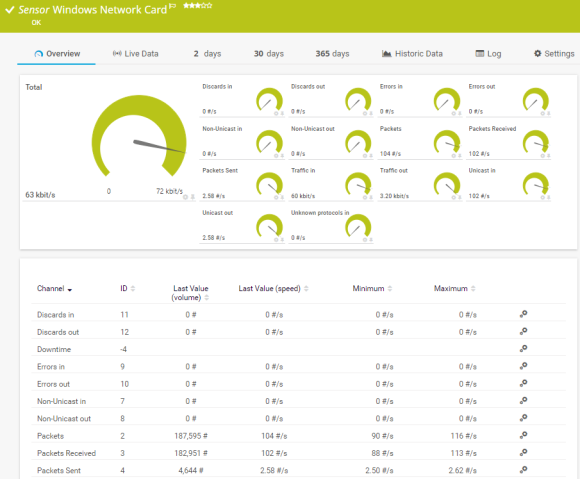
The Windows Network Card sensor monitors the bandwidth usage and traffic of a network interface via Windows Management Instrumentation (WMI) or Windows performance counters. It can show the following:
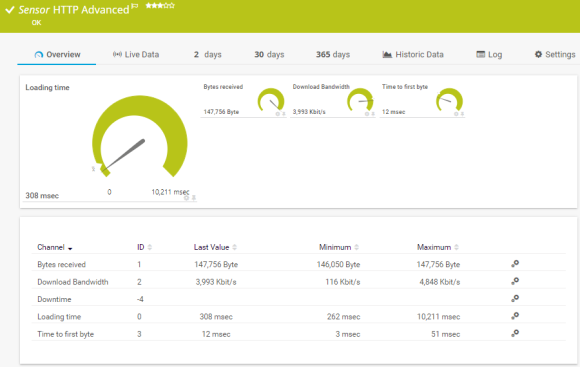
The HTTP Advanced sensor monitors the source code of a web page using HTTP. It supports authentication, content checks, and other advanced parameters. It can show the following:
See the PRTG Manual for a list of all available sensor types.

Custom alerts and data visualization let you quickly identify and prevent slow network speeds, congestion, and other network performance issues.
PRTG is set up in a matter of minutes and can be used on a wide variety of mobile devices.


“Excellent tool for detailed monitoring. Alarms and notifications work greatly. Equipment addition is straight forward and server initial setup is very easy. ...feel safe to purchase it if you intend to monitor a large networking landscape.”
Partnering with innovative IT vendors, Paessler unleashes synergies to create
new and additional benefits for joined customers.

By integrating PRTG with Martello iQ, you can add a fast analytics layer to improve uptime, visualize your IT environment, and integrate all of your IT systems into a single pane of glass.
Integrating monitoring results from PRTG into NetBrain maps makes the foundation for network automation.

Siemon and Paessler bring together intelligent building technology and advanced monitoring and make your vision of intelligent buildings and data centers become reality.
Real-time notifications mean faster troubleshooting so that you can act before more serious issues occur.
Network Monitoring Software – Version 24.4.102.1351 (November 12th, 2024)
Download for Windows and cloud-based version PRTG Hosted Monitor available
English, German, Spanish, French, Portuguese, Dutch, Russian, Japanese, and Simplified Chinese
Network devices, bandwidth, servers, applications, virtual environments, remote systems, IoT, and more
Choose the PRTG Network Monitor subscription that's best for you


A speed test measures your bandwidth, latency, and other parameters to ensure you get the megabits or gigabits you expect. It helps detect bottlenecks, confirm internet service quality, and maintain top-notch network performance.
Create three HTTP Advanced sensors to access files on servers operating at different speeds, such as one that houses a static website.
Step 2: Perform your bandwidth test
Let the sensors run for a few hours at intervals of a few minutes each. The sensors will display the number of kilobits per second that were reached during the download.
Step 3: Evaluate your data rate (KB/s)
For example, if you have a data line with a specified bandwidth of 4 Mbit/s, it should take 1,000 ms (1 second) to download a 500 KB file. 4 Mbit/s = 0.5 MB/s = 500 KB/s.
Step 4: End your bandwidth test
If they run for too long, bandwidth tests can generate enormous amounts of data. You should therefore end the test quickly and disable the sensors.
Step 5: Expand your test to monitoring
This kind of test only checks your bandwidth at a specific moment in time. It does not, however, reveal the sources of the problems which may be affecting your bandwidth. In large networks, these may include a router or a switch. With PRTG, you can monitor your entire network.
Definitely. It doesn't matter whether you're managing multiple internet providers across global offices or scaling to handle huge broadband demands. PRTG adapts. Test your maximum speed in each location and keep video conferencing crystal clear.
Absolutely! PRTG's rich dashboards, easy-to-read graphs, and granular throughput details help you identify and fix bottlenecks. Test upload speed, confirm stable latency, and tame tricky router configurations.
Of course. PRTG measures bandwidth in Wi-Fi and ethernet setups, ensuring balanced upload speed, stable latency, and minimal packet loss regardless of how you connect.
In PRTG, “sensors” are the basic monitoring elements. One sensor usually monitors one measured value in your network, for example the traffic of a switch port, the CPU load of a server, or the free space on a disk drive. On average, you need about 5-10 sensors per device or one sensor per switch port.
Paessler conducted trials in over 600 IT departments worldwide to tune its network monitoring software closer to the needs of sysadmins. The result of the survey: over 95% of the participants would recommend PRTG – or already have.

Paessler PRTG is used by companies of all sizes. Sysadmins love PRTG because it makes their job a whole lot easier.
Bandwidth, servers, virtual environments, websites, VoIP services – PRTG keeps an eye on your entire network.
Everyone has different monitoring needs. That’s why we let you try PRTG for free.