![]()
LAN bandwidth monitoring with PRTG
Get detailed insights into bandwidth utilization in your local area network
- Track and optimize LAN bandwidth usage for maximum efficiency
- Detect network bottlenecks and maintain peak application performance
- Get alerts on unusual traffic patterns for enhanced security oversight
Our users give top ratings for monitoring with Paessler PRTG


PRTG LAN bandwidth monitoring: What you’ll find on this page

PRTG makes LAN bandwidth monitoring as easy as it gets
Custom alerts and data visualization let you quickly identify and prevent bandwidth hogs or bandwidth bottlenecks.
LAN bandwidth monitoring by PRTG: Your network diagnostics software
To keep your LAN infrastructure performing at its best, you need a comprehensive network monitoring software. Paessler PRTG acts as your all-in-one network diagnostics tool, providing insights to maintain peak performance, reduce downtime, and optimize user experience. From monitoring bandwidth usage to analyzing traffic patterns, PRTG delivers a complete health check of your network.
Network insights
PRTG provides deep insights into your network’s bandwidth usage, traffic patterns, throughput, and QoS metrics. Customizable dashboards give you an at-a-glance overview of critical parameters, helping you detect issues early.
With threshold-based alerts, you’ll be notified the moment network performance drops, allowing for immediate action.
Bottleneck detection
Our network bandwidth monitoring solution helps identify network bottlenecks by analyzing key performance metrics such as bandwidth utilization and response times.
When these thresholds aren’t met, PRTG’s notification system makes sure you can address the issues swiftly, keeping your network running at optimal efficiency.
Versatile diagnostics
PRTG supports a wide array of technologies and protocols for analyzing bandwidth consumption and traffic patterns, including SNMP, packet sniffing, NetFlow, sFlow, jFlow, and IPFIX, making it adaptable to any network setup.
With customizable alerts, you can tailor PRTG to focus on the most critical performance metrics for your infrastructure.
Data visualization
PRTG’s dashboards transform complex data into easily understandable visualizations, allowing you to quickly assess bandwidth usage, traffic, and performance.
These customizable dashboards let you prioritize the metrics that matter most to your operations, providing a clear view of your network’s health.
What LAN bandwidth monitoring looks like in PRTG
Diagnose network issues by continuously tracking network traffic data. Show traffic flow, bandwidth usage, quality of service (QoS) stats, and other key metrics in real time. Visualize monitoring data in clear graphs and dashboards to identify problems more easily. Gain the overview you need to troubleshoot critical applications as well as performance issues with your network devices.

Device tree view of the complete monitoring setup

Custom PRTG dashboard for keeping an eye on the entire IT infrastructure
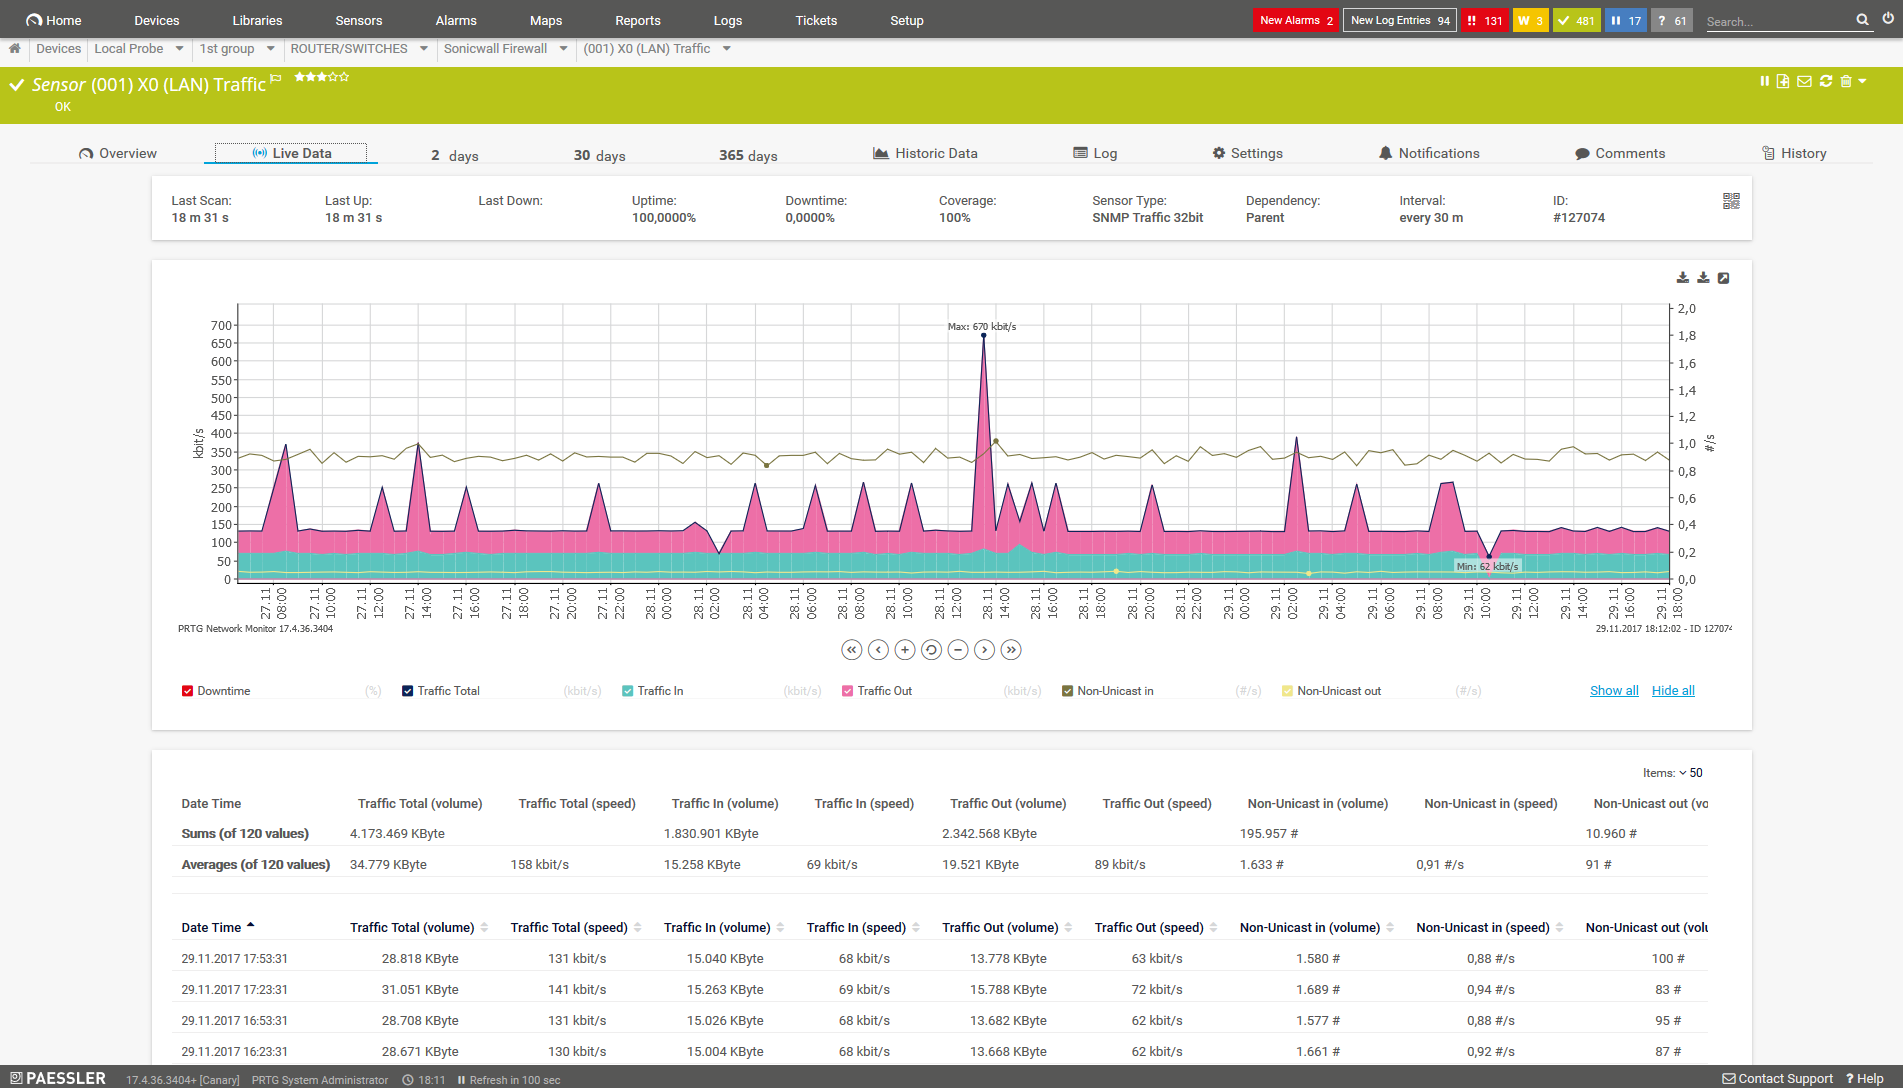
Live traffic data graph in PRTG
Start monitoring bandwidth in your local area network with PRTG and see how it can make your network more reliable and your job easier.
IT experts agree: Paessler PRTG is a great solution for IT infrastructure monitoring

“All-around winning
network monitor”

“The real beauty of PRTG is the endless possibilities it offers”

“PRTG Network Monitor
is very hard to beat”
4 more reasons PRTG’s LAN bandwidth monitoring is your network’s guardian
Holistic network surveillance
PRTG is more than just a LAN bandwidth monitor – it provides comprehensive oversight for your entire IT infrastructure. From a unified platform, you can monitor everything from routers and switches to firewalls and network interfaces.
This integrated approach simplifies your monitoring, reduces tool redundancy, and gives you full visibility across your network.
Real-time insights and alerts
In today’s fast-paced environment, timely information is critical. PRTG delivers real-time statistics and near-instant alerts, keeping you informed about your network’s status 24/7.
Whether it’s an unexpected traffic spike, a resource-heavy application, or a sudden outage, PRTG’s alerts ensure that issues are addressed before they impact performance.
Proactive network analysis
PRTG doesn’t just monitor current conditions – it helps you stay ahead of potential issues. By setting custom thresholds for key metrics, PRTG alerts you before minor fluctuations become major disruptions.
This proactive approach helps optimize network uptime and performance, giving you the foresight needed to maintain smooth operations.
User-friendly web interface
Despite its sophisticated capabilities, PRTG is designed for ease of use. The intuitive interface makes setup simple, and agentless monitoring means quick deployment.
With comprehensive visualization tools, you can easily manage your network’s health – even without extensive monitoring expertise.
Find the root cause of the problem with our PRTG LAN bandwidth monitoring solution
Real-time notifications mean faster troubleshooting so that you can act before more serious issues occur.
PRTG is compatible with all major vendors, products, and systems
![]()
Explore our preconfigured PRTG sensors for network utilization monitoring
PRTG comes with more than 250 native sensor types for monitoring your entire on-premises, cloud, and hybrid cloud environment out of the box. Check out some examples below!
PRTG makes LAN bandwidth monitoring as easy as it gets
Custom alerts and data visualization let you quickly identify and prevent bandwidth hogs or bandwidth bottlenecks.
Your LAN bandwidth monitor at a glance – even on the go
Set up PRTG in minutes and use it on almost any mobile device.


Create innovative solutions with Paessler’s partners
Partnering with innovative vendors, Paessler unleashes synergies to create
new and additional benefits for joined customers.


ScriptRunner
With ScriptRunner, Paessler integrates a powerful event automation platform into PRTG Network Monitor.
“Excellent tool for detailed monitoring. Alarms and notifications work greatly. Equipment addition is straight forward and server initial setup is very easy. ...feel safe to purchase it if you intend to monitor a large networking landscape.”
Infrastructure and Operations Engineer in the Communications Industry, firm size 10B - 30B USD
PRTG makes LAN bandwidth monitoring as easy as it gets
Custom alerts and data visualization let you quickly identify and prevent bandwidth hogs or bandwidth bottlenecks.

PRTG: The multi-tool for sysadmins
Adapt PRTG individually and dynamically to your needs and rely on a strong API:- HTTP API: Access monitoring data and manipulate monitoring objects via HTTP requests
- Custom sensors: Create your own PRTG sensors for customized monitoring
- Custom notifications: Create your own notifications and send action triggers to external systems
- REST Custom sensor: Monitor almost everything that provides data in XML or JSON format
We asked: would you recommend PRTG?
Over 95% of our customers say yes!
Paessler conducted trials in over 600 IT departments worldwide to tune its network monitoring software closer to the needs of sysadmins.
The result of the survey: over 95% of the participants would recommend PRTG – or already have.

Still not convinced?
![]()
More than 500,000
sysadmins love PRTG
Paessler PRTG is used by companies of all sizes. Sysadmins love PRTG because it makes their job a whole lot easier.
![]()
Monitor your entire IT infrastructure
Bandwidth, servers, virtual environments, websites, VoIP services – PRTG keeps an eye on your entire network.
![]()
Try Paessler PRTG
for free
Everyone has different monitoring needs. That’s why we let you try PRTG for free.
![]()
Start monitoring bandwidth in your local area network with PRTG and see how it can make your network more reliable and your job easier.
|
PRTG |
Network Monitoring Software - Version 25.1.104.1961 (April 7th, 2025) |
|
Hosting |
Download for Windows and cloud-based version PRTG Hosted Monitor available |
Languages |
English, German, Spanish, French, Portuguese, Dutch, Russian, Japanese, and Simplified Chinese |
Pricing |
Up to 100 sensors for free (Price List) |
Unified Monitoring |
Network devices, bandwidth, servers, applications, virtual environments, remote systems, IoT, and more |
Supported Vendors & Applications |
|
Discover more monitoring insights and stories

Solutions for all your monitoring needs

Powerful stories from the monitoring world
