PRTG NetFlow monitoring: What you'll find on this page
PRTG makes NetFlow monitoring as easy as it gets
Custom alerts and data visualization let you quickly identify and prevent network flow and other performance issues.
NetFlow monitoring: 4 reasons why you should consider PRTG
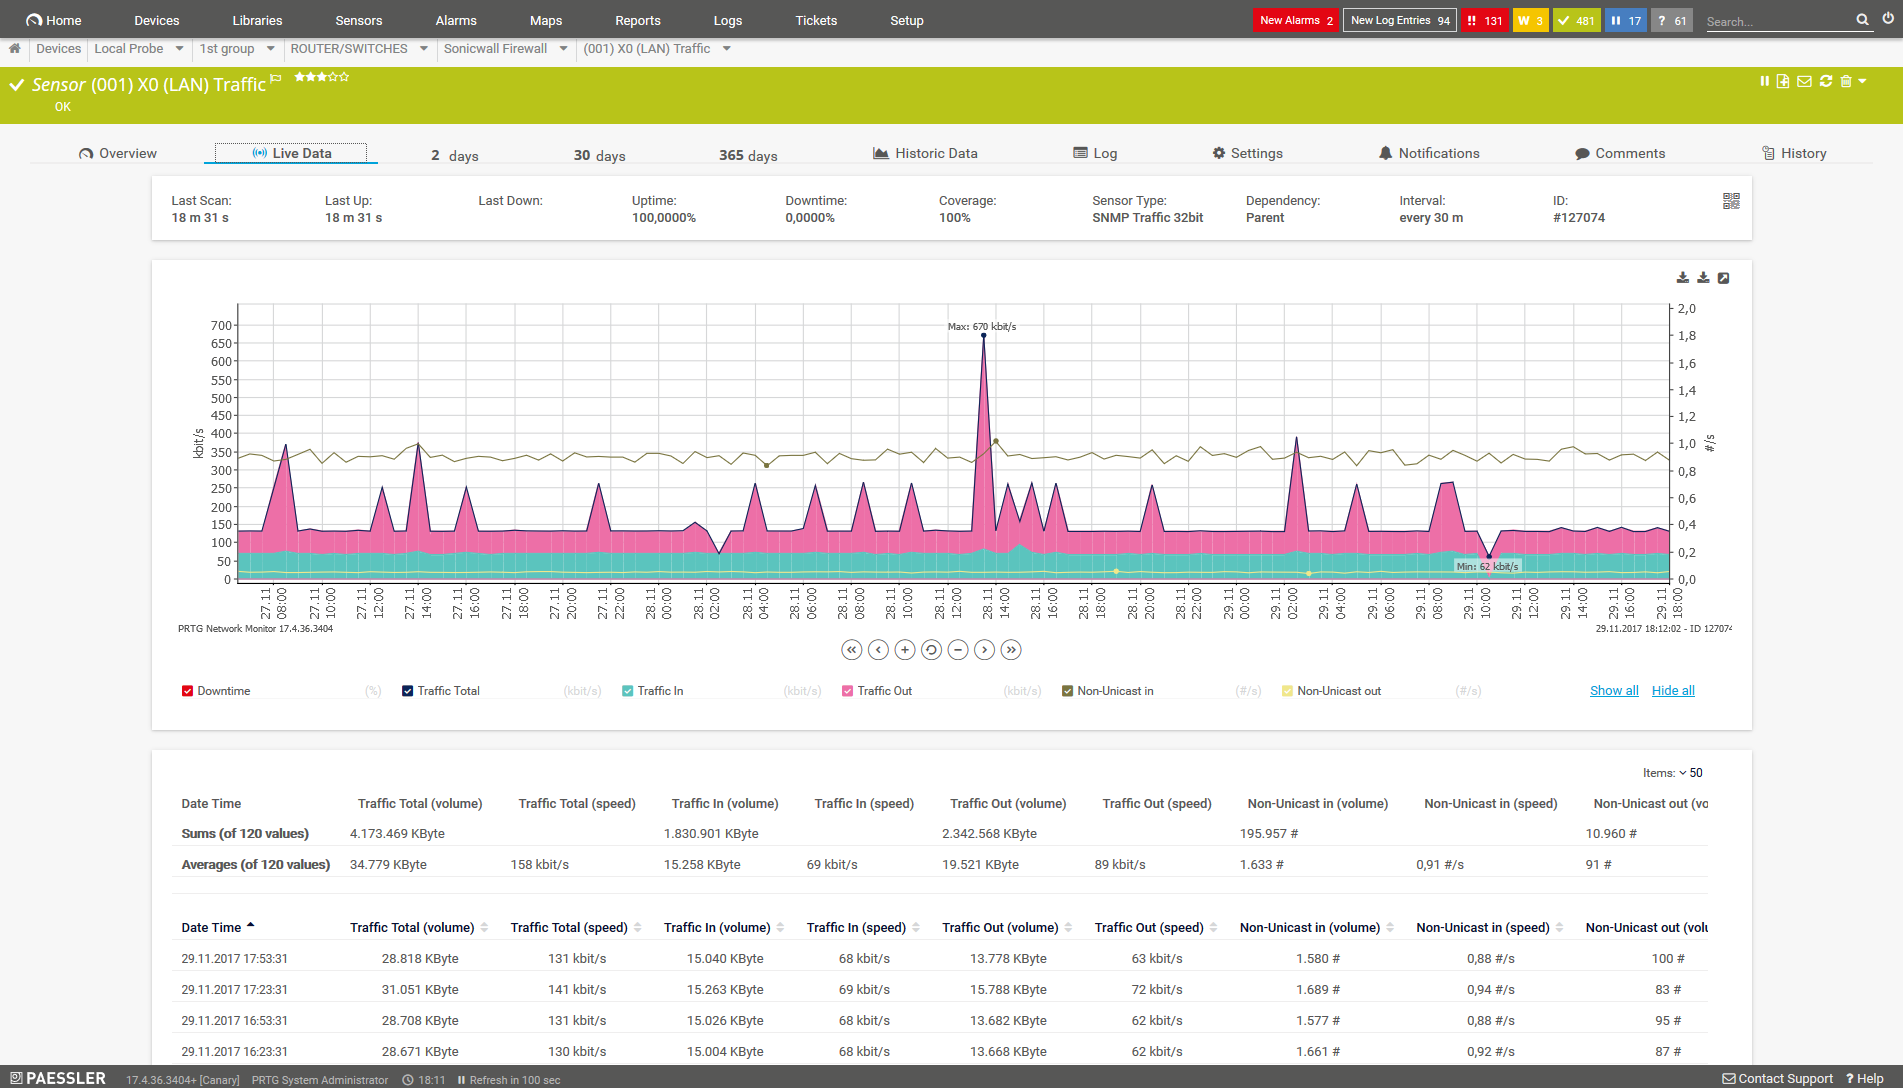
NetFlow monitoring lets you analyze traffic patterns and get a picture of network traffic flow, including detailed traffic reports. This can help you understand which process, user, or application might cause speed problems or network outages. With our PRTG NetFlow analyzer, you get a holistic view of your network, keep an eye on your network traffic and what your bandwidth is being used for.
Analyze your network data traffic in detail
Our NetFlow monitoring tool PRTG lets you analyze and monitor your bandwidth and determine, for example, the amount of IP traffic caused by IP addresses , protocols, or programs. To carry out such an analysis, configure your routers in a way that flow packets are sent to a PRTG server or a computer that has a PRTG remote probe installed.
Benefit from high efficiency & scalability
NetFlow puts only little strain on your CPU and is especially adapted for networks with heavy data traffic. With its flexible licensing model, PRTG is easy to adapt to changing network demands.
Automatic, customizable alerts included
PRTG automatically alerts you by SMS, email, push notification, or many other customizable notification methods when threshold values are exceeded. Notifications sent by PRTG reach you wherever you are – even while on the go.
Visualize data on easy-to-read dashboards
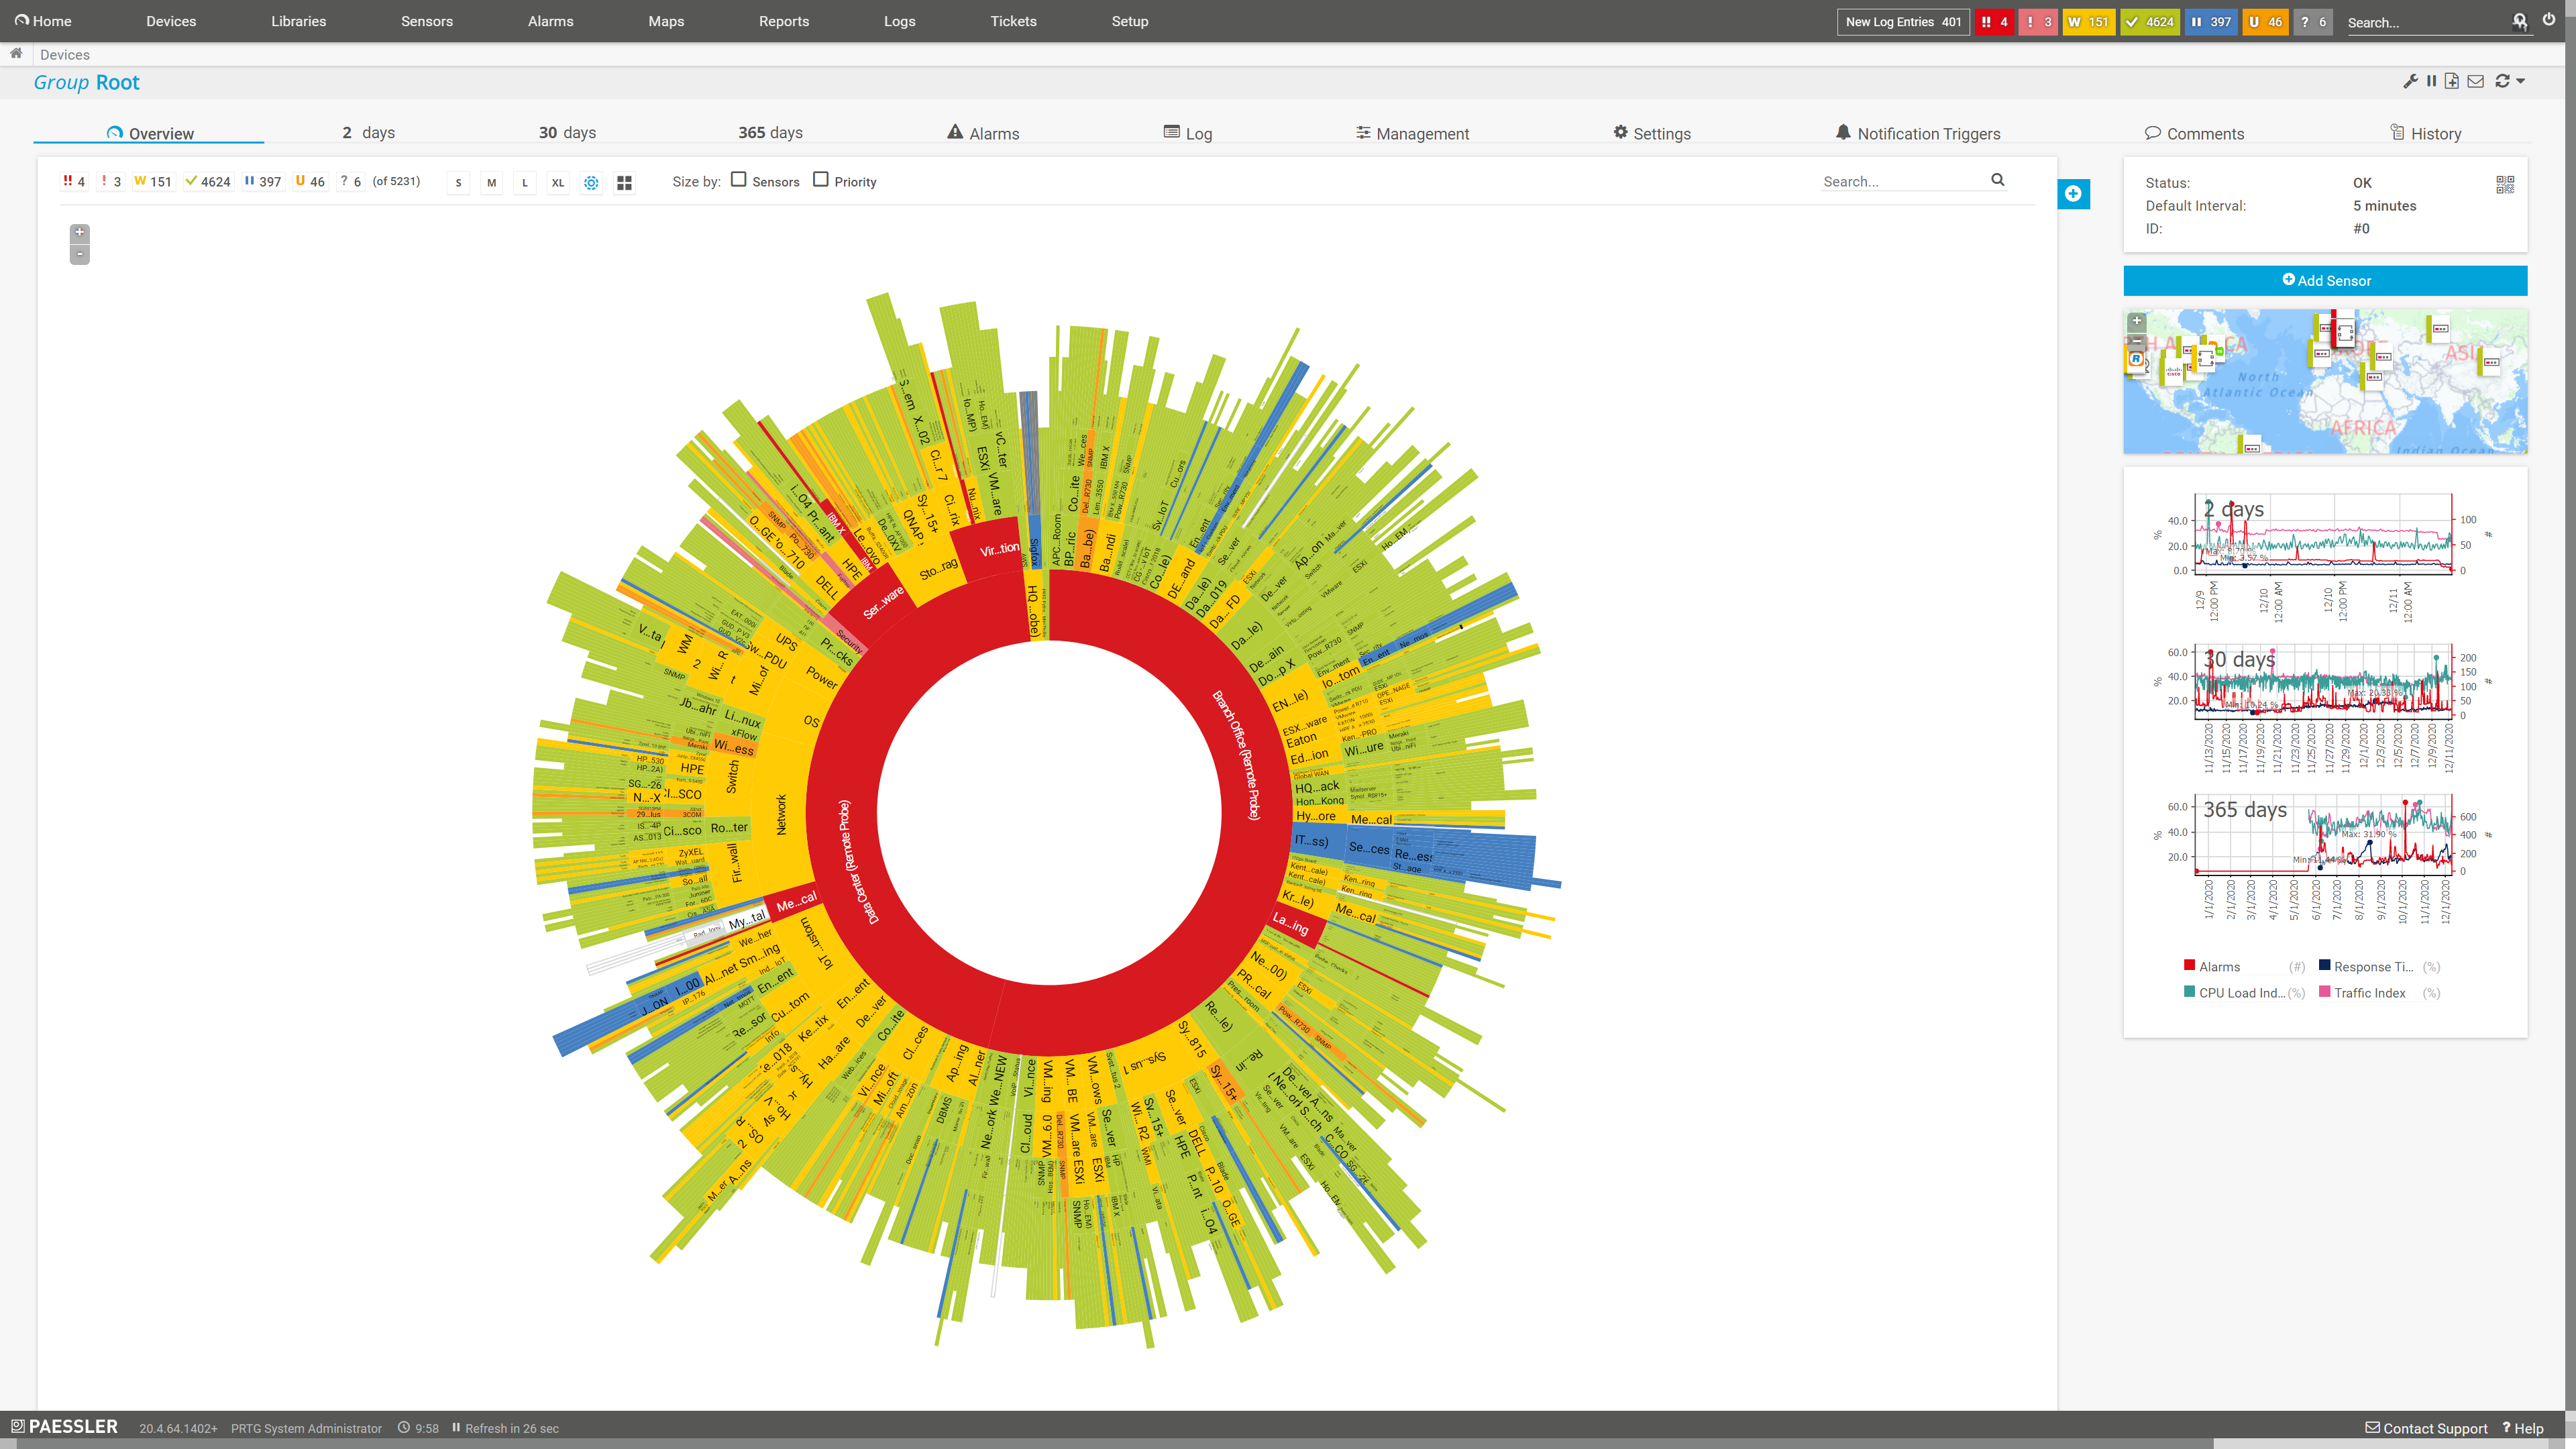
PRTG displays your network traffic data on highly customizable, easy-to-read dashboards and maps . As a cross-manufacturer monitoring software, PRTG eliminates the need to juggle a number of different software solutions – just combine your NetFlow monitoring with data from all other devices in your IT infrastructure and visualize them the way you need.
Preconfigured PRTG sensors for NetFlow analysis
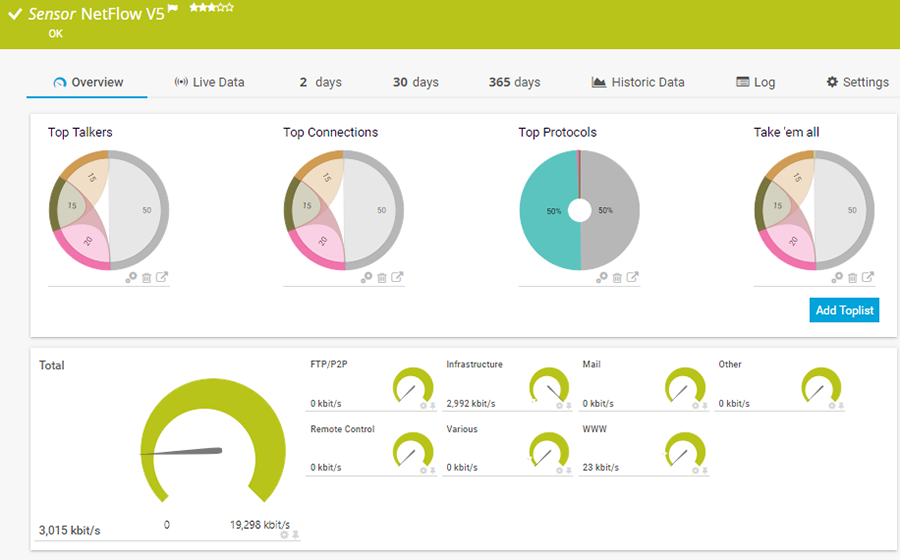
Use our built-in PRTG sensors for NetFlow monitoring that come with every PRTG license out of the box. Each sensor lets you break down traffic into the top talkers, top connections, and top protocols in your network to find out which device is using up your bandwidth.
NetFlow v5 sensors
NetFlow v5 is in widespread use. With PRTG, you get a preconfigured NetFlow v5 sensor as well as a NetFlow v5 (Custom) sensor for devices that have NetFlow v5 enabled.
NetFlow v9 sensors
NetFlow v9 is an advanced form of the NetFlow technology. PRTG provides you with the preconfigured NetFlow v9 sensor and NetFlow v9 (Custom) sensor for devices that have NetFlow v9 enabled.
IPFIX sensors
Internet Protocol Flow Information Export (IPFIX) is an advanced form of Cisco's NetFlow technology, some also call it NetFlow v10. PRTG offers two preconfigured sensors: The IPFIX sensor and the IPFIX (Custom) sensor.
What NetFlow observability looks like in PRTG
Diagnose network issues by continuously tracking the health, availability, and performance of your network devices such as routers or firewalls. Show NetFlow records, network bandwidth bottlenecks, and other key performance metrics in real time. Visualize monitoring data in clear graphs and dashboards to identify problems more easily. Gain the network visibility you need to troubleshoot flow traffic issues as well as potential network security threats.
Start network monitoring with PRTG and see how it can make your network more reliable and your job easier.
3 use cases of our NetFlow traffic analyzer PRTG
With PRTG, you can easily detect, for example, if your switches are not equipped to handle the quantity of data that passes them – before they become completely overloaded. What’s more: should these switches actually overload during a backup , for example, PRTG helps you to quickly find the root cause of the issue.
Identify bandwidth hogs
Different sources like individual users, programs, or specific data often use disproportionately high amounts of bandwidth. With NetFlow monitoring, you can break down traffic, for example, by IP address and this way discover bandwidth hogs real quick.
Spot load peaks early
Many companies experience fluctuations regarding access to various websites or applications that are used internally. Define your own warning and error thresholds so that PRTG can alert you as early as possible if values are exceeded – ideally, before the performance of your system goes down.
Avoid backup overloads
Thorough backups can lead to problems for the entire network. Such issues are frequently the result of individual routers or switches that overload during the backup and thwart the entire network. Use NetFlow monitoring to find the root cause of a problem and troubleshoot the issue quickly to optimize your network in the best way possible.
PRTG not only supports NetFlow:
Use these flow sensors as well
PRTG provides other flow sensors with which you can monitor your chat protocols, Citrix, FTP, email, and other traffic.
sFlow
The sFlow sensor receives traffic data from an sFlow v5-compatible device and shows the traffic by type. This sensor has several filter options to divide traffic into different channels. It can show the following and more:
- Traffic from Citrix applications
- Traffic from file transfer (FTP/P2P) and various other protocols (UDP, TCP)
- Traffic from network services (DHCP, DNS, Ident, ICMP, SNMP)
- Internet mail traffic (IMAP, POP3, SMTP)
- Traffic from remote control applications (RDP, SSH, Telnet, Virtual Network Computing (VNC))
jFlow v5
The jFlow v5 sensor receives traffic data from a jFlow v5-compatible device and shows the traffic by type. It can show the following and more:
- Traffic from Citrix applications
- Traffic from file transfer (FTP/P2P) and various other protocols (UDP, TCP)
- Traffic from network services (DHCP, DNS, Ident, ICMP, SNMP)
- Internet mail traffic (IMAP, POP3, SMTP)
- Traffic from remote control applications (RDP, SSH, Telnet, Virtual Network Computing (VNC))
Find the root cause of the problem with our PRTG NetFlow monitoring solution
Real-time notifications mean faster troubleshooting so that you can act before more serious issues occur.
Your NetFlow analyzer at a glance – even on the go
Set up PRTG in minutes and use it on almost any mobile device.


Create innovative solutions with Paessler’s partners
Partnering with innovative vendors, Paessler unleashes synergies to create
new and additional benefits for joined customers.
UVexplorer integrates tightly with PRTG to bring fast and accurate network discovery, detailed device inventory, and automatic network mapping to the PRTG platform.
UVnetworks
“Excellent tool for detailed monitoring. Alarms and notifications work greatly. Equipment addition is straight forward and server initial setup is very easy. ...feel safe to purchase it if you intend to monitor a large networking landscape.”
Infrastructure and Operations Engineer in the Communications Industry, firm size 10B - 30B USD
Network traffic monitoring comparison: NetFlow, SNMP, packet sniffing
SNMP
The Simple Network Management Protocol is extremely popular and offers an easy way to read device data. SNMP monitoring provides you with deeper insights into, for example, bandwidth and CPU usage, or the temperature of your hardware, but also into your network traffic.
Packet sniffing
For more detailed information on your network traffic and bandwidth usage, use packet sniffing to take a closer look at the packets passing through individual routers or switches. This technology only analyzes the header traffic.
NetFlow analysis
NetFlow is a protocol supported by Cisco hardware. You therefore need a monitoring solution as well as hardware that supports NetFlow. This technology lets you analyze your network traffic in detail without putting much strain on your network.
NetFlow monitoring for virtual environments
VMware and
NetFlow
VMware uses NetFlow technology in the "vSphere Distributed Switches (vDS)" product line. These virtual switches connect the virtual network cards of virtual machines (VMs) to the network by way of the hosts’ physical network cards. VMware integrates NetFlow for these virtual switches.
Virtual NetFlow monitoring with PRTG
Set up NetFlow in the VMware vCenter and configure it in such a way that these flows are sent to PRTG, where a corresponding flow sensor monitors and displays the data. As long as the correct NetFlow version is used, it will make no difference to PRTG where the flows come from.
Further information:
- Blog article: NetFlow Monitoring via PRTG on VMware vSphere.
- All you need to know about VMware Monitoring with PRTG.
- Virtualization monitoring with PRTG
PRTG is compatible with all major vendors, products, and systems
PRTG makes NetFlow monitoring as easy as it gets
Custom alerts and data visualization let you quickly identify and prevent network flow and other performance issues.
Network monitoring: FAQ
What is NetFlow?
NetFlow is a protocol for collecting, aggregating, and recording traffic flow data in a network. NetFlow data provides a more granular view of how bandwidth and network traffic are used than other network protocols such as SNMP.
NetFlow was developed by Cisco. It is natively integrated into Cisco’s IOS software that runs on Cisco routers and switches. Many other hardware manufacturers either support NetFlow or use alternative flow technologies such as jFlow or sFlow.
What are the best NetFlow tools?
Many tools can collect and analyze flow data. When choosing a tool, you should consider your needs, and the extent to which you would like to analyze your data. It might also make sense to use several different tools concurrently. We have found, for example, that many administrators use Wireshark in addition to PRTG. Thanks to its flow monitoring, PRTG can give you an overall picture while allowing you to rule out possible causes of network problems. Wireshark, on the other hand, offers a detailed look at individual data packets.
What is a NetFlow collector?
A NetFlow collector captures, saves, and processes NetFlow data. Some of these tools are more effective than others at providing in-depth data analysis. Many administrators, however, use one single tool like PRTG to perform the functions of both NetFlow collectors and NetFlow analyzers.
What is a NetFlow analyzer?
With a NetFlow analyzer, you not only capture flow data but also perform an in-depth analysis of this data. PRTG is both a NetFlow collector and a NetFlow analyzer. It captures and processes NetFlow data and shows this data on easy-to-read dashboards.
PRTG uses so-called toplists to display top talkers, top connections, and top protocols, and lets you drill down into the collected data for further analysis.
What are the advantages of using a single tool for NetFlow traffic collection and analysis?
Using a single tool like PRTG for NetFlow data collection and analysis can be more efficient and cost-effective than using two separate tools. A single tool usually provides a unified interface for both tasks, making it easier to navigate and use.
Additionally, having one tool for both tasks can reduce the complexity and maintenance required for the system, as there is only one set of software to update and troubleshoot.
Furthermore, using only one tool can ensure consistency in data collection and analysis, reducing the risk of errors or discrepancies between the two separate tools.
Which NetFlow collectors and analyzers are available for Windows?
PRTG is a NetFlow collector and analyzer that runs on Windows. As our focus has always been on Windows systems, we have acquired quite a bit of expertise in the area of NetFlow monitoring with Windows. It also uses technologies that enable you to monitor non-Windows operating systems.
NetFlow analyzer download: free or professional?
Many administrators wonder if there is an effective, free NetFlow analysis tool on the market, or if they should consider using a professional one. PRTG comes with 100 free sensors for life. And if you decide to expand your monitoring in the future, you can purchase a professional license at any time.
What is a sensor in PRTG?
In PRTG, “sensors” are the basic monitoring elements. One sensor usually monitors one measured value in your network, for example the traffic of a switch port, the CPU load of a server, or the free space on a disk drive.
On average, you need about 5-10 sensors per device or one sensor per switch port.

PRTG: The multi-tool for sysadmins
Adapt PRTG individually and dynamically to your needs and rely on a strong API:- HTTP API: Access monitoring data and manipulate monitoring objects via HTTP requests
- Custom sensors: Create your own PRTG sensors for customized monitoring
- Custom notifications: Create your own notifications and send action triggers to external systems
- REST Custom sensor: Monitor almost everything that provides data in XML or JSON format
PRTG makes your job easier
Our monitoring software frees you to focus on other tasks by promptly notifying you of potential issues.
Save effort
PRTG gives you one central monitoring tool for your servers and entire network. Enjoy a quick overview of your whole infrastructure via our dashboard and app.
Save time
Getting started with PRTG is a breeze. Setting up or switching from another network monitoring tool is easy thanks to the auto-discovery and pre-configured device templates.
Save money
80% of our customers report substantial cost savings with network monitoring. Your costs of licenses will likely pay for themselves within weeks.
We asked: would you recommend PRTG?
Over 95% of our customers say yes!
Paessler conducted trials in over 600 IT departments worldwide to tune its network monitoring software closer to the needs of sysadmins.
The result of the survey: over 95% of the participants would recommend PRTG – or already have.
Still not convinced?
More than 500,000
sysadmins love PRTG
Paessler PRTG is used by companies of all sizes. Sysadmins love PRTG because it makes their job a whole lot easier.
Monitor your entire IT infrastructure
Bandwidth, servers, virtual environments, websites, VoIP services – PRTG keeps an eye on your entire network.
Try Paessler PRTG
for free
Everyone has different monitoring needs. That’s why we let you try PRTG for free.
Start NetFlow monitoring with PRTG and see how it can make your network more reliable and your job easier.
|
PRTG |
Network Monitoring Software - Version 24.4.102.1351 (November 12th, 2024) |
|
Hosting |
Download for Windows and cloud-based version PRTG Hosted Monitor available |
Languages |
English, German, Spanish, French, Portuguese, Dutch, Russian, Japanese, and Simplified Chinese |
Pricing |
Up to 100 sensors for free (Price List) |
Unified Monitoring |
Network devices, bandwidth, servers, applications, virtual environments, remote systems, IoT, and more |
Supported Vendors & Applications |
|









Combining the broad monitoring feature set of PRTG with IP Fabric’s automated network assurance creates a new level of network visibility and reliability.