Custom alerts and data visualization let you quickly identify and prevent slow connection speeds, overloaded servers, and other network performance problems.
If you've ever been cruising down the highway, with the wind in your hair, only to find yourself in the middle of a long traffic jam once it's too late to turn back (who hasn't), you know how it is.
Network congestion is insidious. It builds up slowly – so slowly you barely notice it’s happening. And then… Bam! Suddenly, VoIP calls are glitchy, servers and applications are unresponsive, and your colleagues start complaining that they can't do their jobs.
You need continuous optimization to ensure traffic keeps flowing smoothly and manage your network resources effectively. And that’s where Paessler PRTG comes in.
Our all-in-one network traffic controller and network monitoring tool keeps a close eye on every variable that could impact your network’s performance, making it easier to prevent bottlenecks, network congestion, and other issues.

Setting up PRTG is so simple you barely have to lift a finger. The automatic network discovery adds all your network devices and other reachable endpoints to your monitoring environment and assigns the right sensors. Once that's done, you can configure everything to suit your requirements.
Find out about quality of service (QoS) issues, before they cause disruption. Once you pick your preferred thresholds, PRTG monitors them 24/7 and alerts you if there are problems. And because you can configure them individually for each device, there's little chance of false alarms.
PRTG doesn't just let you set thresholds. You can also pick which parameters to track, define individual notification triggers, and create your own dashboards and visualizations. And, with support for unlimited local and remote devices, it also grows with you.
It’s not all about performance. PRTG also alerts you about potential network security threats, such as unusual traffic spikes or suspicious activity. You can even monitor your CCTV system, ensuring nobody can gain physical access to your data centers without permission.
Diagnose network issues by continuously tracking traffic flow on servers, routers, firewalls, and other hardware and software components that are connected to your network. Show bandwidth usage, VoIP application performance, data packet loss, traffic by IP address and other key metrics in real time. Visualize monitoring data in clear graphs and dashboards to identify problems more easily. Gain the overview you need to troubleshoot and control network traffic in your LAN, WAN, and virtual network.

Live traffic data graph in PRTG

Device tree view of the complete monitoring setup

Custom PRTG dashboard for keeping an eye on the entire IT infrastructure
Live traffic data graph in PRTG
Device tree view of the complete monitoring setup
“All-around winning
network monitor”
“The real beauty of PRTG is the endless possibilities it offers”
“PRTG Network Monitor
is very hard to beat”
PRTG can monitor every variable imaginable on every single hardware, software, or virtual component on your network, 24/7. Which means you'll have complete visibility into your traffic flows and can easily pinpoint the root cause of any issues. This includes:
PRTG comes with more than 250 native sensor types for monitoring your entire on-premises, cloud, and hybrid cloud environment out of the box. Check out some examples below!
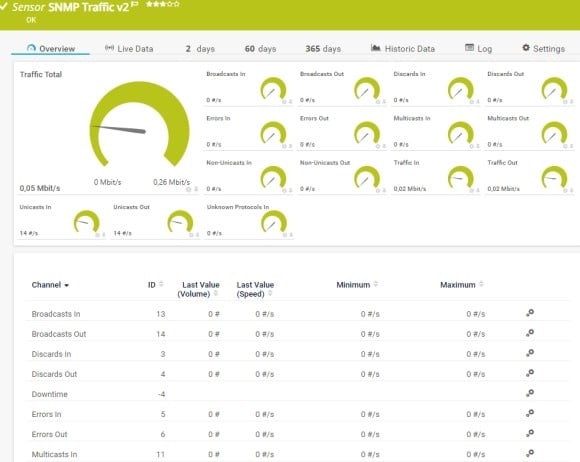
The SNMP Traffic v2 sensor monitors bandwidth and traffic on a device. It can show the following:
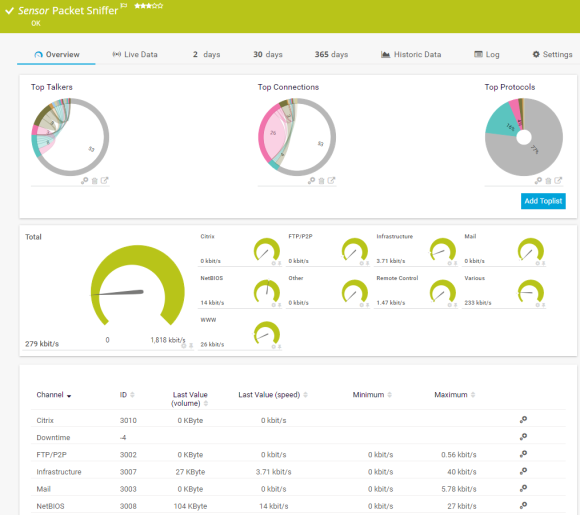
The Packet Sniffer sensor monitors the headers of data packets that pass a local network card using a built-in packet sniffer. You can choose from predefined channels. It can show the following and more:
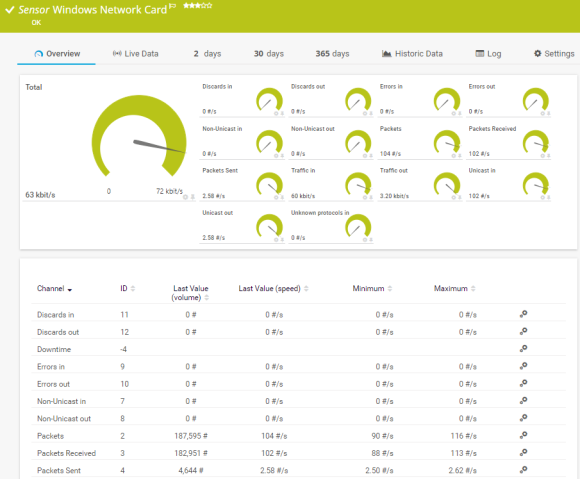
The Windows Network Card sensor monitors the bandwidth usage and traffic of a network interface via Windows Management Instrumentation (WMI) or Windows performance counters. It can show the following:
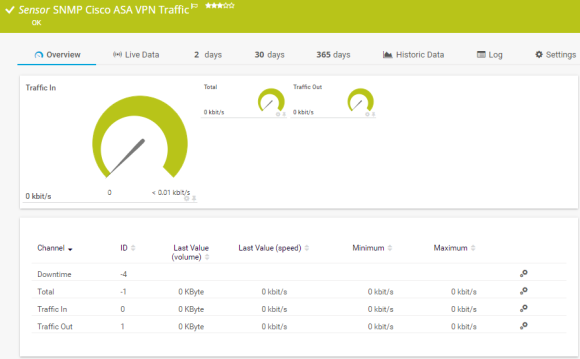
The SNMP Cisco ASA VPN Traffic sensor monitors the traffic of an Internet Protocol Security (IPsec) VPN connection on a Cisco Adaptive Security Appliance. It can show the following:
See the PRTG Manual for a list of all available sensor types.

Custom alerts and data visualization let you quickly identify and prevent slow connection speeds, overloaded servers, and other network performance problems.
PRTG is set up in a matter of minutes and can be used on a wide variety of mobile devices.


“Excellent tool for detailed monitoring. Alarms and notifications work greatly. Equipment addition is straight forward and server initial setup is very easy. ...feel safe to purchase it if you intend to monitor a large networking landscape.”
Partnering with innovative IT vendors, Paessler unleashes synergies to create
new and additional benefits for joined customers.
IT that works constitutes a business-critical basis for a company's success. Availability and security must be defined for the respective purpose and closely monitored – by OT and IT alike.

Combining their tools to a powerful solution for advanced analysis and automation, KnowledgeRiver and Paessler enable IT teams to ensure best performance for their infrastructure and networks.

Siemon and Paessler bring together intelligent building technology and advanced monitoring and make your vision of intelligent buildings and data centers become reality.
Real-time notifications mean faster troubleshooting so that you can act before more serious issues occur.
Network Monitoring Software – Version 24.4.102.1351 (November 12th, 2024)
Download for Windows and cloud-based version PRTG Hosted Monitor available
English, German, Spanish, French, Portuguese, Dutch, Russian, Japanese, and Simplified Chinese
Network devices, bandwidth, servers, applications, virtual environments, remote systems, IoT, and more
Choose the PRTG Network Monitor subscription that's best for you


A network traffic controller helps you monitor, manage, and optimize the flow of data within your network. Think of it as a police officer directing traffic at a busy intersection. It keeps a constant eye on your IT infrastructure, prioritizing business-critical applications and network resources, preventing congestion, and ensuring traffic keeps flowing smoothly so your colleagues can get on with their jobs.
Three things: it should be easy to use, customizable – that is, you should be able to configure it so it's tailored to your organization's specific needs – and scalable. Bonus points if it can also test bandwidth without crashing your network.
And, not because we're biased, but Paessler PRTG can do all four. With many preconfigured sensors (and the ability to create your own), support for all major protocols – including SNMP, WMI, Windows performance counters, NetFlow, sFlow, IPFIX, and jFlow, SSH, HTTP and HTTPS, FTP, ping, and more – and the ability to monitor unlimited local and remote devices, PRTG can handle both basic and complex, distributed networks with ease. Better still, you can tailor it exactly the way you want it, from the way your monitoring environment looks to individual parameters and alert thresholds. But don't take our word for it. Try it free for 30 days and see for yourself.
PRTG's sensors monitor specific hardware and software parameters that could impact traffic, such as bandwidth, latency, jitter, and quality of service. Once you pick your preferred parameters – these could be specific incidents, such as a congested port, or a threshold value you don't want to cross – PRTG monitors it round the clock and alerts you if there are issues, so you can troubleshoot what's causing it.
SNMP, packet sniffing, and flow protocols are all tools used in network monitoring and traffic analysis, but they serve different purposes and operate in distinct ways. Here's a breakdown:
SNMP
SNMP operates by querying devices to retrieve specific data like CPU load, memory usage, network interfaces status, and traffic statistics. SNMP agents installed on devices respond to these queries from an SNMP manager.
SNMP provides high-level, structured data, but it does not capture individual packets or detailed traffic flows. It is useful for network administrators who want to track performance metrics, detect faults, or configure network devices. For example, it can alert an admin when a router's CPU reaches a critical usage level.
Packet sniffing
Packet sniffing is used to capture and analyze individual packets traveling across a network. A packet sniffer intercepts all network traffic, or traffic to/from a specific device, and captures the individual packets for analysis.
Packet sniffing is very detailed, capturing every bit and byte of data on the network. This includes everything from packet headers to actual payloads (which might be encrypted). It is ideal for debugging network issues, troubleshooting, or detecting security incidents. For instance, packet sniffers can help diagnose slow network performance by showing which applications or hosts are consuming the most bandwidth.
Flow protocols (NetFlow, jFlow, sFlow, IPFIX)
Flow protocols are used for network traffic flow monitoring and analysis, providing insights into who is communicating with whom, how much data is being transferred, and which protocols are in use. NetFlow (Cisco), sFlow (sampled Flow), jFlow (Juniper), and IPFIX (IETF) all collect summarized metadata about network traffic, rather than capturing full packets. Flow data includes information like source/destination IPs, ports, protocol types, packet counts, and timestamps.
Flow protocols provide summarized information about traffic patterns, rather than full packet details. Flow is less granular than packet sniffing but more focused on traffic behavior than SNMP. Flow protocols are excellent for long-term traffic analysis, capacity planning, and detecting network anomalies like DDoS attacks or unusual traffic patterns. For example, NetFlow can reveal if a particular IP is sending a massive amount of data to multiple destinations (indicating a possible security breach).
In PRTG, “sensors” are the basic monitoring elements. One sensor usually monitors one measured value in your network, for example the traffic of a switch port, the CPU load of a server, or the free space on a disk drive. On average, you need about 5-10 sensors per device or one sensor per switch port.
Paessler conducted trials in over 600 IT departments worldwide to tune its network monitoring software closer to the needs of sysadmins. The result of the survey: over 95% of the participants would recommend PRTG – or already have.

Paessler PRTG is used by companies of all sizes. Sysadmins love PRTG because it makes their job a whole lot easier.
Bandwidth, servers, virtual environments, websites, VoIP services – PRTG keeps an eye on your entire network.
Everyone has different monitoring needs. That’s why we let you try PRTG for free.