![]()
Nutanix monitoring with PRTG
Boost the performance of your Nutanix hyperconverged infrastructure
- Keep a constant eye on Nutanix clusters and hypervisors
- Ensure optimal performance of your Nutanix HCI
- Receive customizable alerts and notifications in real time
Our users give top ratings for monitoring with Paessler PRTG


PRTG Nutanix monitoring: What you’ll find on this page

- Why Nutanix monitoring with PRTG is important
- 3 benefits of PRTG Nutanix performance monitoring
- What Nutanix monitoring looks like in PRTG
- 3 more reasons why to choose PRTG as your Nutanix monitoring tool
- Explore our preconfigured PRTG sensors for Nutanix monitoring
- Monitor Nutanix infrastructure: FAQ
Why Nutanix monitoring with PRTG is important
Hyperconverged infrastructure (HCI) is extremely complex. If just one of its components malfunctions, the entire system can become paralyzed and the hyperconverged environment can go offline.
But how do you keep an eye on such versatile virtual infrastructure?
Paessler PRTG can monitor your entire Nutanix HCI, including virtual storage, computer, and network units. Use our all-in-one network monitoring software to also ensure the optimal performance of your Nutanix environment.
PRTG makes Nutanix monitoring as easy as it gets
Custom alerts and data visualization let you quickly identify and prevent Nutanix performance issues.
3 benefits of PRTG Nutanix performance monitoring
Check I/O operations of clusters
In HCI environments, storage components are usually responsible for the biggest drops in performance. That’s why PRTG also constantly checks the IOPs performance data of your Nutanix clusters, including bandwidth and latency, as well as the number of I/O commands per second.
Keep a constant eye on hypervisors
Of course, your Nutanix hypervisors also play an important role when analyzing HCI performance data. With PRTG, you can constantly track parameters such as the processor load, individual I/O performance data, packet loss, and the number of active virtual machines (VMs).
What Nutanix monitoring looks like in PRTG
Diagnose network issues by continuously tracking the status and performance of your Nutanix HCI. Show response time, bandwidth usage, latency, packet loss, CPU usage, virtual machine count, and other key performance metrics in real time. Visualize monitoring data in clear graphs and dashboards to identify problems more easily. Gain the overview you need to troubleshoot issues with your Nutanix clusters and hypervisors.

Device tree view of the complete monitoring setup
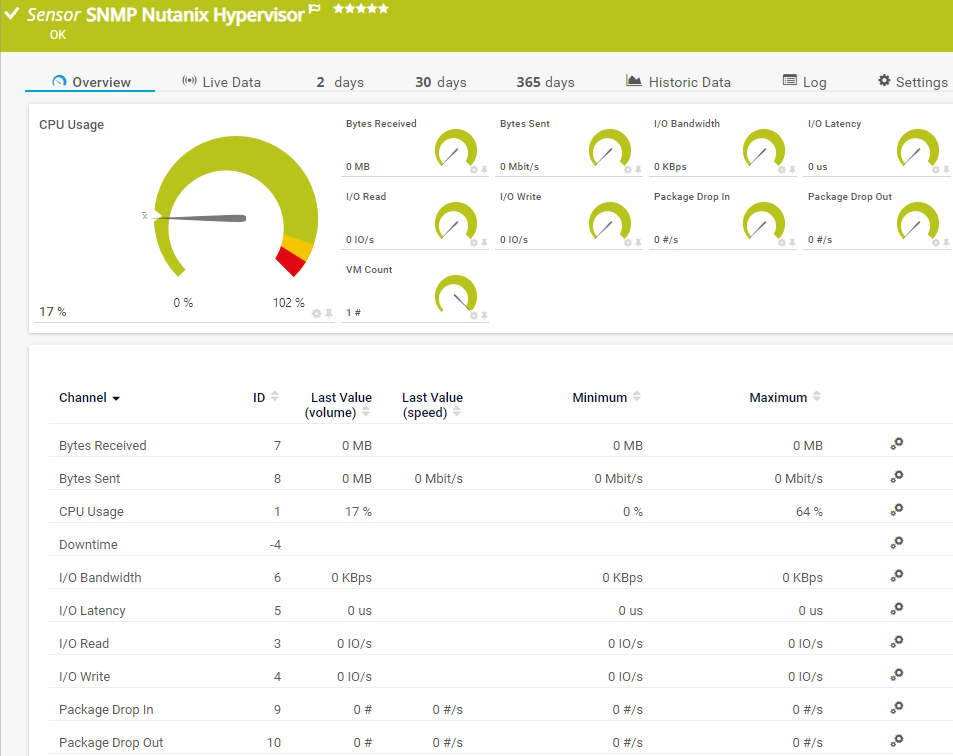
Preconfigured SNMP Nutanix Hypervisor sensor in PRTG

Custom PRTG dashboard for keeping an eye on the entire IT infrastructure
Start monitoring Nutanix virtualization with PRTG and see how it can make your network more reliable and your job easier.
IT experts agree: Paessler PRTG is a great solution for IT infrastructure monitoring

“All-around winning
network monitor”

“The real beauty of PRTG is the endless possibilities it offers”

“PRTG Network Monitor
is very hard to beat”
3 more reasons why to choose PRTG as your Nutanix monitoring tool
Keep an eye on your entire IT stack
PRTG monitors your complete IT infrastructure – no matter if you have an on-premises Windows or Linux, cloud, or hyperconverged environment. Watch Nutanix cluster performance alongside everything else: every PRTG subscription includes all monitoring features.
Customize alerts and notifications
Sit back, relax, and let PRTG do the monitoring and alerting for you. If there is an issue with your Nutanix resources or any other problem in your network, PRTG alerts you immediately via email, SMS, push notification, and other methods – always based on your individual threshold values.
Monitor Nutanix in a single pane of glass
Gone are the days where you have to manually check the status of every Nutanix component. PRTG provides you with a central overview in an easy-to-read dashboard. Or create your own, customized maps and dashboards that show your Nutanix monitoring metrics the way you want.
Find the root cause of the problem with our PRTG Nutanix monitoring solution
Real-time notifications mean faster troubleshooting so that you can act before more serious issues occur.
PRTG is compatible with all major vendors, products, and systems
![]()
Explore our preconfigured PRTG sensors for Nutanix monitoring
PRTG comes with more than 250 native sensor types for monitoring your entire on-premises, cloud, and hybrid cloud environment out of the box. Check out some examples below!
SNMP Nutanix Cluster Health
The SNMP Nutanix Cluster Health sensor monitors the status and the performance of a Nutanix cluster. It can show the following:
- Bandwidth and latency of I/O operations
- Number of I/O operations
- Nutanix cluster status
SNMP Nutanix Hypervisor
The SNMP Nutanix Hypervisor sensor monitors a Nutanix hypervisor. It can show the following:
- Number of bytes sent and received
- CPU usage
- Bandwidth, latency, and read and write speed of I/O operations
- Number of dropped incoming and outgoing packages
- Number of VMs
Your Nutanix monitor at a glance – even on the go
Set up PRTG in minutes and use it on almost any mobile device.


Create innovative solutions with Paessler’s partners
Partnering with innovative vendors, Paessler unleashes synergies to create
new and additional benefits for joined customers.


KnowledgeRiver
Combining their tools to a powerful solution for advanced analysis and automation, KnowledgeRiver and Paessler enable IT teams to ensure best performance for their infrastructure and networks.
“Excellent tool for detailed monitoring. Alarms and notifications work greatly. Equipment addition is straight forward and server initial setup is very easy. ...feel safe to purchase it if you intend to monitor a large networking landscape.”
Infrastructure and Operations Engineer in the Communications Industry, firm size 10B - 30B USD
PRTG makes Nutanix monitoring as easy as it gets
Custom alerts and data visualization let you quickly identify and prevent Nutanix performance issues.

PRTG: The multi-tool for sysadmins
Adapt PRTG individually and dynamically to your needs and rely on a strong API:- HTTP API: Access monitoring data and manipulate monitoring objects via HTTP requests
- Custom sensors: Create your own PRTG sensors for customized monitoring
- Custom notifications: Create your own notifications and send action triggers to external systems
- REST Custom sensor: Monitor almost everything that provides data in XML or JSON format
We asked: would you recommend PRTG?
Over 95% of our customers say yes!
Paessler conducted trials in over 600 IT departments worldwide to tune its network monitoring software closer to the needs of sysadmins.
The result of the survey: over 95% of the participants would recommend PRTG – or already have.

Still not convinced?
![]()
More than 500,000
sysadmins love PRTG
Paessler PRTG is used by companies of all sizes. Sysadmins love PRTG because it makes their job a whole lot easier.
![]()
Monitor your entire IT infrastructure
Bandwidth, servers, virtual environments, websites, VoIP services – PRTG keeps an eye on your entire network.
![]()
Try Paessler PRTG
for free
Everyone has different monitoring needs. That’s why we let you try PRTG for free.
![]()
Start monitoring Nutanix virtualization with PRTG and see how it can make your network more reliable and your job easier.
|
PRTG |
Network Monitoring Software - Version 25.1.104.1961 (April 7th, 2025) |
|
Hosting |
Download for Windows and cloud-based version PRTG Hosted Monitor available |
Languages |
English, German, Spanish, French, Portuguese, Dutch, Russian, Japanese, and Simplified Chinese |
Pricing |
Up to 100 sensors for free (Price List) |
Unified Monitoring |
Network devices, bandwidth, servers, applications, virtual environments, remote systems, IoT, and more |
Supported Vendors & Applications |
|
Discover more monitoring insights and stories

Solutions for all your monitoring needs

Powerful stories from the monitoring world

Combining the broad monitoring feature set of PRTG with IP Fabric’s automated network assurance creates a new level of network visibility and reliability.