The complete solution for server & host monitoring
PRTG technical server monitoring details
Need general info about servers? Check out our comprehensive IT Explained page
PRTG makes server monitoring as easy as it gets
Custom alerts and data visualization let you quickly identify and prevent server performance issues.
3 reasons to choose PRTG as your server monitoring tool
Integrated monitoring solution
Paessler PRTG monitors your entire infrastructure & servers, including processors, memory, CPU usage, cooling fans, power supplies, and more.
- Adapts dynamically to the size of your server landscape
- Quickly recognizes if a router or switch fails & causes a disruption
- Virtual servers are automatically discovered & monitored
Custom alerts via email, SMS and more
PRTG alerts ensure that system failures are only short-lived or even prevented.
- Email, SMS, push notifications, and more alert you faster if complications arise
- Locate errors directly to save time
- Customize alert threshold values to be notified before an issue leads to a crash
Better future capacity planning
PRTG simplifies capacity planning to save you time and money.
- Recognize the need to increase capacity sooner
- Detailed reports for scheduling and process optimization
- Dashboards & maps help win over the management
The benefits of PRTG server monitoring
Get real-time updates
Server monitoring lets you monitor your servers in real time with regard to availability, accessibility, capacity, and overall reliability.
- Status constantly updated
- Check server status any time
Improve stability
Sysadmins monitor their servers because they wish to improve the network performance and stability.
- Set custom thresholds
- Get real-time alerts
- Complete your everyday tasks
- Have a constant overview of resources
Analyze & optimize
Sysadmins analyze the values they receive from their monitoring software to develop courses of action.
- Data-based optimization
- Capacity planning
- Custom PRTG reports
Start server monitoring with PRTG and see how it can make your network more reliable and your job easier.
What server monitoring looks like in PRTG
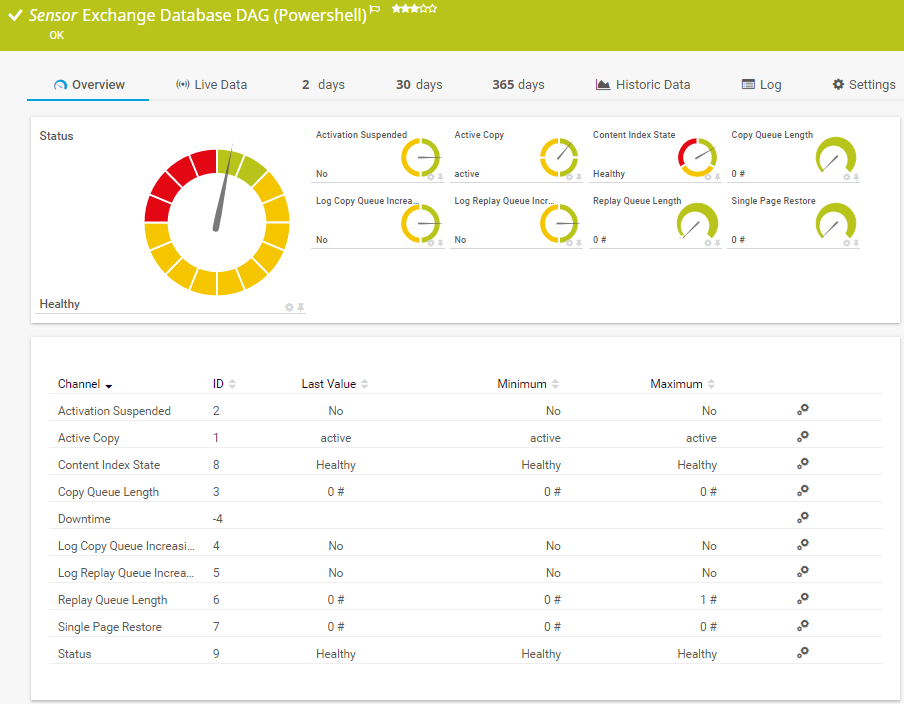
Diagnose network issues by continuously tracking all your servers and hosts. Show server health and status in real time. Visualize monitoring data in clear graphs and dashboards to identify problems more easily. Gain the overview you need to troubleshoot server issues and prevent problems.
Server types monitored by PRTG
PRTG monitors all types of servers – even in distributed networks. Here are a few examples of the kinds of servers for which PRTG provides predefined sensors so that you can start monitoring servers immediately.
Mail server monitoring
Mail servers pose sensitive issues. When mail server glitches occur, employees are quick to complain, putting the support department under intense strain. With PRTG, you can monitor your mail servers round the clock and be alerted in a timely fashion. IMAP, POP3, SMTP, and more: we supply more than a dozen sensors for your mail server monitoring.
Web server monitoring
Website performance can determine the fate of many companies. Downtime is costly from the very first moment. That’s why PRTG also makes a whole range of sensors available for your web server monitoring (IIS, Apache, and more).
Database server monitoring
Most departments live & die by database performance. PRTG offers a variety of sensors for immediate use for the monitoring of MySQL, Microsoft SQL, or Oracle SQL. Choose HTTP content or perform database queries for your SQL server monitoring.
File server monitoring
Administrators must ensure that the file server runs smoothly, so it’s common for them to search for a specific FTP server monitoring tool. But PRTG has you covered with around 20 preconfigured sensors for file server monitoring, including NAS devices and storage area networks (SAN).
Virtual server monitoring
In many companies, virtual servers are already a part of the IT structure. And for good reason: memory, hard disk space, and computing power can be allocated to individual applications dynamically. Resources are thus used in a considerably more efficient manner. PRTG monitors your virtual servers, right down to the very last detail.
Cloud server monitoring
Cloud server monitoring ensures that your cloud-based services, including SaaS applications, maintain optimal performance and uptime. With PRTG, you can monitor the uptime and performance of your cloud servers in real-time. Graphs and statistics visualize server metrics and identify potential issues before they affect your users.
Unlimited server monitoring
With PRTG, you get several other predefined sensors which provide an overview of your entire server landscape. Create custom sensors whenever you want, and use the API to adapt PRTG to any special use case.
Virtual server monitoring with PRTG
Complete overview
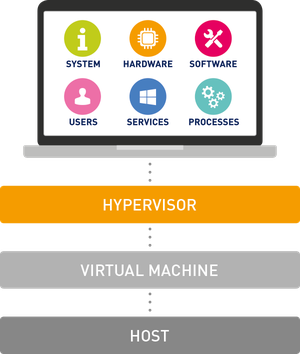
Virtualized servers are complex. Malfunctions at the hardware level also affect virtual machines. PRTG gives you a complete overview at all times as a monitoring solution for your entire virtual environment.
Create a foundation that enables your efficient data structures to run as smoothly as possible – and watch as the improved utilization pays off.
Custom fit
PRTG is one of the server monitor tools that can monitor almost any virtual infrastructure including Microsoft Hyper-V, Citrix XenServer, Nutanix, VMware, and more.
As a VMware technology partner, our server monitoring tool offers predefined PRTG VMware sensors for different purposes as well as sensors for many other vendors.
Great flexibility
PRTG is fast and easy to upgrade and adapts to your growth dynamically. New sensors can be easily applied in minutes, reducing your time and effort in managing your server monitoring solution. This is particularly important since virtual servers are often introduced when a company is in the midst of vigorous growth.
Host monitoring
In virtual environments in particular, it's vital to monitor all your hosts. Host monitoring with PRTG allows you to constantly keep track of the availability and performance of your host (CPU, memory usage, and other performance metrics). Especially if multiple VMs are running on one host, it's absolutely crucial to ensure a proper allocation of resources. Host monitoring can also be important for web servers.
Find the root cause of the problem with our PRTG server monitoring solution
Real-time notifications mean faster troubleshooting so that you can act before more serious issues occur.
Your server monitor at a glance – even on the go
Set up PRTG in minutes and use it on almost any mobile device.


Create innovative solutions with Paessler’s partners
Partnering with innovative vendors, Paessler unleashes synergies to create
new and additional benefits for joined customers.
ScriptRunner
With ScriptRunner, Paessler integrates a powerful event automation platform into PRTG Network Monitor.
UVexplorer integrates tightly with PRTG to bring fast and accurate network discovery, detailed device inventory, and automatic network mapping to the PRTG platform.
UVnetworks
Try our Multi Server Simulator
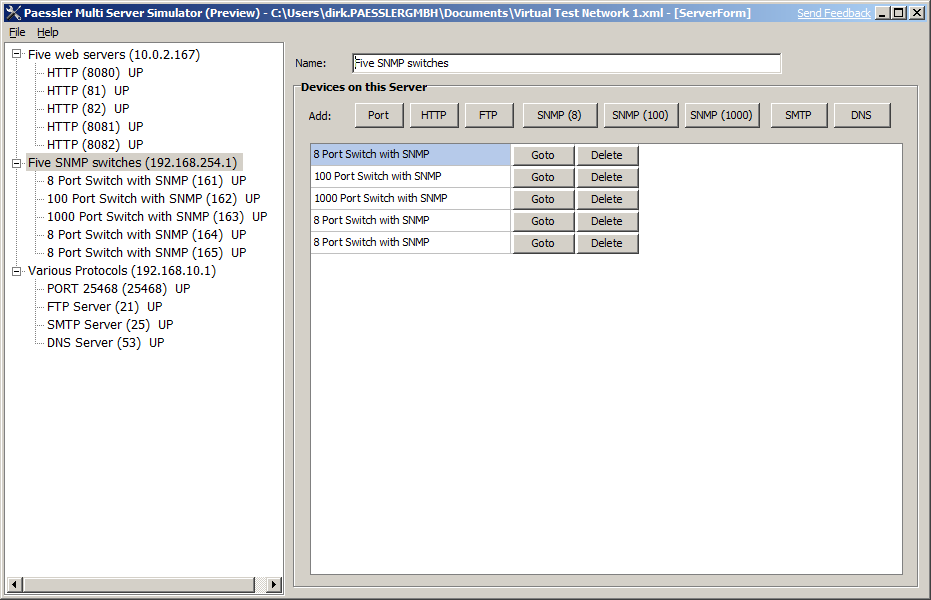
Now you can test the behavior of your network before setting up a collection of new servers. It's easy with our Multi Server Simulator. See how your network reacts – and which areas need some work.
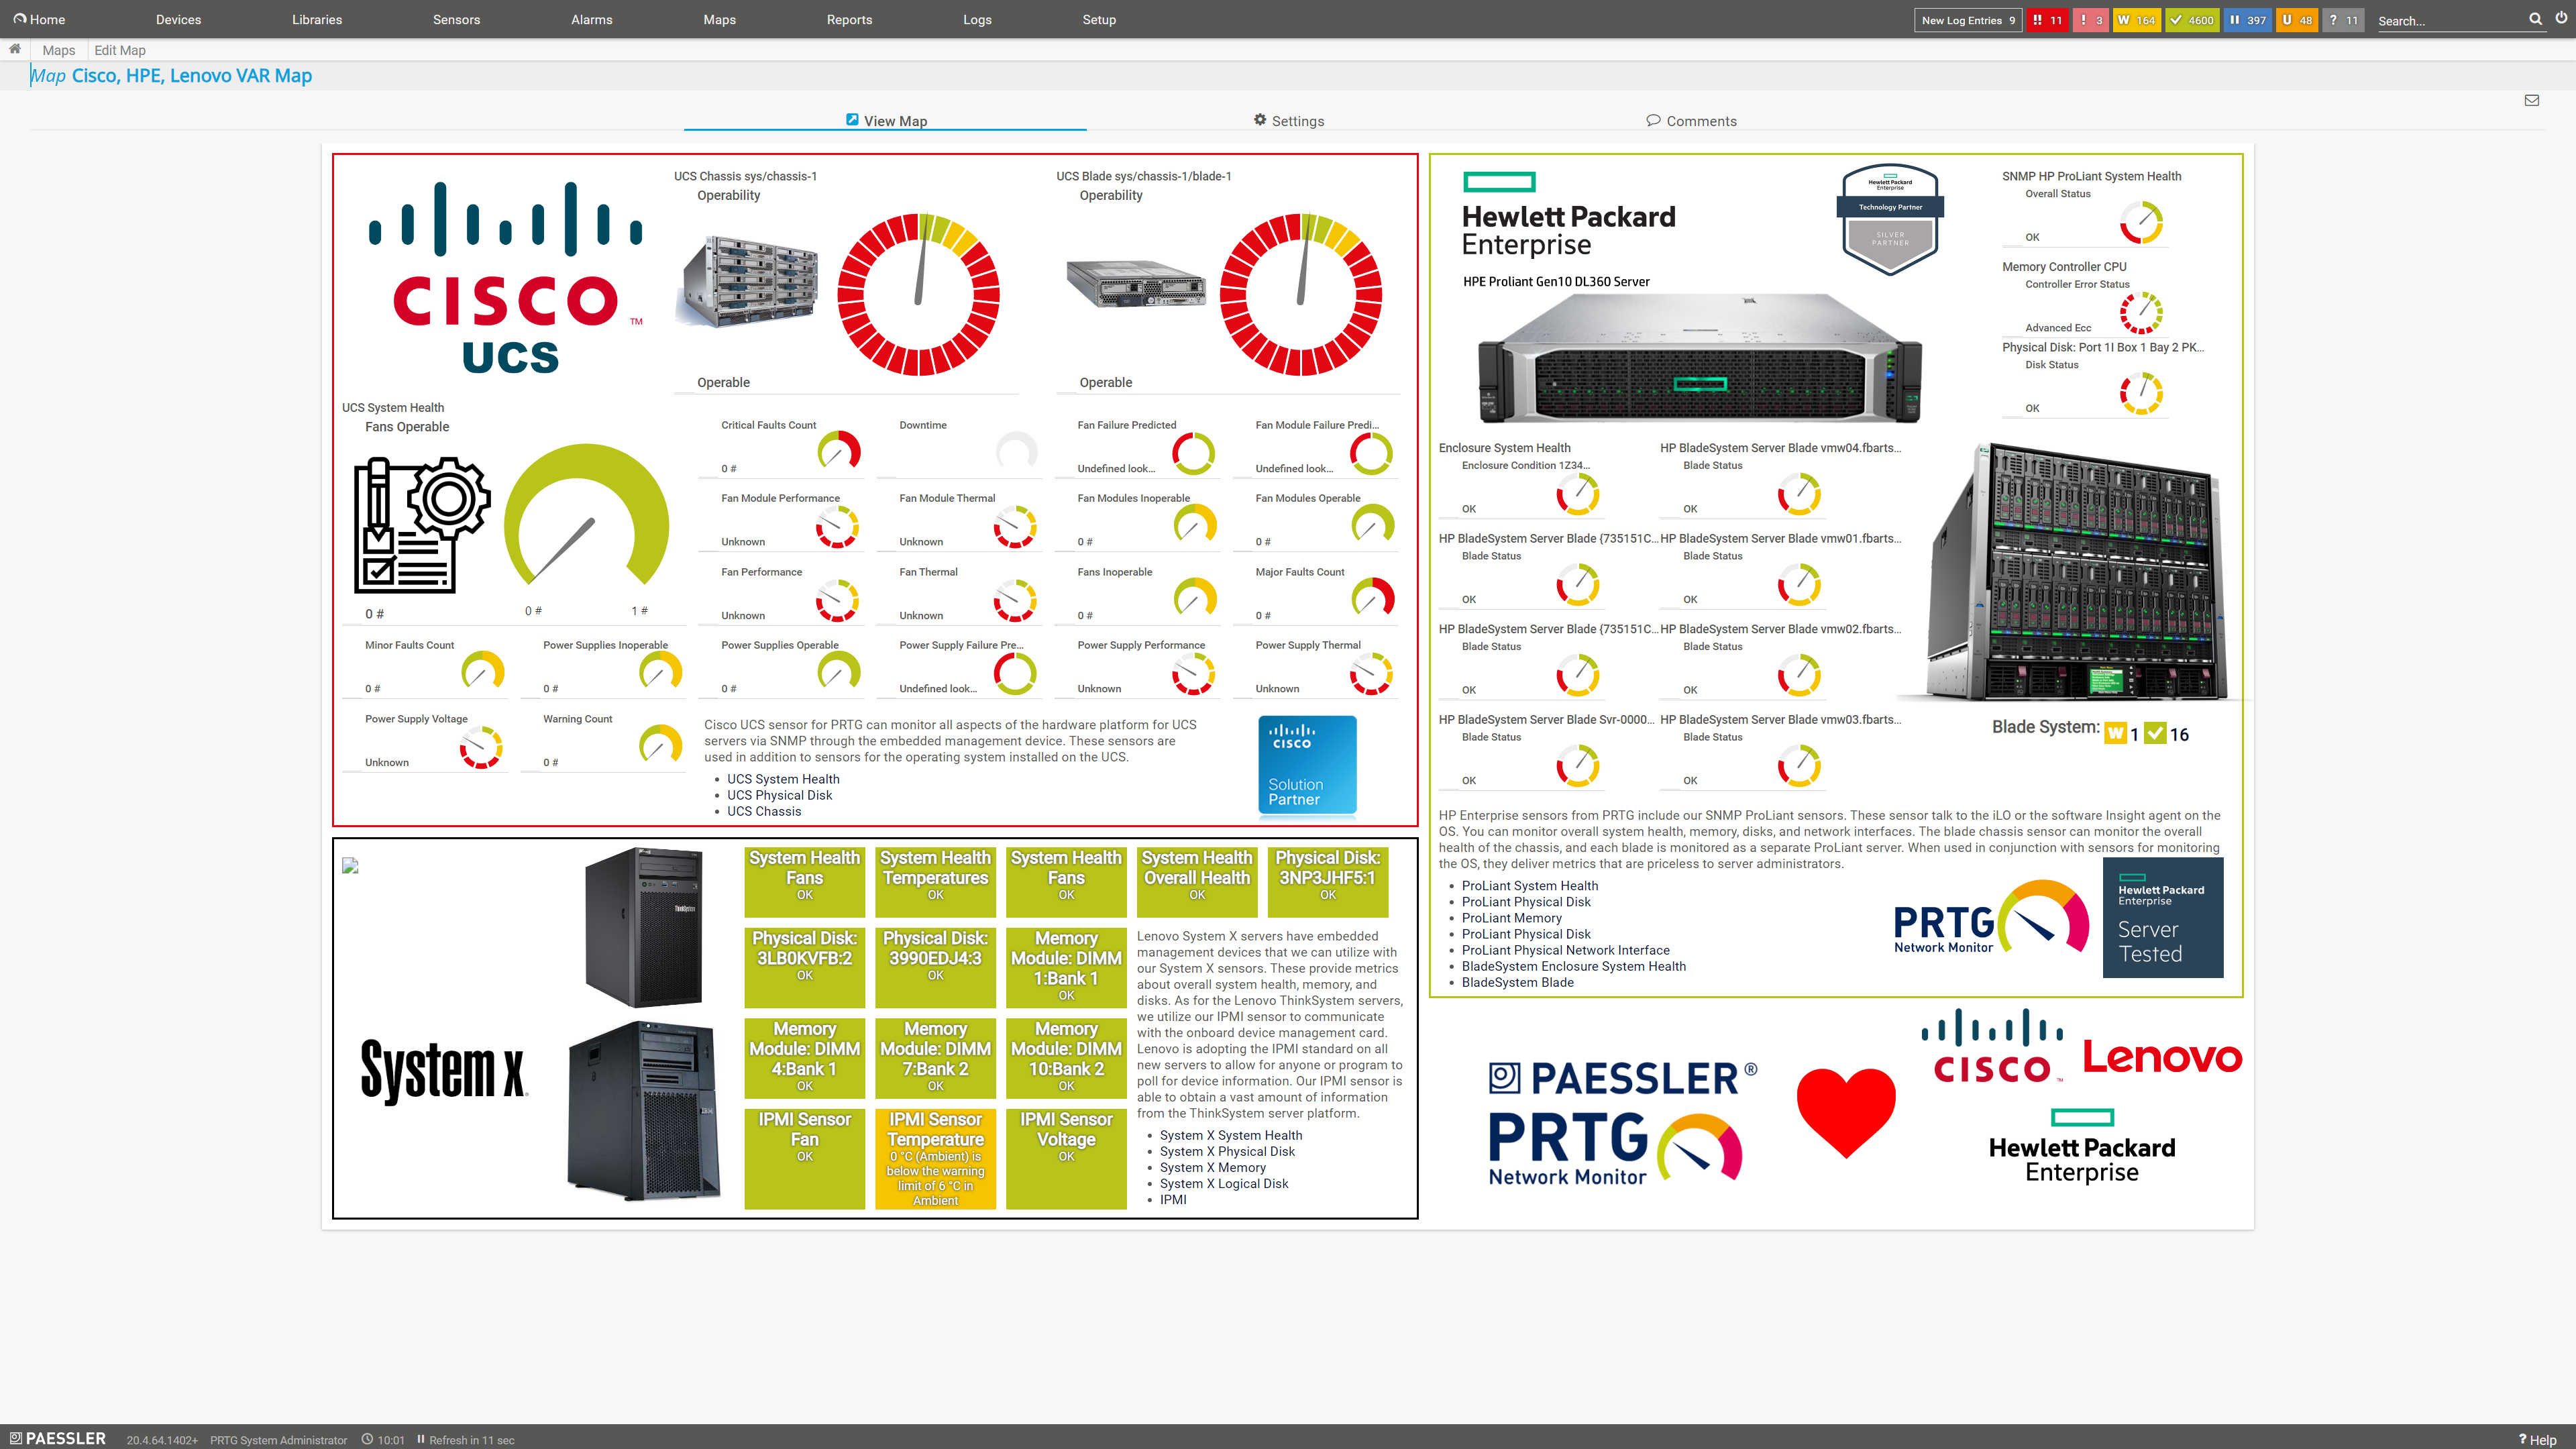
Predefined sensors for server products
PRTG includes predefined sensors for server computers of different vendors.
| Vendor | PRTG sensors for server monitoring |
 |
|
| |
|
 |
|
| |
|
| AND MANY MORE |
PRTG is compatible with all major vendors & manufacturers
PRTG makes server monitoring as easy as it gets
Custom alerts and data visualization let you quickly identify and prevent server issues.
LDAP monitoring with PRTG
LDAP at a glance
Lightweight Directory Access Protocol (LDAP) is a protocol that queries information from ditributed directory services. Directories contain object-related data which monitoring tools like PRTG that support LDAP monitoring can read. One such directory is Active Directory, the Microsoft service created for use in a Windows Server environment.
Getting started with LDAP monitoring
PRTG comes with a preconfigured LDAP sensor out of the box. This sensor connects to the LDAP server using distinguished name (DN) authentication, and displays the response time of your LDAP server if both connection attempt and authentication are successful.

„Hey Arne, how do I avoid false alarms during server maintenance?“
“In practice, repairs in the short-term will be necessary. While working, your monitoring will not trigger false alarms. The one-time maintenance window allows you to pause monitoring for each individual device or device group. For regular maintenance, with PRTG you can easily create an automated schedule.”
Arne Seifert, technical support at Paessler
HTTP server error messages
Common server errors
All status codes that begin with “5” (5XX) are server errors – and therefore a problem. Server error 500 is a collective status code for unexpected server errors. All other server errors (501, 502, 503, etc.) are used to flag specific problems.
Error 503, for example, means that the website’s web server is currently overloaded or unavailable. For more information, see our Knowledge Base articles about HTTP status codes and HTTP response codes.
Web server monitoring
Error messages are clear evidence that web server monitoring makes sense. All the more so if the website is an important tool for the company. PRTG comes with a full range of HTTP sensors for monitoring websites as well as individual URLs.
Start server monitoring with PRTG and see how it can make your network more reliable and your job easier.
Video: Why PRTG server monitoring is important
We'll make you a monitoring expert
Gain practical knowledge on how to monitor your infrastructure with Paessler PRTG. Our training sessions are planned and provided by Paessler system engineers and are suitable for different experience levels.
PRTG makes your job easier
Our monitoring software frees you to focus on other tasks by promptly notifying you of potential issues.
Save effort
PRTG gives you one central monitoring tool for your servers and entire network. Enjoy a quick overview of your whole infrastructure via our dashboard and app.
Save time
Getting started with PRTG is a breeze. Setting up or switching from another network monitoring tool is easy thanks to the auto-discovery and pre-configured device templates.
Save money
80% of our customers report substantial cost savings with network monitoring. Your costs of licenses will likely pay for themselves within weeks.
Easy setup, try PRTG for free today
Custom alerts and data visualization make it easy to monitor, identify, and prevent server issues.
Learn about Redfish sensors
From PRTG 21.3.70 on, we released our first Redfish sensors.
With Redfish sensors, you can monitor server hardware in the datacenter using the Redfish protocol from the servers' management controllers like Lenovo XClarity, HPE iLO, or Dell iDrac. Redfish is the successor of IPMI and provides better security.
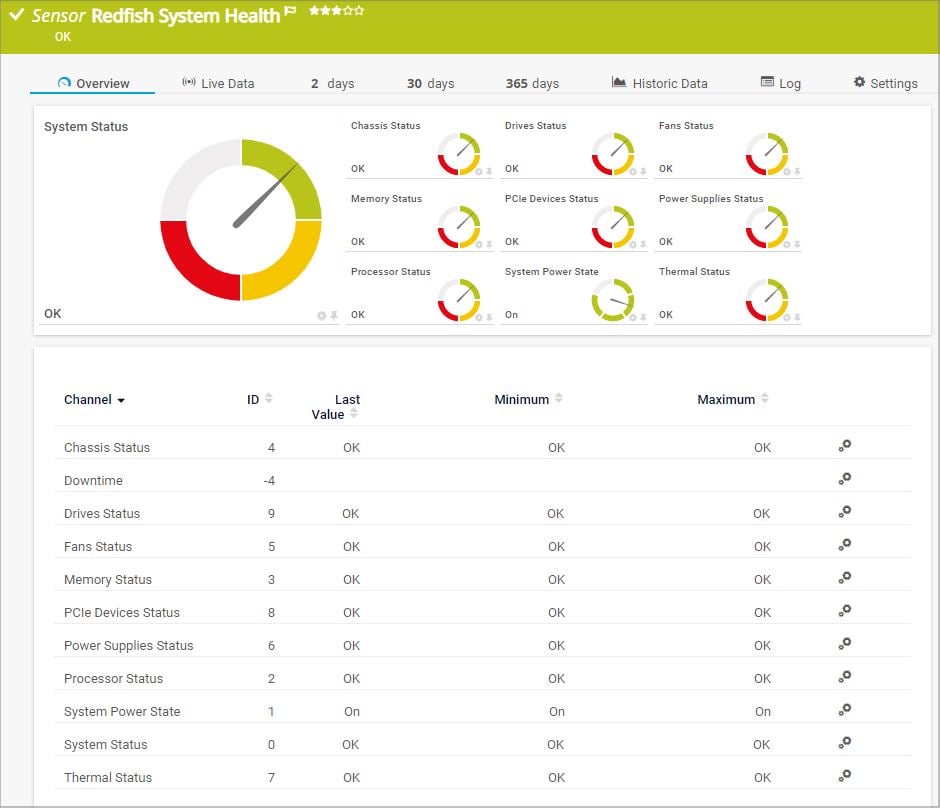
Redfish System Health sensor
This sensor monitors the overall system status and the status of various components such as power supplies or PCIe devices, if available.
Redfish Virtual Disk sensor
This sensor monitors the virtual disk of a Redfish Scalable Platforms Management API (Redfish)-capable server.
Redfish Power Supply sensor
This sensor monitors the power supply of a Redfish Scalable Platforms Management API (Redfish)-capable server.
Still not convinced?
More than 500,000
sysadmins love PRTG
Paessler PRTG is used by companies of all sizes. Sysadmins love PRTG because it makes their job a whole lot easier.
Monitor your entire IT infrastructure
Bandwidth, servers, virtual environments, websites, VoIP services – PRTG keeps an eye on your entire network.
Start server monitoring with PRTG and see how it can make your network more reliable and your job easier.
|
PRTG |
Network Monitoring Software - Version 24.4.102.1351 (November 12th, 2024) |
|
Hosting |
Download for Windows and cloud-based version PRTG Hosted Monitor available |
Languages |
English, German, Spanish, French, Portuguese, Dutch, Russian, Japanese, and Simplified Chinese |
Pricing |
Up to 100 sensors for free (Price List) |
Unified Monitoring |
Network devices, bandwidth, servers, applications, virtual environments, remote systems, IoT, and more |
Supported Vendors & Applications |
|
Discover more monitoring insights and stories
Solutions for all your monitoring needs
Powerful stories from the monitoring world
Resources to master your monitoring challenges
Monitor server availability: FAQ
What types of servers can PRTG monitor?
PRTG can monitor various types of servers including web servers, SQL servers, file servers, mail servers, and virtual servers across different platforms such as Windows, Linux, and macOS.
Can PRTG monitor cloud-based servers?
Yes, PRTG can monitor servers hosted on cloud platforms such as Amazon AWS, Microsoft Azure, and Google Cloud. This includes virtual machines, cloud storage, and other cloud services.
Can PRTG predict server failures?
PRTG can help predict server failures by monitoring trends and performance metrics like CPU load, memory usage, and disk space. If these metrics show unusual patterns, it could indicate a potential issue, allowing administrators to intervene before an actual failure occurs.
Does PRTG also provide LDAP monitoring?
Lightweight Directory Access Protocol (LDAP) is a protocol that queries information from ditributed directory services. Directories contain object-related data which monitoring tools like PRTG that support LDAP monitoring can read. One such directory is Active Directory, the Microsoft service created for use in a Windows Server environment.
PRTG comes with a preconfigured LDAP sensor out of the box. This sensor connects to the LDAP server using distinguished name (DN) authentication, and displays the response time of your LDAP server if both connection attempt and authentication are successful.
What is a sensor in PRTG?
In PRTG, “sensors” are the basic monitoring elements. One sensor usually monitors one measured value in your network, for example the traffic of a switch port, the CPU load of a server, or the free space on a disk drive.
On average, you need about 5-10 sensors per device or one sensor per switch port.

