Custom alerts and data visualization let you quickly identify and prevent health and performance issues of Windows-based devices.
Servers. Workstations. Applications. Intranets…
With so much riding on Windows, having in-depth health and performance data at your fingertips is a must (unless you like living dangerously).
With the Microsoft standard WMI, you can easily request information about operating system metrics, Windows process and service status, file system usage, and more, of your entire Windows environment. But manually querying your network via command prompts can be tedious…
Paessler PRTG is designed to make WMI monitoring simple at scale. Our powerful preconfigured WMI sensors work right out of the box, tracking critical stats automatically round the clock, even from remote systems – with an impact on your resources you can easily deal with.

Diagnose network issues by continuously tracking servers, workstations, and other Windows machines, and applications like Microsoft IIS or Exchange. Show bandwidth usage, network traffic by IP address and protocol, CPU load, and other key metrics in real time. Visualize monitoring data in clear graphs and dashboards to identify problems more easily. Gain the overview you need to troubleshoot bottlenecks, underperformance, authentication problems, and other Windows network-related issues.

Live traffic data graph in PRTG

Device tree view of the complete monitoring setup

Custom PRTG dashboard for keeping an eye on the entire IT infrastructure
Live traffic data graph in PRTG
Device tree view of the complete monitoring setup
“All-around winning
network monitor”
“The real beauty of PRTG is the endless possibilities it offers”
“PRTG Network Monitor
is very hard to beat”
PRTG comes with more than 250 native sensor types for monitoring your entire on-premises, cloud, and hybrid cloud environment out of the box. Check out some examples below!
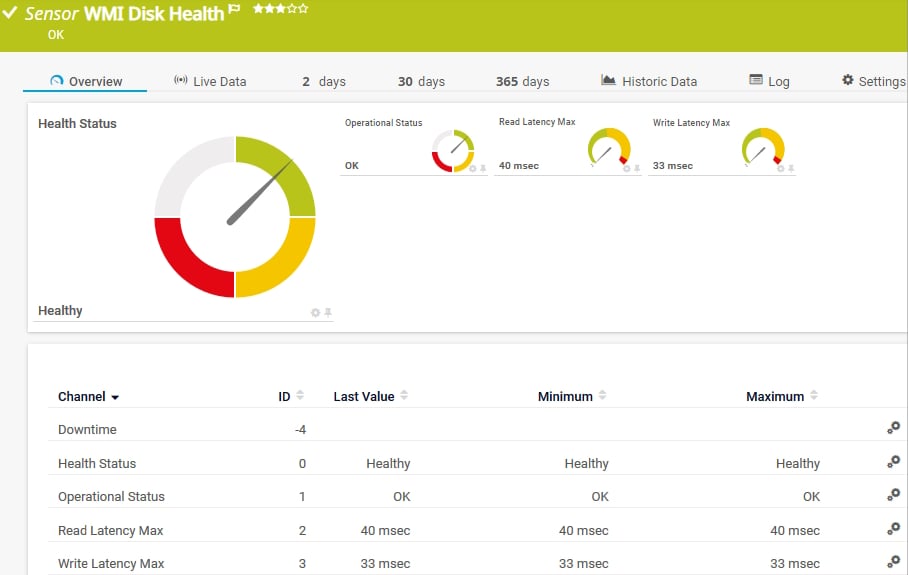
The WMI Disk Health sensor monitors the health of a physical disk on a Windows system. It can show the following:
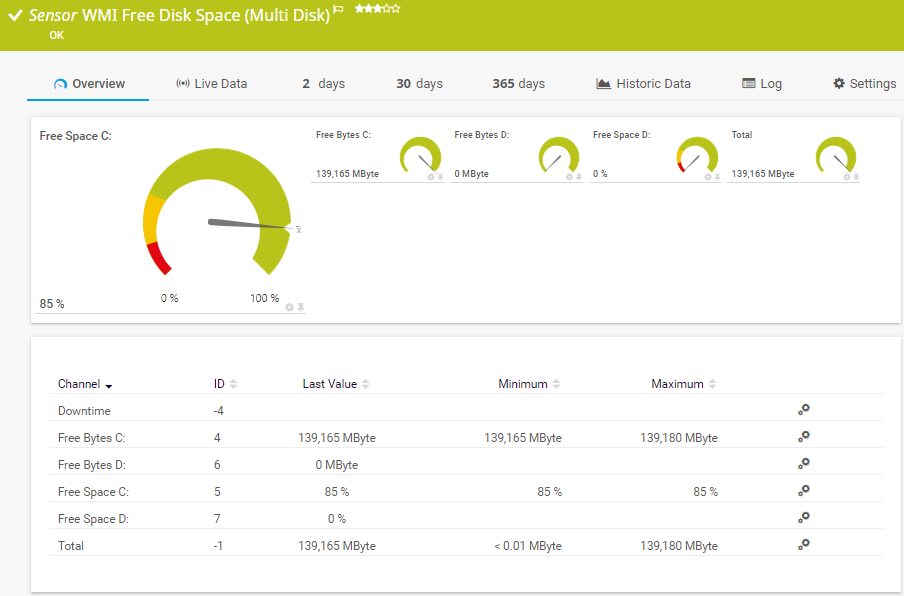
The WMI Free Disk Space (Multi Disk) sensor monitors the free disk space of one or more drives. It can show the following:
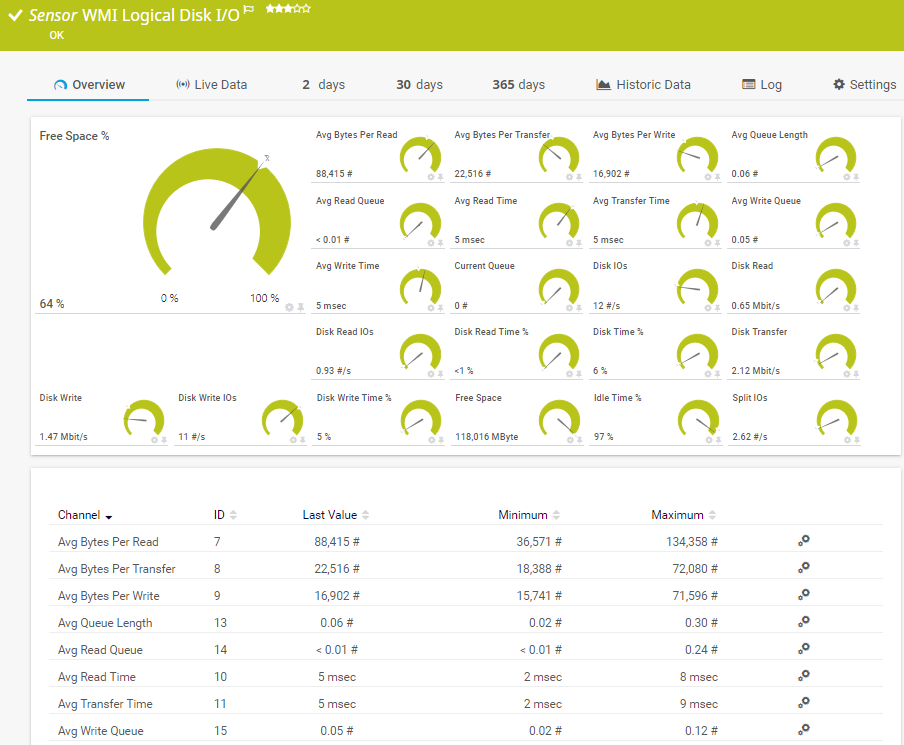
The WMI Logical Disk I/O sensor monitors the disk usage of a logical disk or mount point on a Windows system. It can show the following and more:
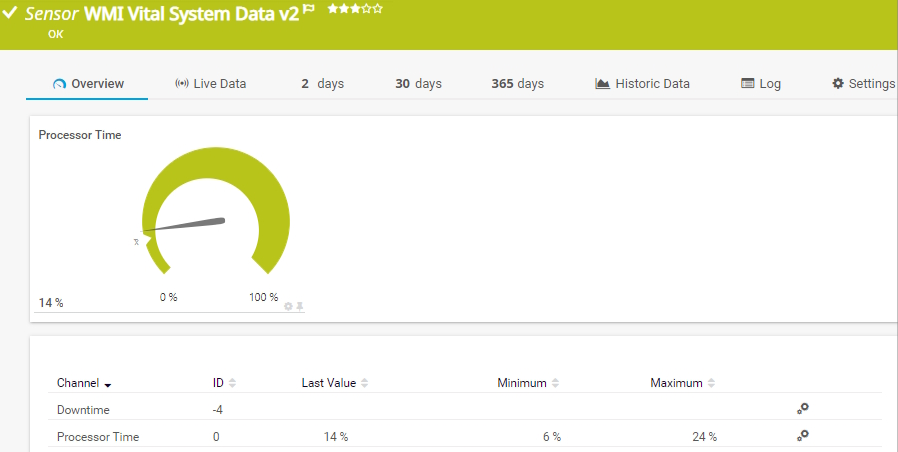
The WMI Vital System Data (V2) sensor monitors vital Windows system parameters. It can show the following:
See the PRTG Manual for a list of all available sensor types.

Custom alerts and data visualization let you quickly identify and prevent health and performance issues of Windows-based devices.
PRTG is set up in a matter of minutes and can be used on a wide variety of mobile devices.


“Excellent tool for detailed monitoring. Alarms and notifications work greatly. Equipment addition is straight forward and server initial setup is very easy. ...feel safe to purchase it if you intend to monitor a large networking landscape.”
Partnering with innovative IT vendors, Paessler unleashes synergies to create
new and additional benefits for joined customers.
IT that works constitutes a business-critical basis for a company's success. Availability and security must be defined for the respective purpose and closely monitored – by OT and IT alike.
Integrating monitoring results from PRTG into NetBrain maps makes the foundation for network automation.

With ScriptRunner Paessler integrates a powerful event automation platform into PRTG Network Monitor.
Real-time notifications mean faster troubleshooting so that you can act before more serious issues occur.
Network Monitoring Software – Version 24.4.102.1351 (November 12th, 2024)
Download for Windows and cloud-based version PRTG Hosted Monitor available
English, German, Spanish, French, Portuguese, Dutch, Russian, Japanese, and Simplified Chinese
Network devices, bandwidth, servers, applications, virtual environments, remote systems, IoT, and more
Choose the PRTG Network Monitor subscription that's best for you


The Windows Management Instrumentation (WMI) is a commonly used Microsoft standard which provides detailed data during a centralized monitoring of Windows workstations and servers. The standard is based on the DCOM (Distributed Component Object Model) communication protocol and has been an integral part of all Windows operating systems since 2000.
WMI – short for Windows Management Instrumentation – is a Microsoft standard that enables sysadmins to access and manage Windows hardware, software, and network components. WMI-monitoring technology like Paessler PRTG enables agentless tracking of Microsoft servers and workstations, giving you a real-time view of their health and performance.
PRTG is designed to work out of the box. That said, your system needs to meet a number of requirements for monitoring using WMI to work properly:
Because WMI can be resource-heavy, we recommend using a maximum of 200 WMI sensors per PRTG server, and a five-minute scanning interval. Alternatively, use hybrid sensors, which request data using Windows performance counters and/or WMI, or SNMP.
Yes, you can – with the Windows Network Card sensor in PRTG, you can monitor data packets, ingoing and outgoing traffic, and filter bandwidth usage by physical network port via WMI. For more light-weight traffic monitoring, we recommend using SNMP, however, which doesn’t put that much strain on your resources.
In PRTG, “sensors” are the basic monitoring elements. One sensor usually monitors one measured value in your network, for example the traffic of a switch port, the CPU load of a server, or the free space on a disk drive. On average, you need about 5-10 sensors per device or one sensor per switch port.
Paessler conducted trials in over 600 IT departments worldwide to tune its network monitoring software closer to the needs of sysadmins. The result of the survey: over 95% of the participants would recommend PRTG – or already have.

Paessler PRTG is used by companies of all sizes. Sysadmins love PRTG because it makes their job a whole lot easier.
Bandwidth, servers, virtual environments, websites, VoIP services – PRTG keeps an eye on your entire network.
Everyone has different monitoring needs. That’s why we let you try PRTG for free.