Custom alerts and data visualization let you quickly identify and prevent Windows network traffic and server performance issues.
Improve security and strive for 100% availability with these benefits.
Diagnose network issues by continuously tracking Microsoft Windows services like IIS, SQL servers, Windows processes, and applications like Active Directory, SharePoint, or Office 365. Show data traffic, bandwidth, memory usage, and other key performance metrics in real time. Visualize monitoring data in clear graphs and dashboards to identify problems more easily. Gain the overview you need to troubleshoot the availability, health, and performance of your entire Windows-based infrastructure.

Live traffic data graph in PRTG

Overview of Windows domain databases in PRTG

Device tree view of the complete monitoring setup

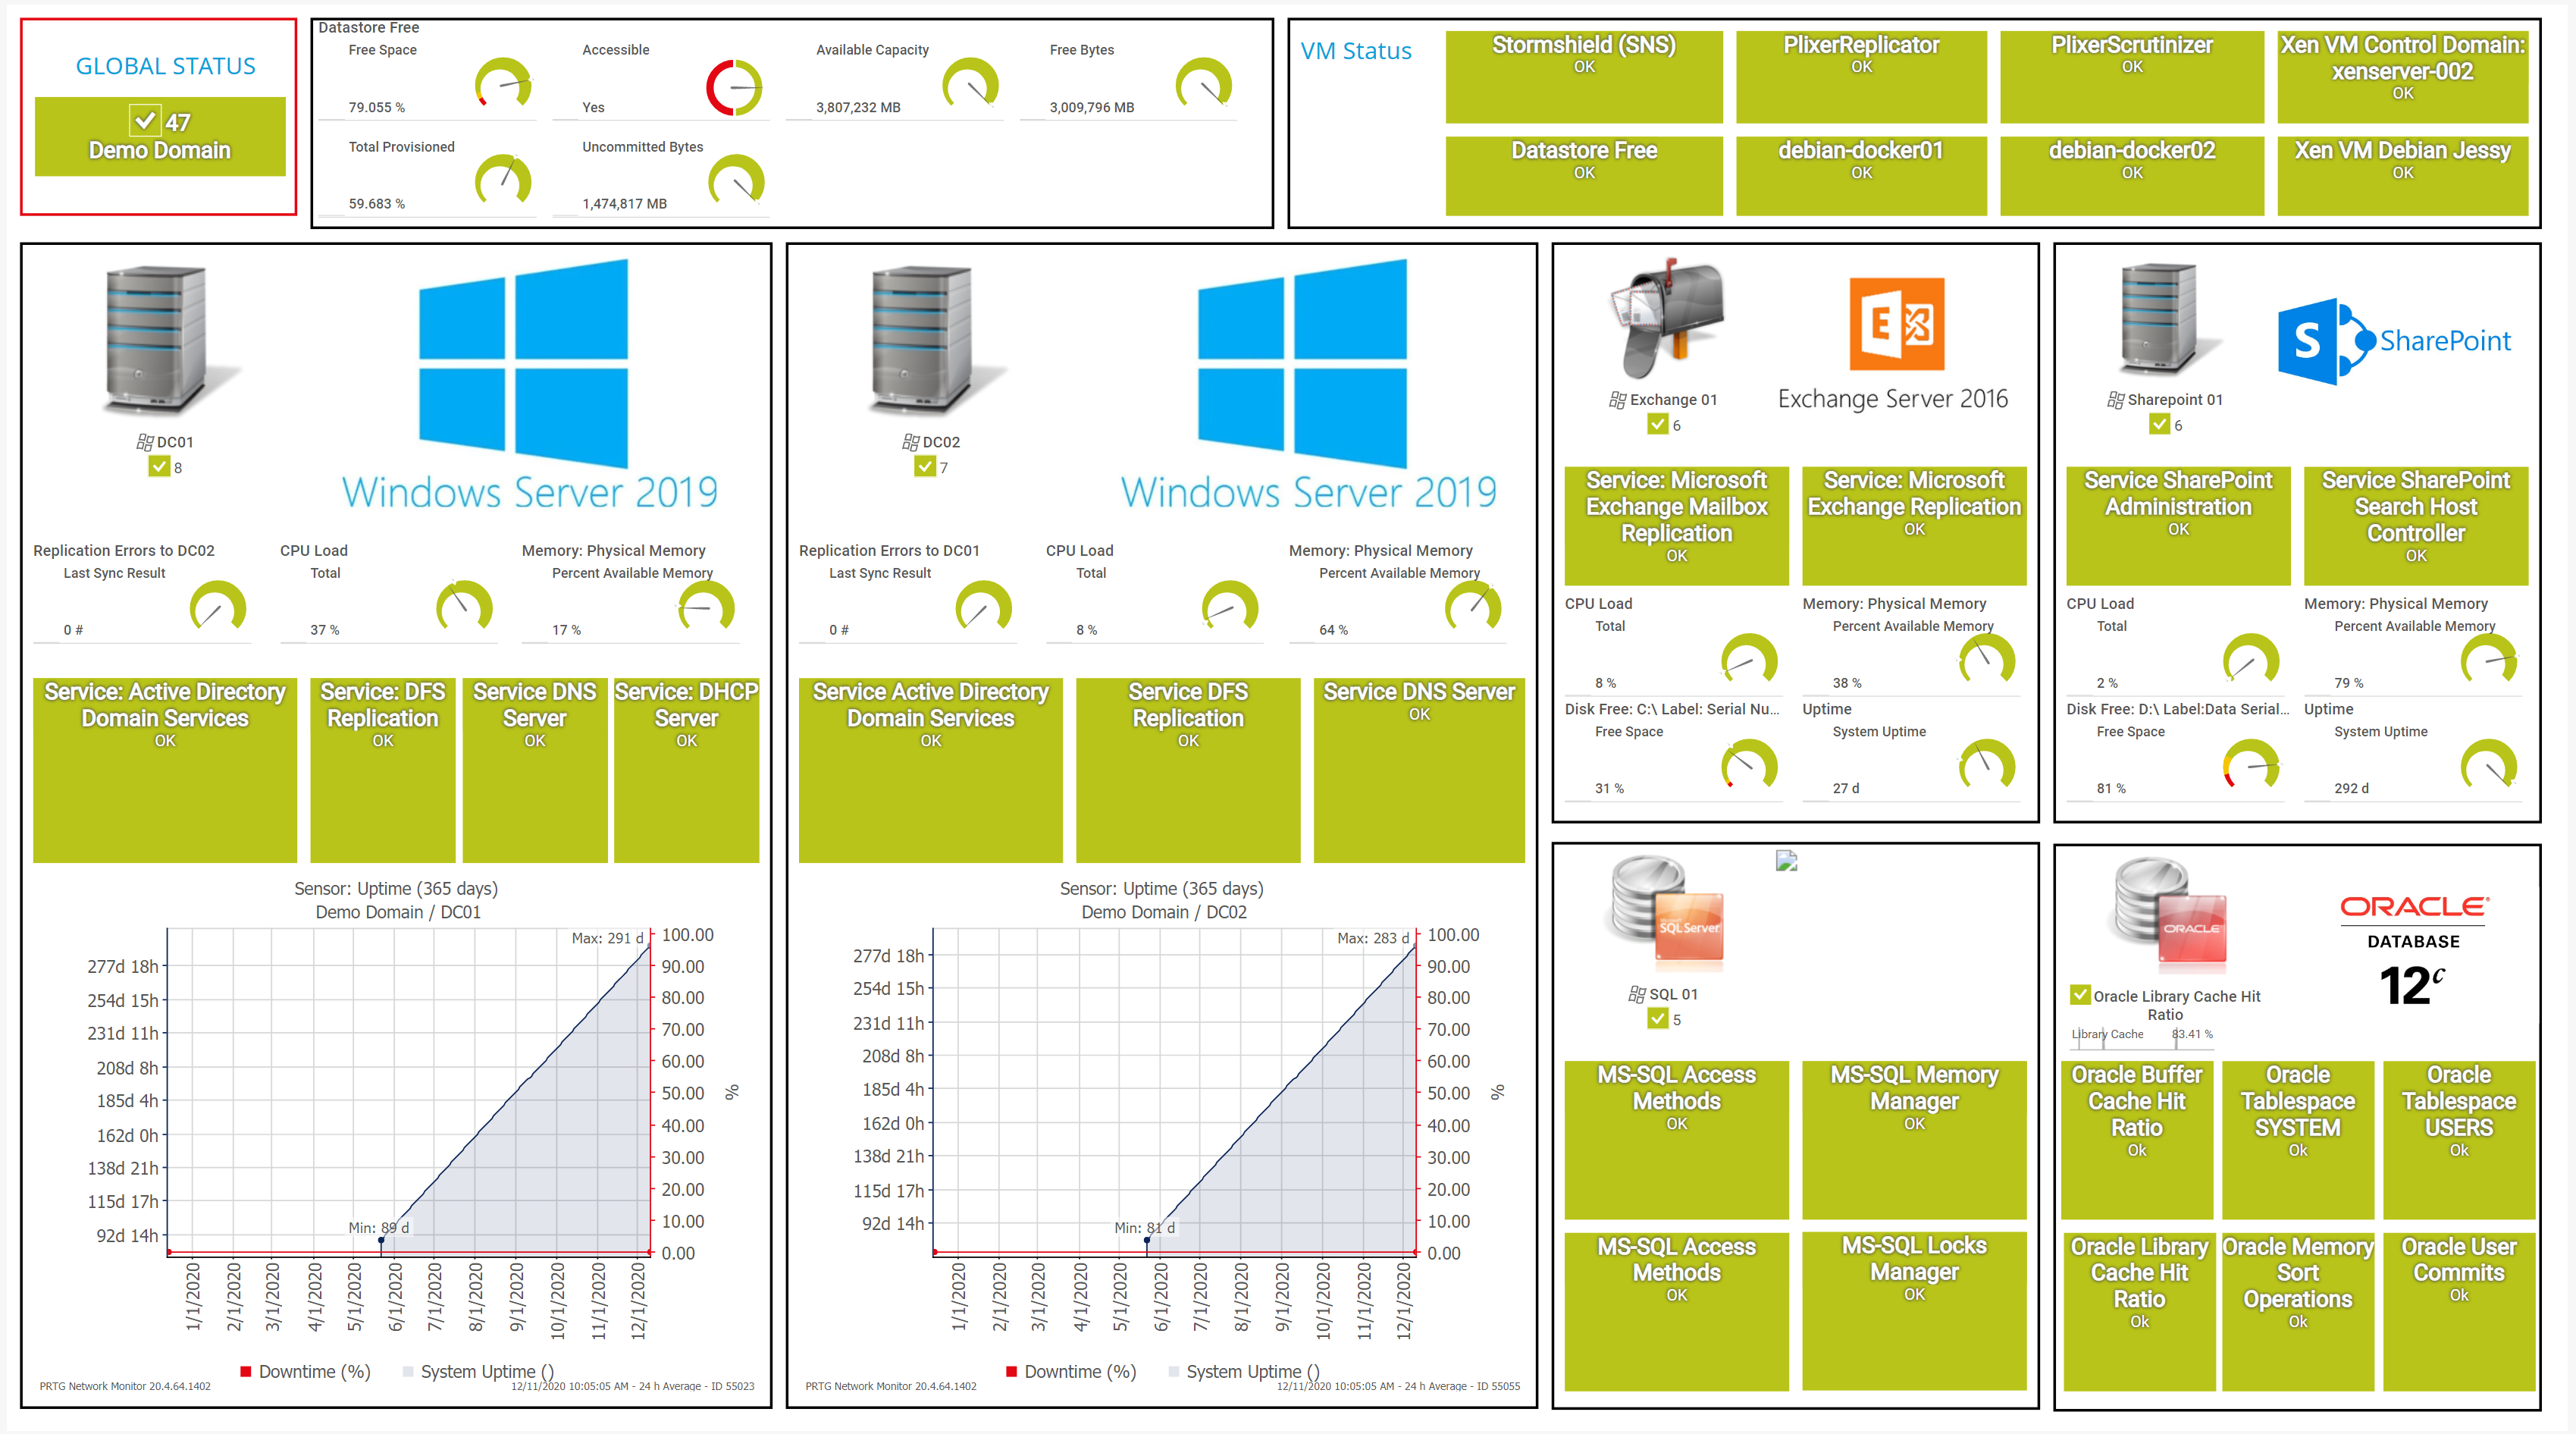
Custom PRTG dashboard for keeping an eye on the entire IT infrastructure

Live traffic data graph in PRTG

Overview of Windows domain databases in PRTG
To execute pending updates in Windows systems, a reboot is usually required. As a result, the computer or server shuts down during the update and then restarts, creating downtime that can lead to applications being unavailable, causing work interruptions and even losses in sales.
Many administrators solve the “update problem” by distributing services across several servers (Windows clustering) to ensure important systems stay available during downtime, which can also occur during other situations besides updates.
PRTG keeps a constant eye on uptime and helps you compile comprehensive statistics. This lets you show your colleagues and higher-ups that you have a firm grip on your network, even during Windows updates.
There are several options for viewing uptime (runtime), such as using the command line. If you enter the command “Systeminfo” into a Windows command-line tool, Windows will display the “System Boot Time,” or the date and time when the system was last rebooted.
Another option is the Task Manager’s “Performance” tab, where the CPU’s “Up Time” is displayed in days, hours, minutes, and seconds. However, these manual checks can become very tedious the larger your infrastructure is.
PRTG provides you with a constant overview of the uptime of your Windows systems. Gone are the days of having to check uptime manually – PRTG automatically displays it on your dashboard. In the event of a malfunction, you will immediately be notified you so you can keep downtime to a minimum.
PRTG is a comprehensive network monitoring tool that covers all your monitoring needs. You get a 24/7 global overview of your entire IT infrastructure. This means you can stop juggling separate specialized tools that offer only isolated solutions and cost precious time.
PRTG offers monitoring solutions which have been tested, refined, and perfected for years. You’ll never again need to continuously program new interfaces – it’s all done already, thanks to our dedicated developer team focused entirely on PRTG.
Our automatic network discovery makes PRTG configuration a breeze. During setup, simply enter an IP address range and PRTG will search for available devices and add predefined sensors. This means you can get started with some initial monitoring the very first time you open the software.
PRTG comes with more than 250 native sensor types for monitoring your entire on-premises, cloud, and hybrid cloud environment out of the box. Check out some examples below!
See the PRTG Manual for a list of all available sensor types.
Custom alerts and data visualization let you quickly identify and prevent Windows network traffic and server performance issues.
PRTG is set up in a matter of minutes and can be used on a wide variety of mobile devices.

Partnering with innovative IT vendors, Paessler unleashes synergies to create
new and additional benefits for joined customers.

Combining PRTG’s broad monitoring feature set with IP Fabric’s automated network assurance creates a new level of network visibility and reliability.

Combining their tools to a powerful solution for advanced analysis and automation, KnowledgeRiver and Paessler enable IT teams to ensure best performance for their infrastructure and networks.

With ScriptRunner Paessler integrates a powerful event automation platform into PRTG Network Monitor.
Network Monitoring Software – Version 24.4.102.1351 (November 12th, 2024)
Download for Windows and cloud-based version PRTG Hosted Monitor available
English, German, Spanish, French, Portuguese, Dutch, Russian, Japanese, and Simplified Chinese
Network devices, bandwidth, servers, applications, virtual environments, remote systems, IoT, and more
Choose the PRTG Network Monitor subscription that's best for you
Windows monitoring refers to the continuous observation and analysis of the performance, health, and activities of a Windows operating system. It involves tracking key metrics such as CPU usage, memory consumption, disk activity, and network traffic to identify potential issues or bottlenecks. This process is crucial for maintaining a reliable and efficient computing environment, as well as the overall stability and security of the Windows environment in both personal and enterprise settings.
Monitoring Windows operating systems is essential for several reasons. Firstly, it helps identify and address performance issues, ensuring optimal system efficiency. Secondly, it enables early detection of potential security threats or unauthorized activities, enhancing overall system security. Thirdly, monitoring assists in capacity planning by tracking resource usage trends and predicting future requirements. Additionally, it aids in troubleshooting and resolving problems promptly, minimizing downtime and optimizing user experience.
PRTG is designed to monitor the following Windows Server versions:
No. With PRTG, you can keep an eye on all kinds of operating systems, including Linux/Unix and macOS.
In PRTG, “sensors” are the basic monitoring elements. One sensor usually monitors one measured value in your network, for example the traffic of a switch port, the CPU load of a server, or the free space on a disk drive. On average, you need about 5-10 sensors per device or one sensor per switch port.
Paessler conducted trials in over 600 IT departments worldwide to tune its network monitoring software closer to the needs of sysadmins. The result of the survey: over 95% of the participants would recommend PRTG – or already have.
Paessler PRTG is used by companies of all sizes. Sysadmins love PRTG because it makes their job a whole lot easier.
Bandwidth, servers, virtual environments, websites, VoIP services – PRTG keeps an eye on your entire network.
Everyone has different monitoring needs. That’s why we let you try PRTG for free.