Custom alerts and data visualization let you quickly identify and prevent network congestion, latency, jitter, and other online connectivity problems.
How much bandwidth speed does your organization need?
If you think what you have is nowhere near enough to maintain optimal network performance, we're here to tell you that’s not necessarily the case.
You can improve download speeds, upload speeds, and have more stable, reliable LAN, WAN, and WiFi connections through optimization. The catch is that, to make effective adjustments, you need to know which hardware and software components on your network are using the most bandwidth, when they’re doing so, and why. Otherwise, you're just going in blind and hoping for the best.
Paessler PRTG's bandwidth meter makes the process quick and painless. Tracking and categorizing bandwidth consumption, alerting you if there are performance issues, and even helping you analyze long-term trends.
That means you can run a faster, more stable network, without having to constantly plead with your higher-ups for more money to throw at the problem.

Setting up and using PRTG's bandwidth meter couldn't be simpler if you tried. The automatic network discovery adds every device and application within your chosen IP range and assigns the appropriate sensors. And the interface feels instantly familiar, with data displayed in easy-to-understand charts and graphs.
Much more than an internet speed test. PRTG gives you a complete picture of network traffic and the amount of bandwidth used. Preconfigured sensors monitor processes, applications, and the performance of your network devices, making troubleshooting bottlenecks and optimizing network performance a breeze.
Optimizing bandwidth and ensuring a high-speed network is easy… when you have the right data. PRTG tracks usage across your network in real time, so you can make adjustments and optimize performance on the fly. Plus, you'll get automatically alerted the second your network's at risk of exceeding capacity.
PRTG’s bandwidth meter gives you an in-depth view of usage peaks and throughs, as well as other issues that might be impacting internet connection speed, throughput, and functionality or performance. And the sooner you spot patterns and trends, the better you can plan for future bandwidth requirements
Diagnose network issues by continuously tracking bandwidth usage on modems, routers, switches, servers, and other connected hardware in your ethernet or wireless network. Show packet loss, latency, jitter, network traffic by IP address or protocol, and other key metrics in real time. Visualize monitoring data in clear graphs and dashboards to identify problems more easily. Gain the overview you need to troubleshoot bandwidth bottlenecks and network congestion.

Live traffic data graph in PRTG

Device tree view of the complete monitoring setup

Custom PRTG dashboard for keeping an eye on the entire IT infrastructure
Live traffic data graph in PRTG
Device tree view of the complete monitoring setup
“All-around winning
network monitor”
“The real beauty of PRTG is the endless possibilities it offers”
“PRTG Network Monitor
is very hard to beat”
PRTG tracks your hardware and software components' bandwidth usage data using a variety of protocols.
Our preconfigured bandwidth monitoring sensors support monitoring via SNMP, WMI, flow technologies – including NetFlow, sFlow, IPFIX, and jFlow – SSH, HTTP and HTTPS, ping, and others, which means they work with most major enterprise network vendors and manufacturers, including Cisco, Dell, and HPE.
Every sensor tracks a parameter that could impact your bandwidth, including availability and utilization, CPU load and memory usage, data packets, response time, jitter, latency, quality of service (QoS), speed, and traffic, alerting you if performance dips so you can make adjustments and optimize your internet connections (or send an angry email to your internet provider).
PRTG comes with more than 250 native sensor types for monitoring your entire on-premises, cloud, and hybrid cloud environment out of the box. Check out some examples below!
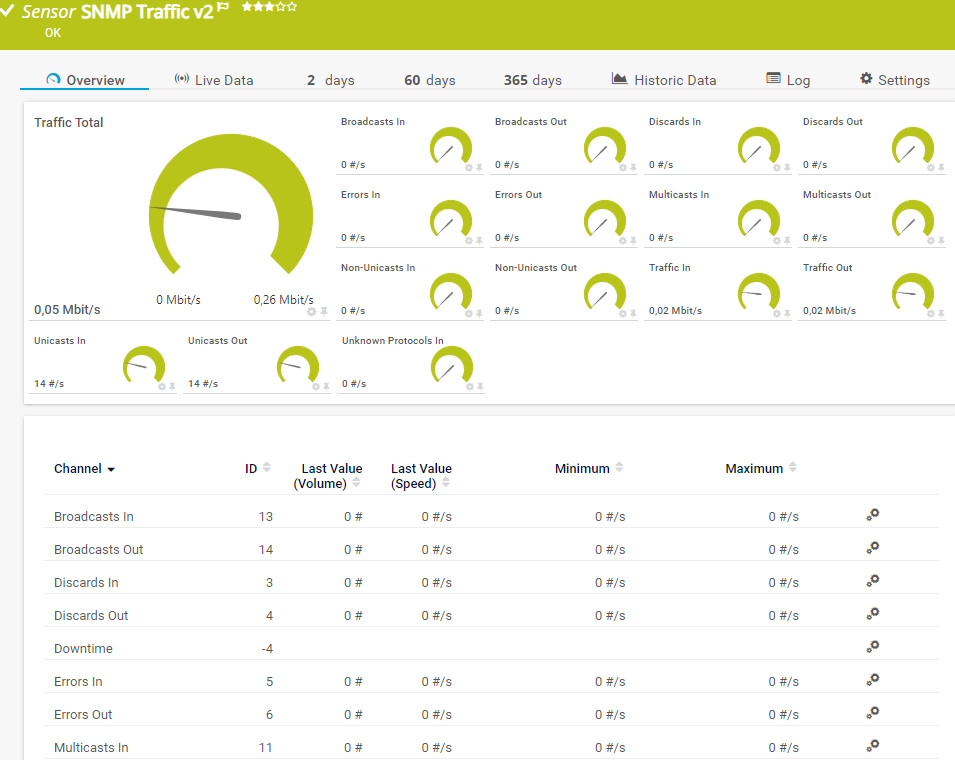
The SNMP Traffic v2 sensor monitors bandwidth and traffic on a device. It can show the following:
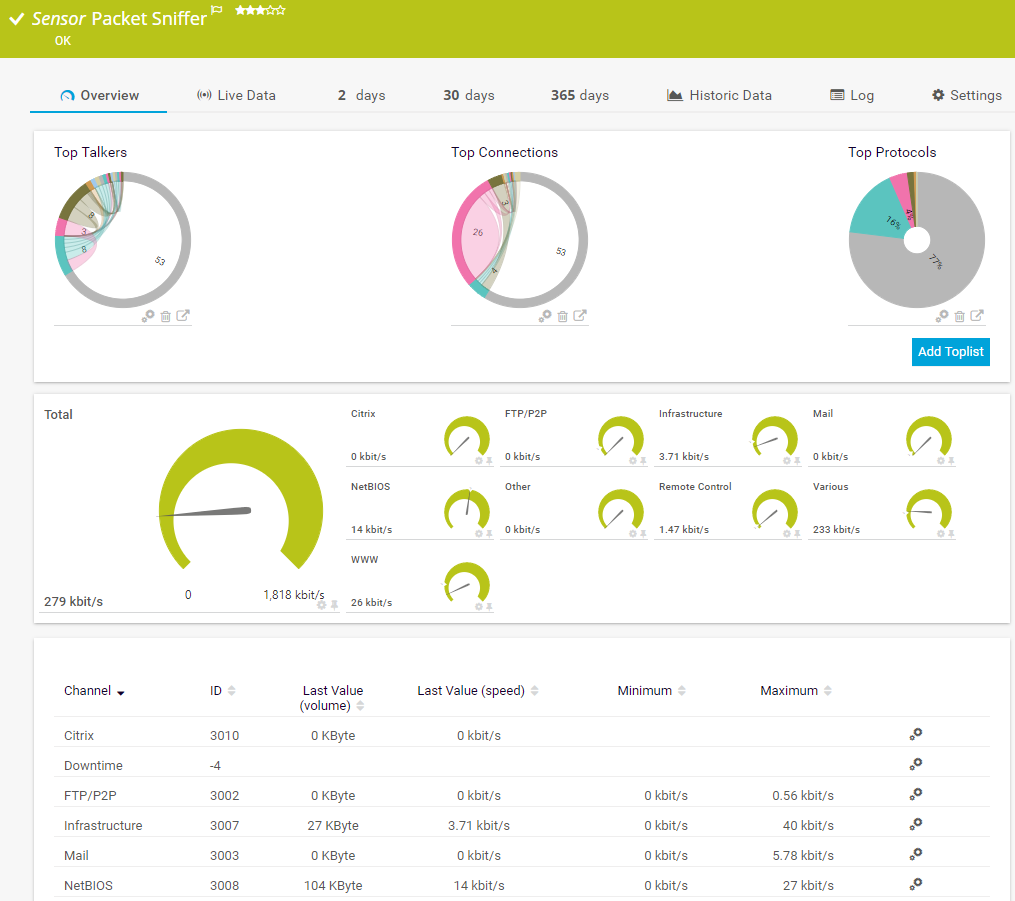
The Packet Sniffer sensor monitors the headers of data packets that pass a local network card using a built-in packet sniffer. You can choose from predefined channels. It can show the following and more:
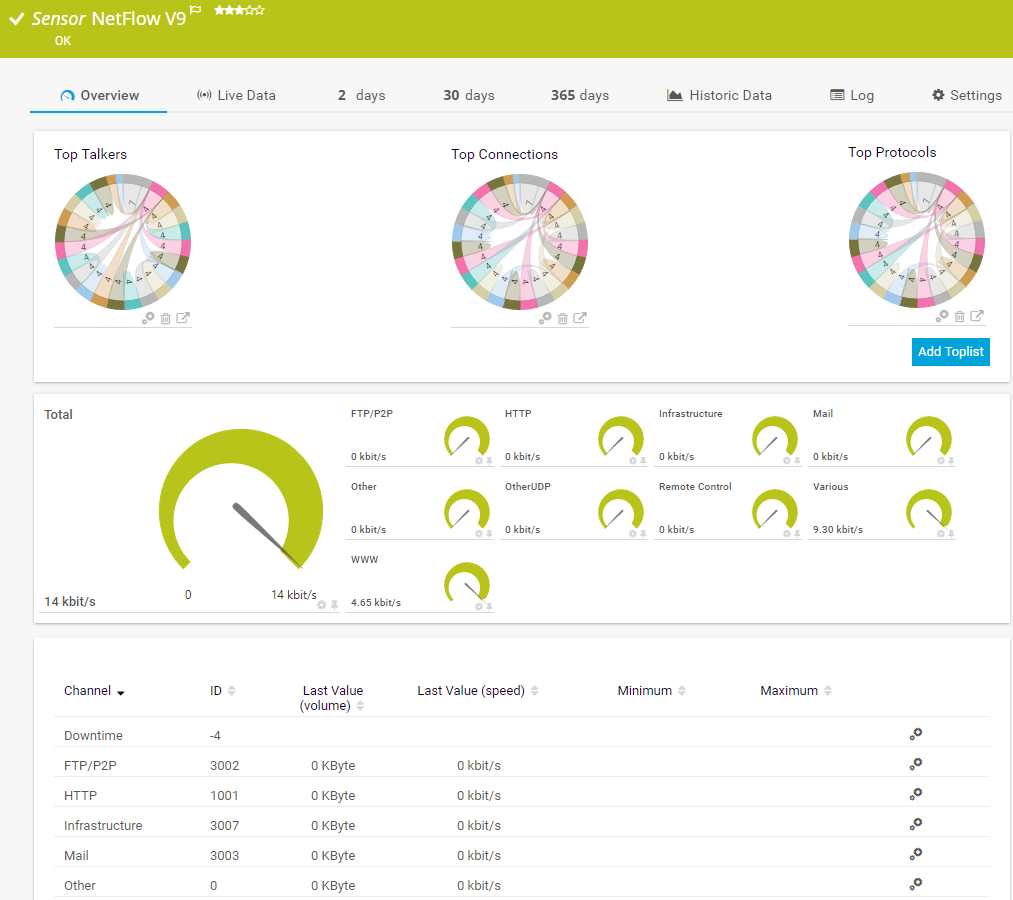
The NetFlow v9 sensor receives traffic data from a NetFlow v9-compatible device and shows the traffic by type. This sensor has several filter options to divide traffic into different channels. It can show the following and more:
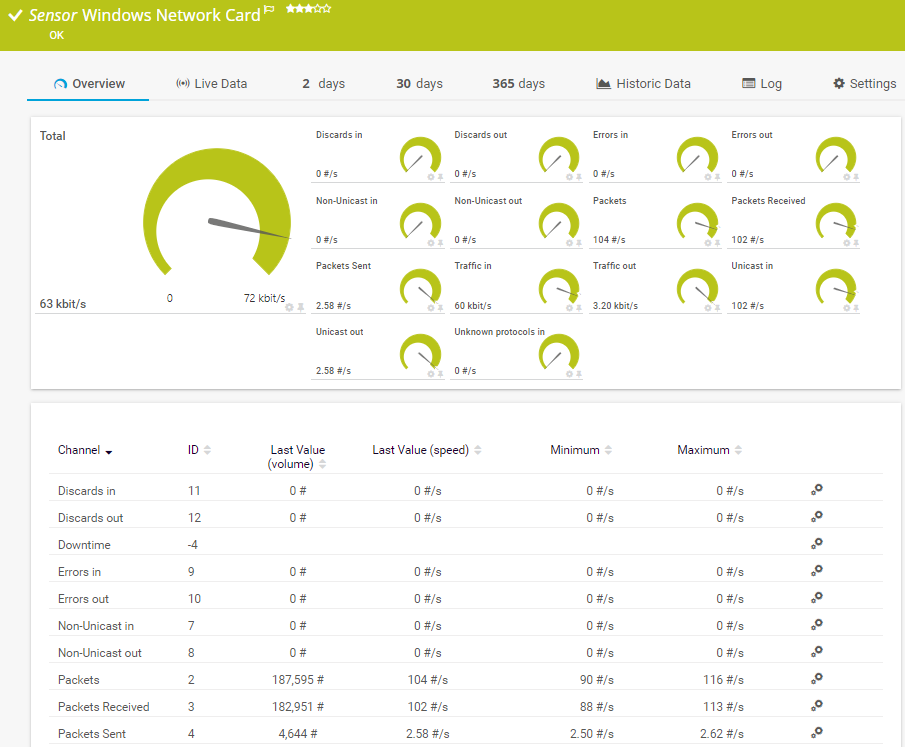
The Windows Network Card sensor monitors the bandwidth usage and traffic of a network interface via Windows Management Instrumentation (WMI) or Windows performance counters. It can show the following:
See the PRTG Manual for a list of all available sensor types.

Custom alerts and data visualization let you quickly identify and prevent network congestion, latency, jitter, and other online connectivity problems.
PRTG is set up in a matter of minutes and can be used on a wide variety of mobile devices.


“Excellent tool for detailed monitoring. Alarms and notifications work greatly. Equipment addition is straight forward and server initial setup is very easy. ...feel safe to purchase it if you intend to monitor a large networking landscape.”
Partnering with innovative IT vendors, Paessler unleashes synergies to create
new and additional benefits for joined customers.
IT that works constitutes a business-critical basis for a company's success. Availability and security must be defined for the respective purpose and closely monitored – by OT and IT alike.
Integrating monitoring results from PRTG into NetBrain maps makes the foundation for network automation.

With ScriptRunner Paessler integrates a powerful event automation platform into PRTG Network Monitor.
Real-time notifications mean faster troubleshooting so that you can act before more serious issues occur.
Network Monitoring Software – Version 24.4.102.1351 (November 12th, 2024)
Download for Windows and cloud-based version PRTG Hosted Monitor available
English, German, Spanish, French, Portuguese, Dutch, Russian, Japanese, and Simplified Chinese
Network devices, bandwidth, servers, applications, virtual environments, remote systems, IoT, and more
Choose the PRTG Network Monitor subscription that's best for you


In enterprise networks, bandwidth is how much data can be transferred between two endpoints in a given time-frame. It's typically measured in megabits per second (Mbps) or, more and more, in gigabits per second (Gbps).
Higher bandwidth means your network can handle more data more quickly, which helps your internet connections run faster and be more stable and reliable. When bandwidth is low, your internet connections can slow down or become unstable. It may also not be able to support all the connected devices, applications, internet services, and other components your organization needs to operate effectively.
A bandwidth meter (or bandwidth tester or bandwidth calculator) is a tool that measures the amount of data being transmitted or received over a network connection, typically in real time. It is used to monitor network bandwidth usage, which refers to the data transfer rate measured in bits per second (bps) between devices on a network.
Key purposes of a bandwidth meter include:
Bandwidth monitoring means tracking how much data your network is processing, while bandwidth management means controlling and optimizing the available bandwidth. Think of it this way. If your network were a highway, monitoring would be traffic cameras, and management would be traffic control measures such as bus lanes, speed limits, and traffic lights.
Both are critical if you want to manage your network effectively. Bandwidth monitoring shows you how much bandwidth is being used and by which network components. Bandwidth management is the process of assessing whether bandwidth usage suits your needs and, if not, prioritizing where it should go.
PRTG's bandwidth meter monitors all your network components round the clock, enabling you to see exactly how much bandwidth specific software, hardware, or other components are using at any point in time. Better still, it alerts you automatically if bandwidth usage goes above a predetermined threshold, so you can make adjustments on the fly, before your network's performance starts to suffer.
In PRTG, “sensors” are the basic monitoring elements. One sensor usually monitors one measured value in your network, for example the traffic of a switch port, the CPU load of a server, or the free space on a disk drive. On average, you need about 5-10 sensors per device or one sensor per switch port.
Paessler conducted trials in over 600 IT departments worldwide to tune its network monitoring software closer to the needs of sysadmins. The result of the survey: over 95% of the participants would recommend PRTG – or already have.

Paessler PRTG is used by companies of all sizes. Sysadmins love PRTG because it makes their job a whole lot easier.
Bandwidth, servers, virtual environments, websites, VoIP services – PRTG keeps an eye on your entire network.
Everyone has different monitoring needs. That’s why we let you try PRTG for free.