Custom alerts and data visualization let you quickly identify and prevent system, security, and network issues.
Maintaining the health, performance, and security of your devices, networks, and applications is critical to prevent costly downtime, but it doesn’t have to be complex. Watching your entire system is easier than it looks with our Paessler PRTG system monitoring tool.
Get a holistic view of your system’s health and performance to identify issues you might not otherwise see when looking at individual devices and networks. Drill down to troubleshoot and solve known issues on specific devices, networks, and other components.
Detect security threats promptly with a systems monitor that watches all aspects of your IT infrastructure. Real-time notifications allow you to respond immediately and shut down the threat, reducing potential security leaks.
Monitor, manage, plan, and report on the needs of your devices, applications, services, and other components from one main dashboard and user interface. PRTG’s centralized system monitoring simplifies management tasks, improving the efficiency of your IT team.
Manage the increasing complexity of a growing organization with comprehensive, always-on system monitoring. Easy-to-understand dashboards give you the information you need for better resource and capacity planning, making informed upgrade investments, and predicting future trends based on historical data.
Diagnose network issues by continuously tracking your entire IT infrastructure. Show response time, network traffic, resource utilization, uptime, application performance, security breaches, and other key system metrics in real time. Visualize monitoring data in clear graphs and dashboards to identify problems more easily. Gain the overview you need to troubleshoot all kinds of performance issues in your system.

Live traffic data graph in PRTG

Device tree view of the complete monitoring setup

Custom PRTG dashboard for keeping an eye on the entire IT infrastructure
Live traffic data graph in PRTG
Device tree view of the complete monitoring setup
“All-around winning
network monitor”
“The real beauty of PRTG is the endless possibilities it offers”
“PRTG Network Monitor
is very hard to beat”
PRTG comes with more than 250 native sensor types for monitoring your entire on-premises, cloud, and hybrid cloud environment out of the box. Check out some examples below!
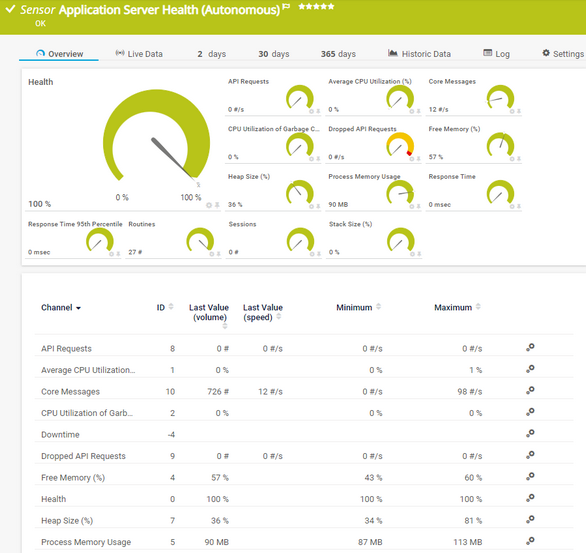
The Application Server Health (Autonomous) sensor monitors the health of the PRTG application server and checks various parameters that can affect the quality of the monitoring results. It can show the following:
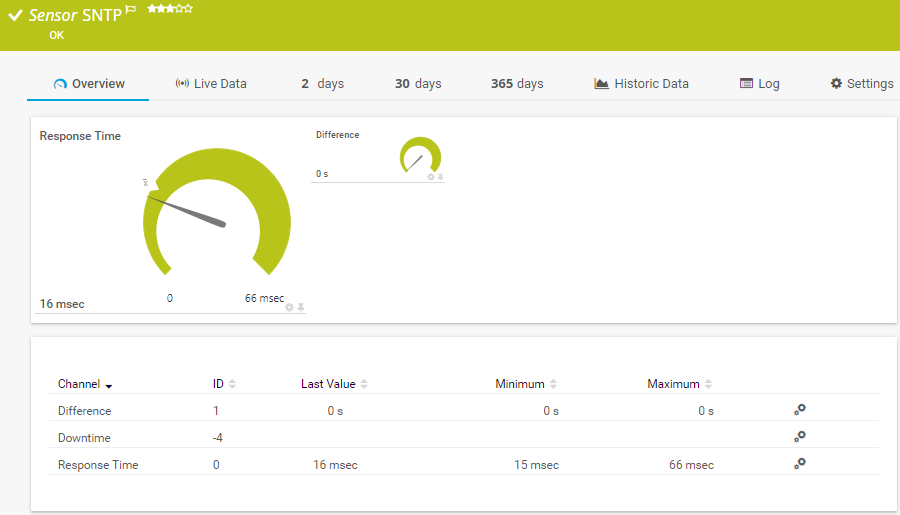
The SNTP sensor monitors a Simple Network Time Protocol (SNTP) server. It can show the following:
See the PRTG Manual for a list of all available sensor types.

Custom alerts and data visualization let you quickly identify and prevent system, security, and network issues.
PRTG is set up in a matter of minutes and can be used on a wide variety of mobile devices.

Partnering with innovative IT vendors, Paessler unleashes synergies to create
new and additional benefits for joined customers.

baramundi and PRTG create a secure, reliable and powerful IT infrastructure where you have everything under control - from the traffic in your firewall to the configuration of your clients.
Combining their tools to a powerful solution for advanced analysis and automation, KnowledgeRiver and Paessler enable IT teams to ensure best performance for their infrastructure and networks.

Siemon and Paessler bring together intelligent building technology and advanced monitoring and make your vision of intelligent buildings and data centers become reality.
Network Monitoring Software – Version 24.4.102.1351 (November 12th, 2024)
Download for Windows and cloud-based version PRTG Hosted Monitor available
English, German, Spanish, French, Portuguese, Dutch, Russian, Japanese, and Simplified Chinese
Network devices, bandwidth, servers, applications, virtual environments, remote systems, IoT, and more
Choose the PRTG Network Monitor subscription that's best for you


System monitoring continuously observes and analyzes an IT system’s performance, health, and security. It tracks metrics and events in real time to make sure the system operates efficiently, securely, and within its expected parameters. It includes the monitoring of hardware like routers and switches, hardware parameters such as CPU usage and server memory, network traffic, bandwidth, as well as the performance and availability of applications.
A monitoring system is software that helps sysadmins monitor systems in an IT environment. Monitoring systems come in many degrees of functionality and range from tools that do one thing really well to enterprise-grade solutions with the ability to monitor thousands of devices and applications.
Some IT managers adopt a reactive approach and only step in when there’s an issue. This is a risky approach and can lead to lengthy troubleshooting sessions. Other IT managers use a lot of small tools to oversee their infrastructure. Yet, these managers miss out on a unified dashboard that gives you an overview of your entire IT infrastructure. Implementing a monitoring system saves time, reduces stress, and cuts costs.
Unlike smaller tools that may or may not communicate with each other, a monitoring system lets you see your entire network from a single computer and a central dashboard. You get immediate notifications when an error occurs so you can fix it quickly. Long-term monitoring also provides the data you need for predictive maintenance and accurate resource planning.
In PRTG, “sensors” are the basic monitoring elements. One sensor usually monitors one measured value in your network, for example the traffic of a switch port, the CPU load of a server, or the free space on a disk drive. On average, you need about 5-10 sensors per device or one sensor per switch port.
Paessler conducted trials in over 600 IT departments worldwide to tune its network monitoring software closer to the needs of sysadmins. The result of the survey: over 95% of the participants would recommend PRTG – or already have.

Paessler PRTG is used by companies of all sizes. Sysadmins love PRTG because it makes their job a whole lot easier.
Bandwidth, servers, virtual environments, websites, VoIP services – PRTG keeps an eye on your entire network.
Everyone has different monitoring needs. That’s why we let you try PRTG for free.