• Company
    • About Us
    • Case Studies
    • Press Center
    • Careers
    • Blog
    • Contact us
  • Contact us
  • Login
 
  • English
    • Deutsch
    • Español
    • Français
    • Italiano
    • Português
Paessler
                    - The Monitoring Experts
  • Products
    • Paessler PRTG
      Paessler PRTGMonitor your whole IT infrastructure
      • PRTG Network Monitor
      • PRTG Enterprise Monitor
      • PRTG Hosted Monitor
      • PRTG UVexplorer
      • PRTG extensionsExtensions for Paessler PRTGExtend your monitoring to a new level
    • Icon Features
      FeaturesExplore all monitoring features
      • Maps & dashboards
      • Alerts & notifications
      • Multiple user interfaces
      • Distributed monitoring
      • Customizable reporting
  • Solutions
    • Industries
      IndustriesMonitor various industry sectors
      • Industrial
      • Healthcare
      • Data Center
      • Education
      • Finance
      • Government
    • IT Topics
      IT TopicsMonitor all areas of IT
      • Network Monitoring
      • Bandwidth Monitoring
      • SNMP Monitor
      • Network Mapping
      • WiFi Monitoring
      • Server Monitoring
  • Pricing
  • Resources
    • Getting Started
      Getting StartedModules for self-paced learning
    • How-to Guides
      How-to GuidesGet the most out of PRTG
    • Videos & Webinars
      Videos & WebinarsLearn from Paessler experts
    • IT  Knowledge
      IT KnowledgeExpand your IT knowledge
    • PRTG Manual
      PRTG ManualFull documentation
    • Knowledge Base
      Knowledge BaseShare community knowledge
    • PRTG Sensor Hub
      PRTG Sensor HubGet sensors, scripts & templates
    • Trainings
      PRTG TrainingLearn how to work with PRTG
  • Partners
    • Icon Handshake
      Become a PartnerFor resellers and channel partners
    • Icon MSP
      Become an MSPDeliver monitoring as a managed service
    • icon partner
      Partner PortalLog in to your partner account
    • Deal Registration
      Deal RegistrationRegister your sales opportunities
    • icon search
      Find a PartnerFind partners selling Paessler products
    • icon technology
      Technology AlliancesSee Paessler technology partnerships
    • Partner HubTools for Your Success
  • Company
    • About Us
    • Case Studies
    • Press Center
    • Careers
    • Blog
    • Contact us
  • Contact us
  • Login
  • English
    • Deutsch
    • Español
    • Français
    • Italiano
    • Português
  • Get a quote
  • Free trial

Professional Free Network Monitoring

Try PRTG free for 30 days. Monitor your network devices, bandwidth, and uptime from day one. 

Free download
PRODUCT OVERVIEW

What Should a Free Network Monitoring Software Actually Do? 

Most teams piece together three or four free network monitoring tools to get basic visibility: one for availability checks, another for traffic, something else for server health, and maybe a dashboard bolted on top. Paessler PRTG replaces that stack with a single monitoring solution. You get device availability, bandwidth monitoring, server health, and alerting in one interface, with dashboards and historical data included from the start.  

No stitching tools together. Just one place to see what's happening across your network.  

What PRTG monitors: Routers · Switches · Firewalls · Windows, Linux, and macOS servers · Network devices via SNMP, WMI, ICMP/Ping · Databases · NetFlow, sFlow, jFlow, IPFIX · Syslog · SNMP Traps · HTTP · Microsoft environments · Applications

Download PRTG Trial

What you will find on this page

  • Why PRTG is Your Free-Tool Alternative
  • How PRTG Monitors Your Network
  • Network Monitoring with PRTG vs. Without
  • FAQs

PRTG is compatible with all major vendors, products, and systems

compatible with all major vendors, products, and systems

Complete Network Monitoring Without the Free-Tool Compromises

Full Monitoring Visibility Without the Setup Overhead

Open source tools like Nagios Core and Zabbix offer real monitoring capability, but getting there takes work. Nagios needs plugin installation, config files, and dependency management before it monitors anything useful. Zabbix requires trigger logic and template configuration upfront. For a sysadmin on a lean IT team, that's days of setup time, not hours.  

PRTG takes a different approach. Install it on Windows, and the Smart Setup wizard walks you through initial configuration on first launch. No Linux environment. No plugin repositories. No config files to write from scratch.

  • Guided Smart Setup wizard launches automatically on first install
  • Runs on Windows, no Linux environment needed
  • No plugin repositories or manual dependency management
  • Pre-configured device templates for common hardware: routers, switches, servers

Automatic Discovery for Everything on Your Network

Manual device inventories are out of date the moment you finish them. Someone adds a switch, swaps a firewall, spins up a new server. Your spreadsheet doesn't know about it.  

PRTG's auto-discovery scans your defined IP address ranges, identifies devices via ARP, assigns device types automatically, and creates a starting sensor set for each one. You don't enter devices manually. You define the IP range, run discovery, and PRTG gives you a mapped view of what's on your network, giving you a solid foundation for network management.  

The dashboard shows topology, connectivity status, and device health at a glance. Schedule re-discovery to keep the inventory current as your environment changes.

  • Automated IP range scanning with device identification
  • Network mapping and topology view in the dashboard
  • Device categorization by type: router, switch, server, firewall
  • Scheduled re-discovery to catch new or changed devices
PRTG sunburst chart visualizing the full network hierarchy with color-coded sensor status

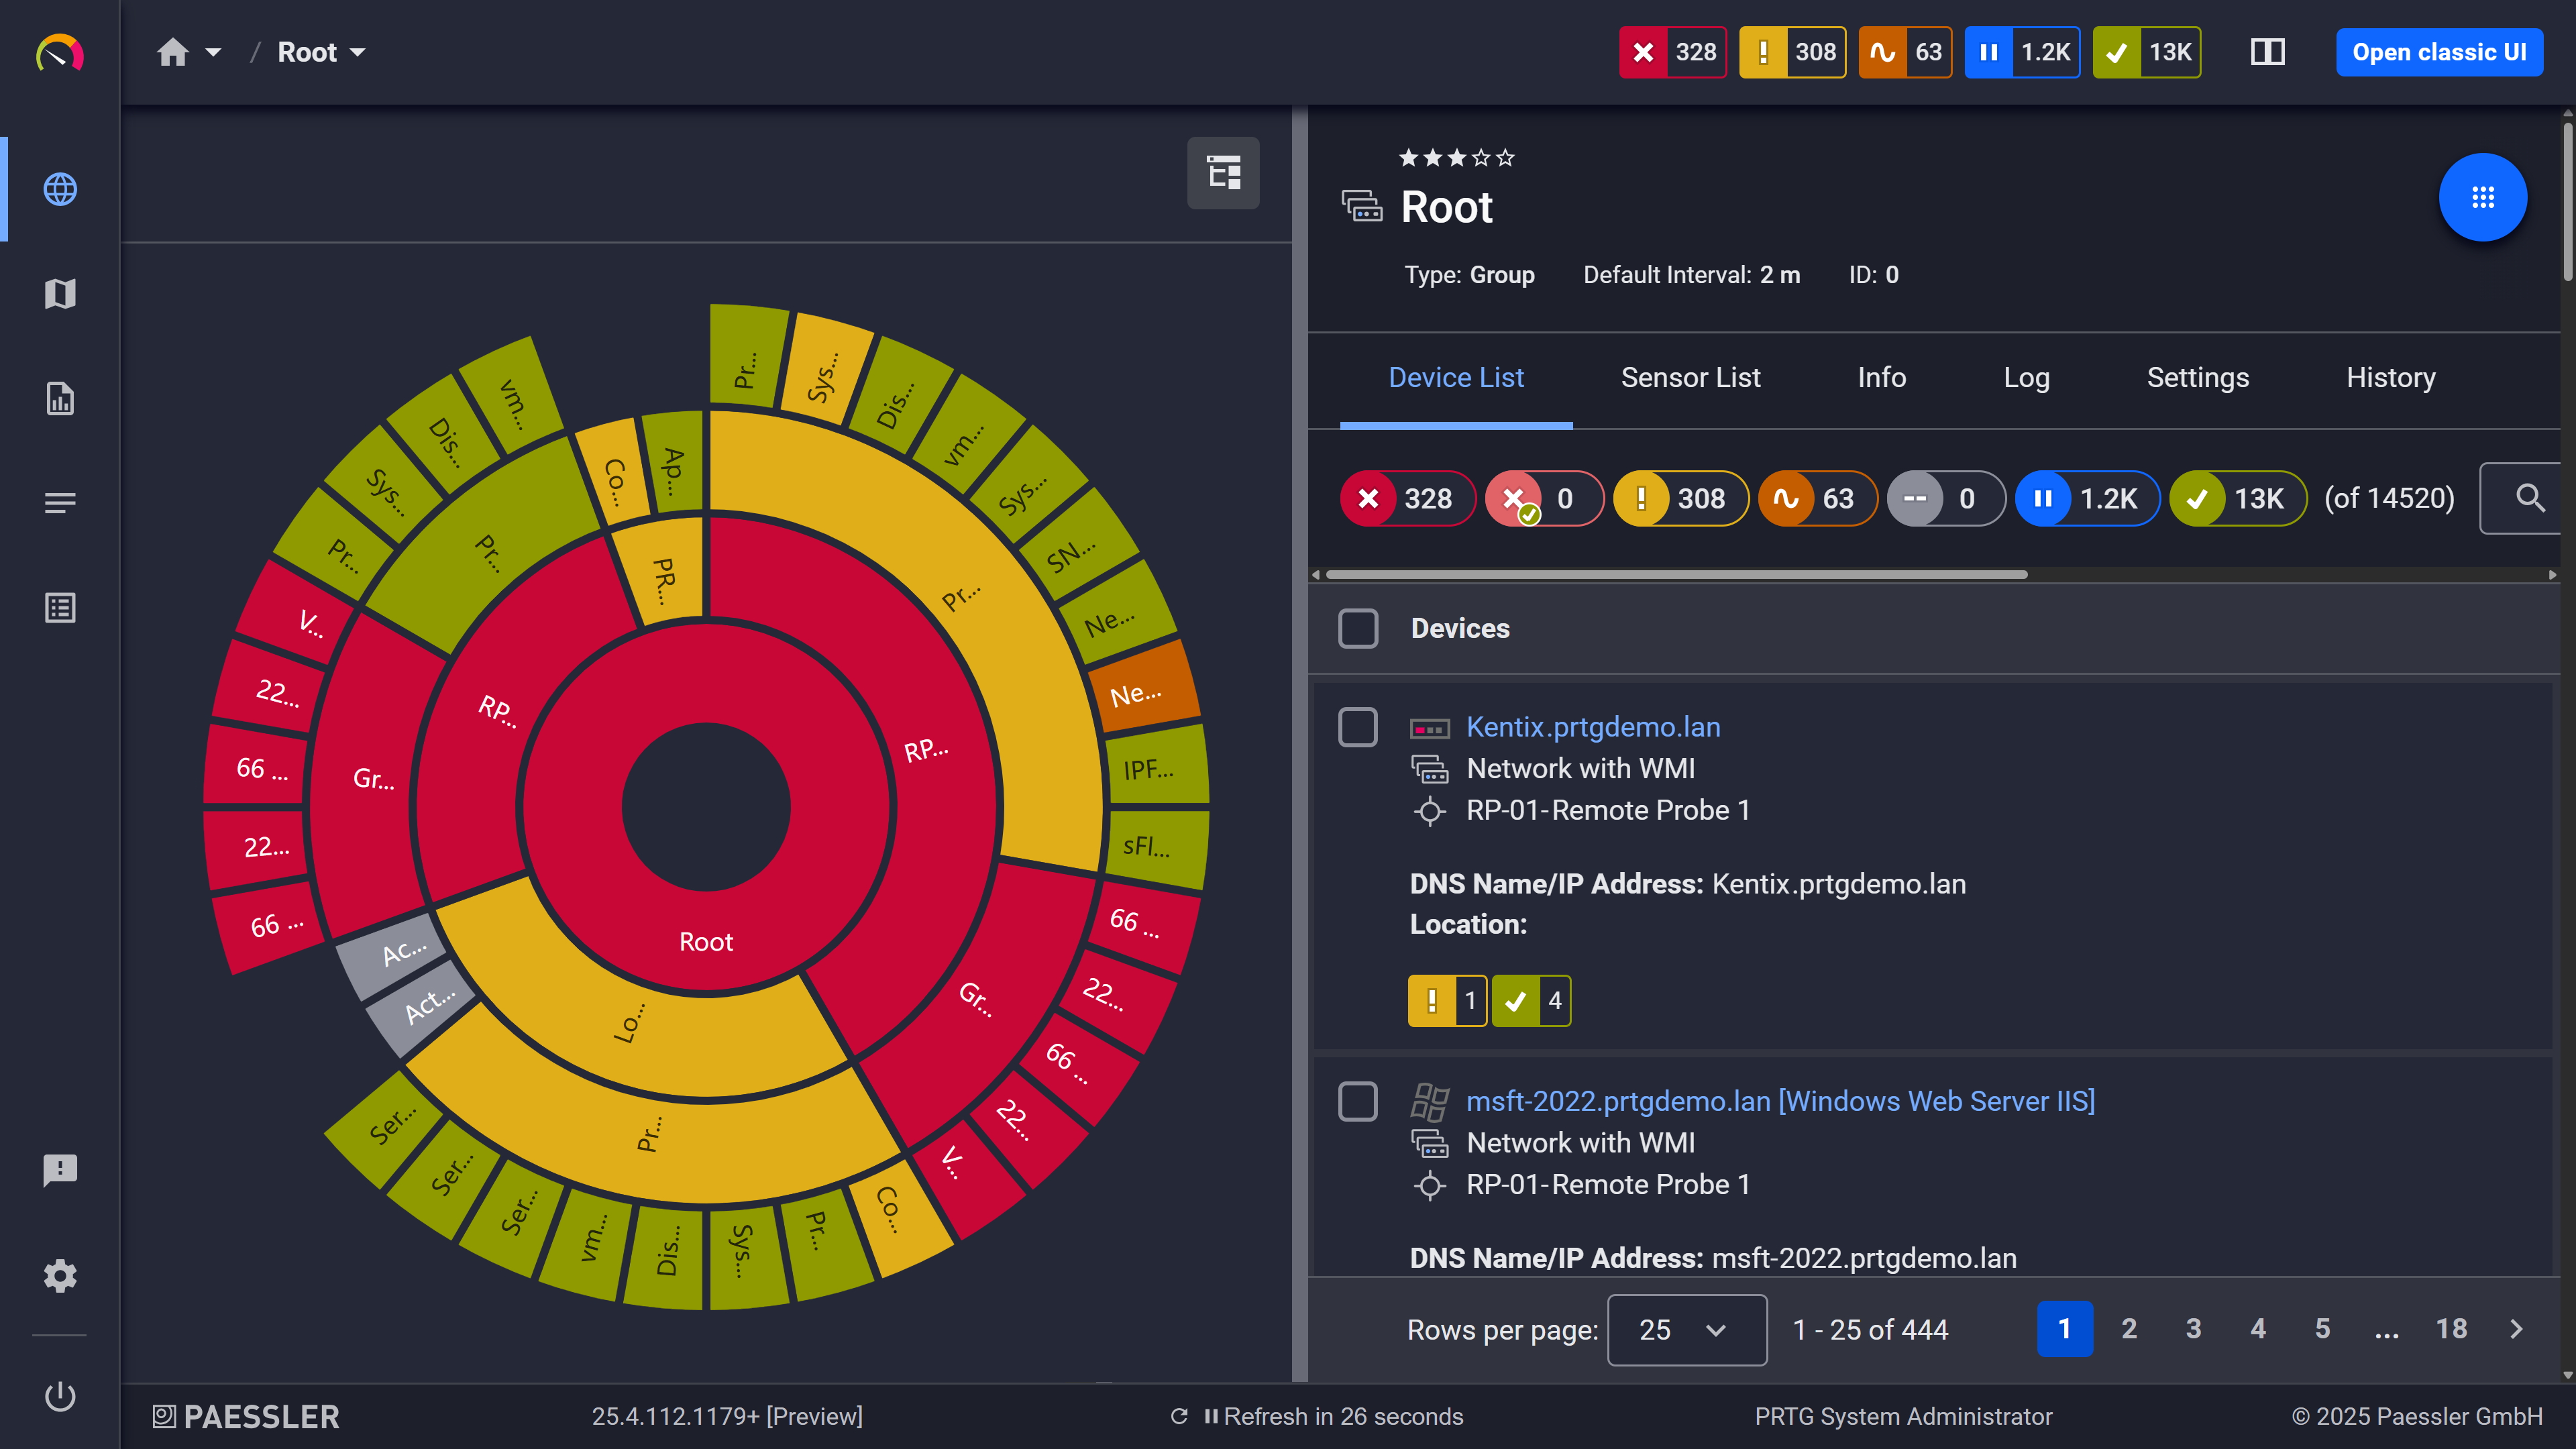
Your entire network, visualized instantly

PRTG web interface showing device tree and full device list with sensor status badges

Full device list, instant overview

PRTG Ping sensor graphs showing response time, min, max, and packet loss over time

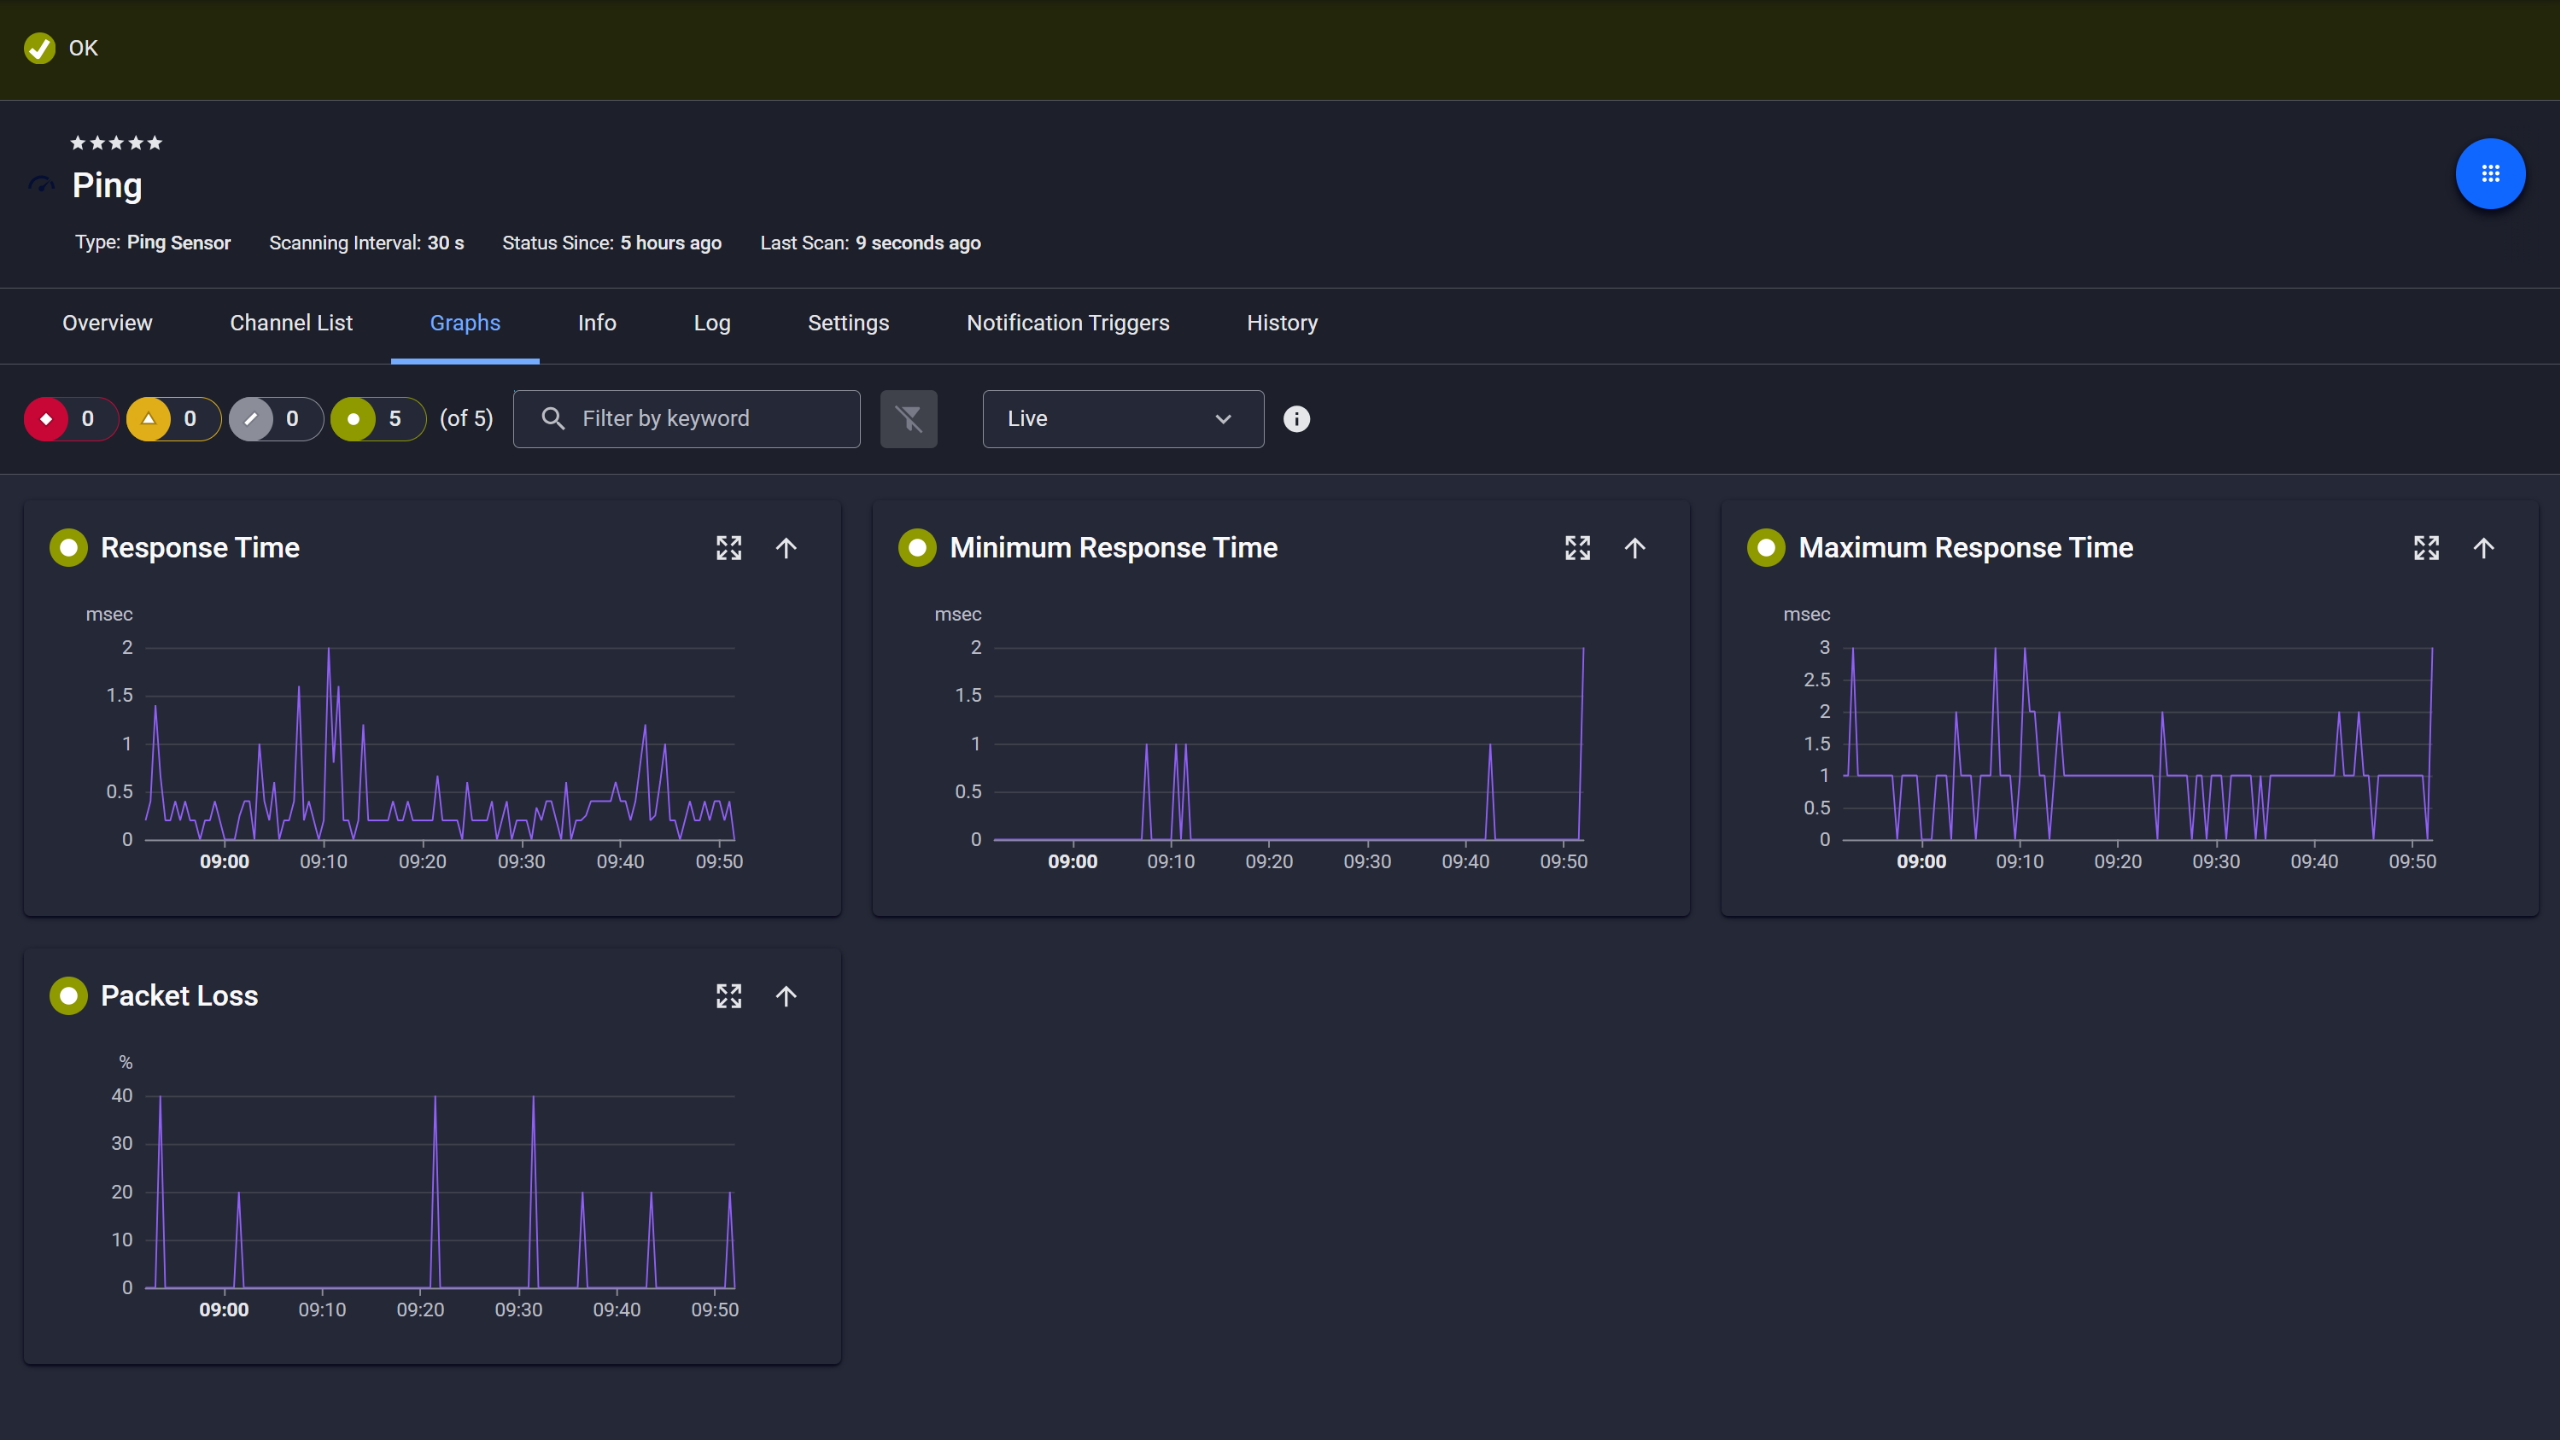
Ping response and packet loss

See Why IT Professionals Trust PRTG

Start monitoring your infrastructure in minutes. No professional services, no complex configuration, no risk.

Free download
PRODUCT OVERVIEW

Get Notified Before Your Users Notice Anything

If the first sign of a problem is a user complaint or a helpdesk ticket, your monitoring isn't doing its job.  

PRTG watches device availability and network performance metrics continuously. When a threshold is breached (an interface goes down, disk space hits a limit, response time spikes), PRTG sends a notification. You know about downtime before your users do.  

You control who gets notified, how, and when. Escalation schedules let you route alerts to the right person at the right time, not just blast everyone on the team.

  • Threshold-based alerting on any monitored metric
  • Multi-channel notifications: email, push notifications (iOS/Android), HTTP actions, and more
  • Configurable escalation and notification schedules
  • Historical data retained for troubleshooting: trace what changed and when
PRTG home screen showing feature highlight cards including mobile interface and API

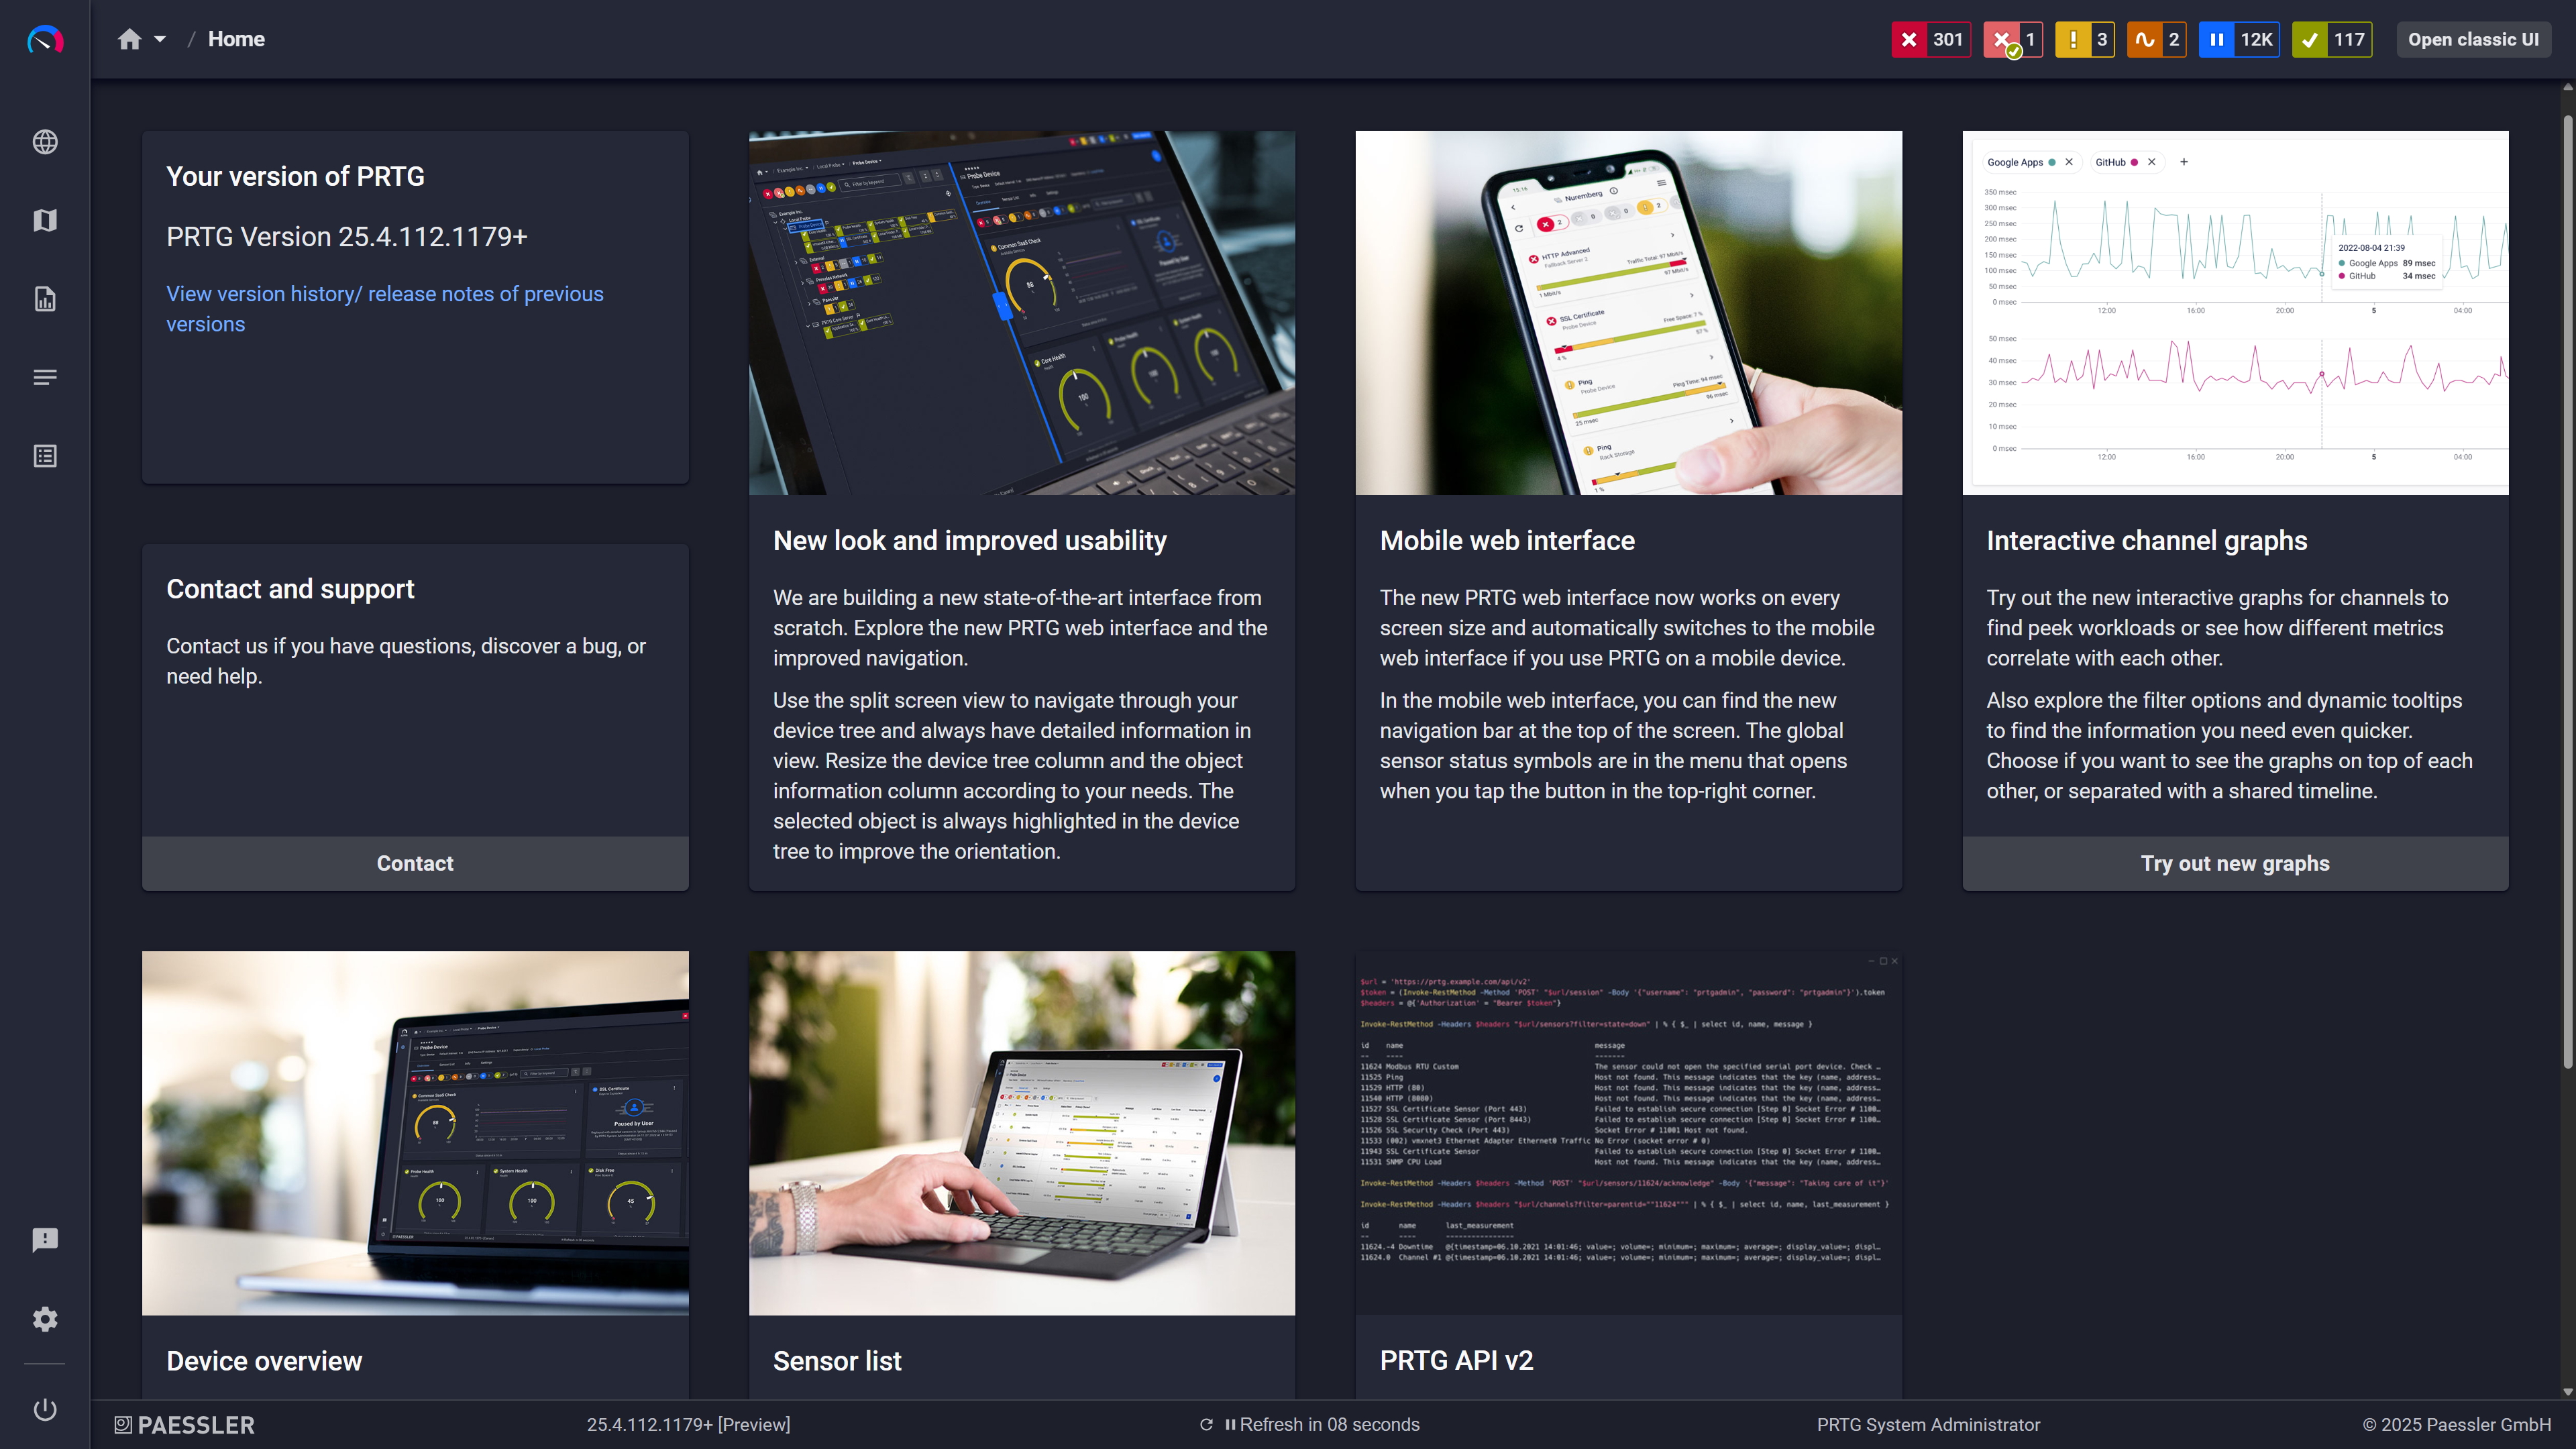
Modern interface, everything within reach

PRTG Map Designer with two network devices placed on a blank canvas

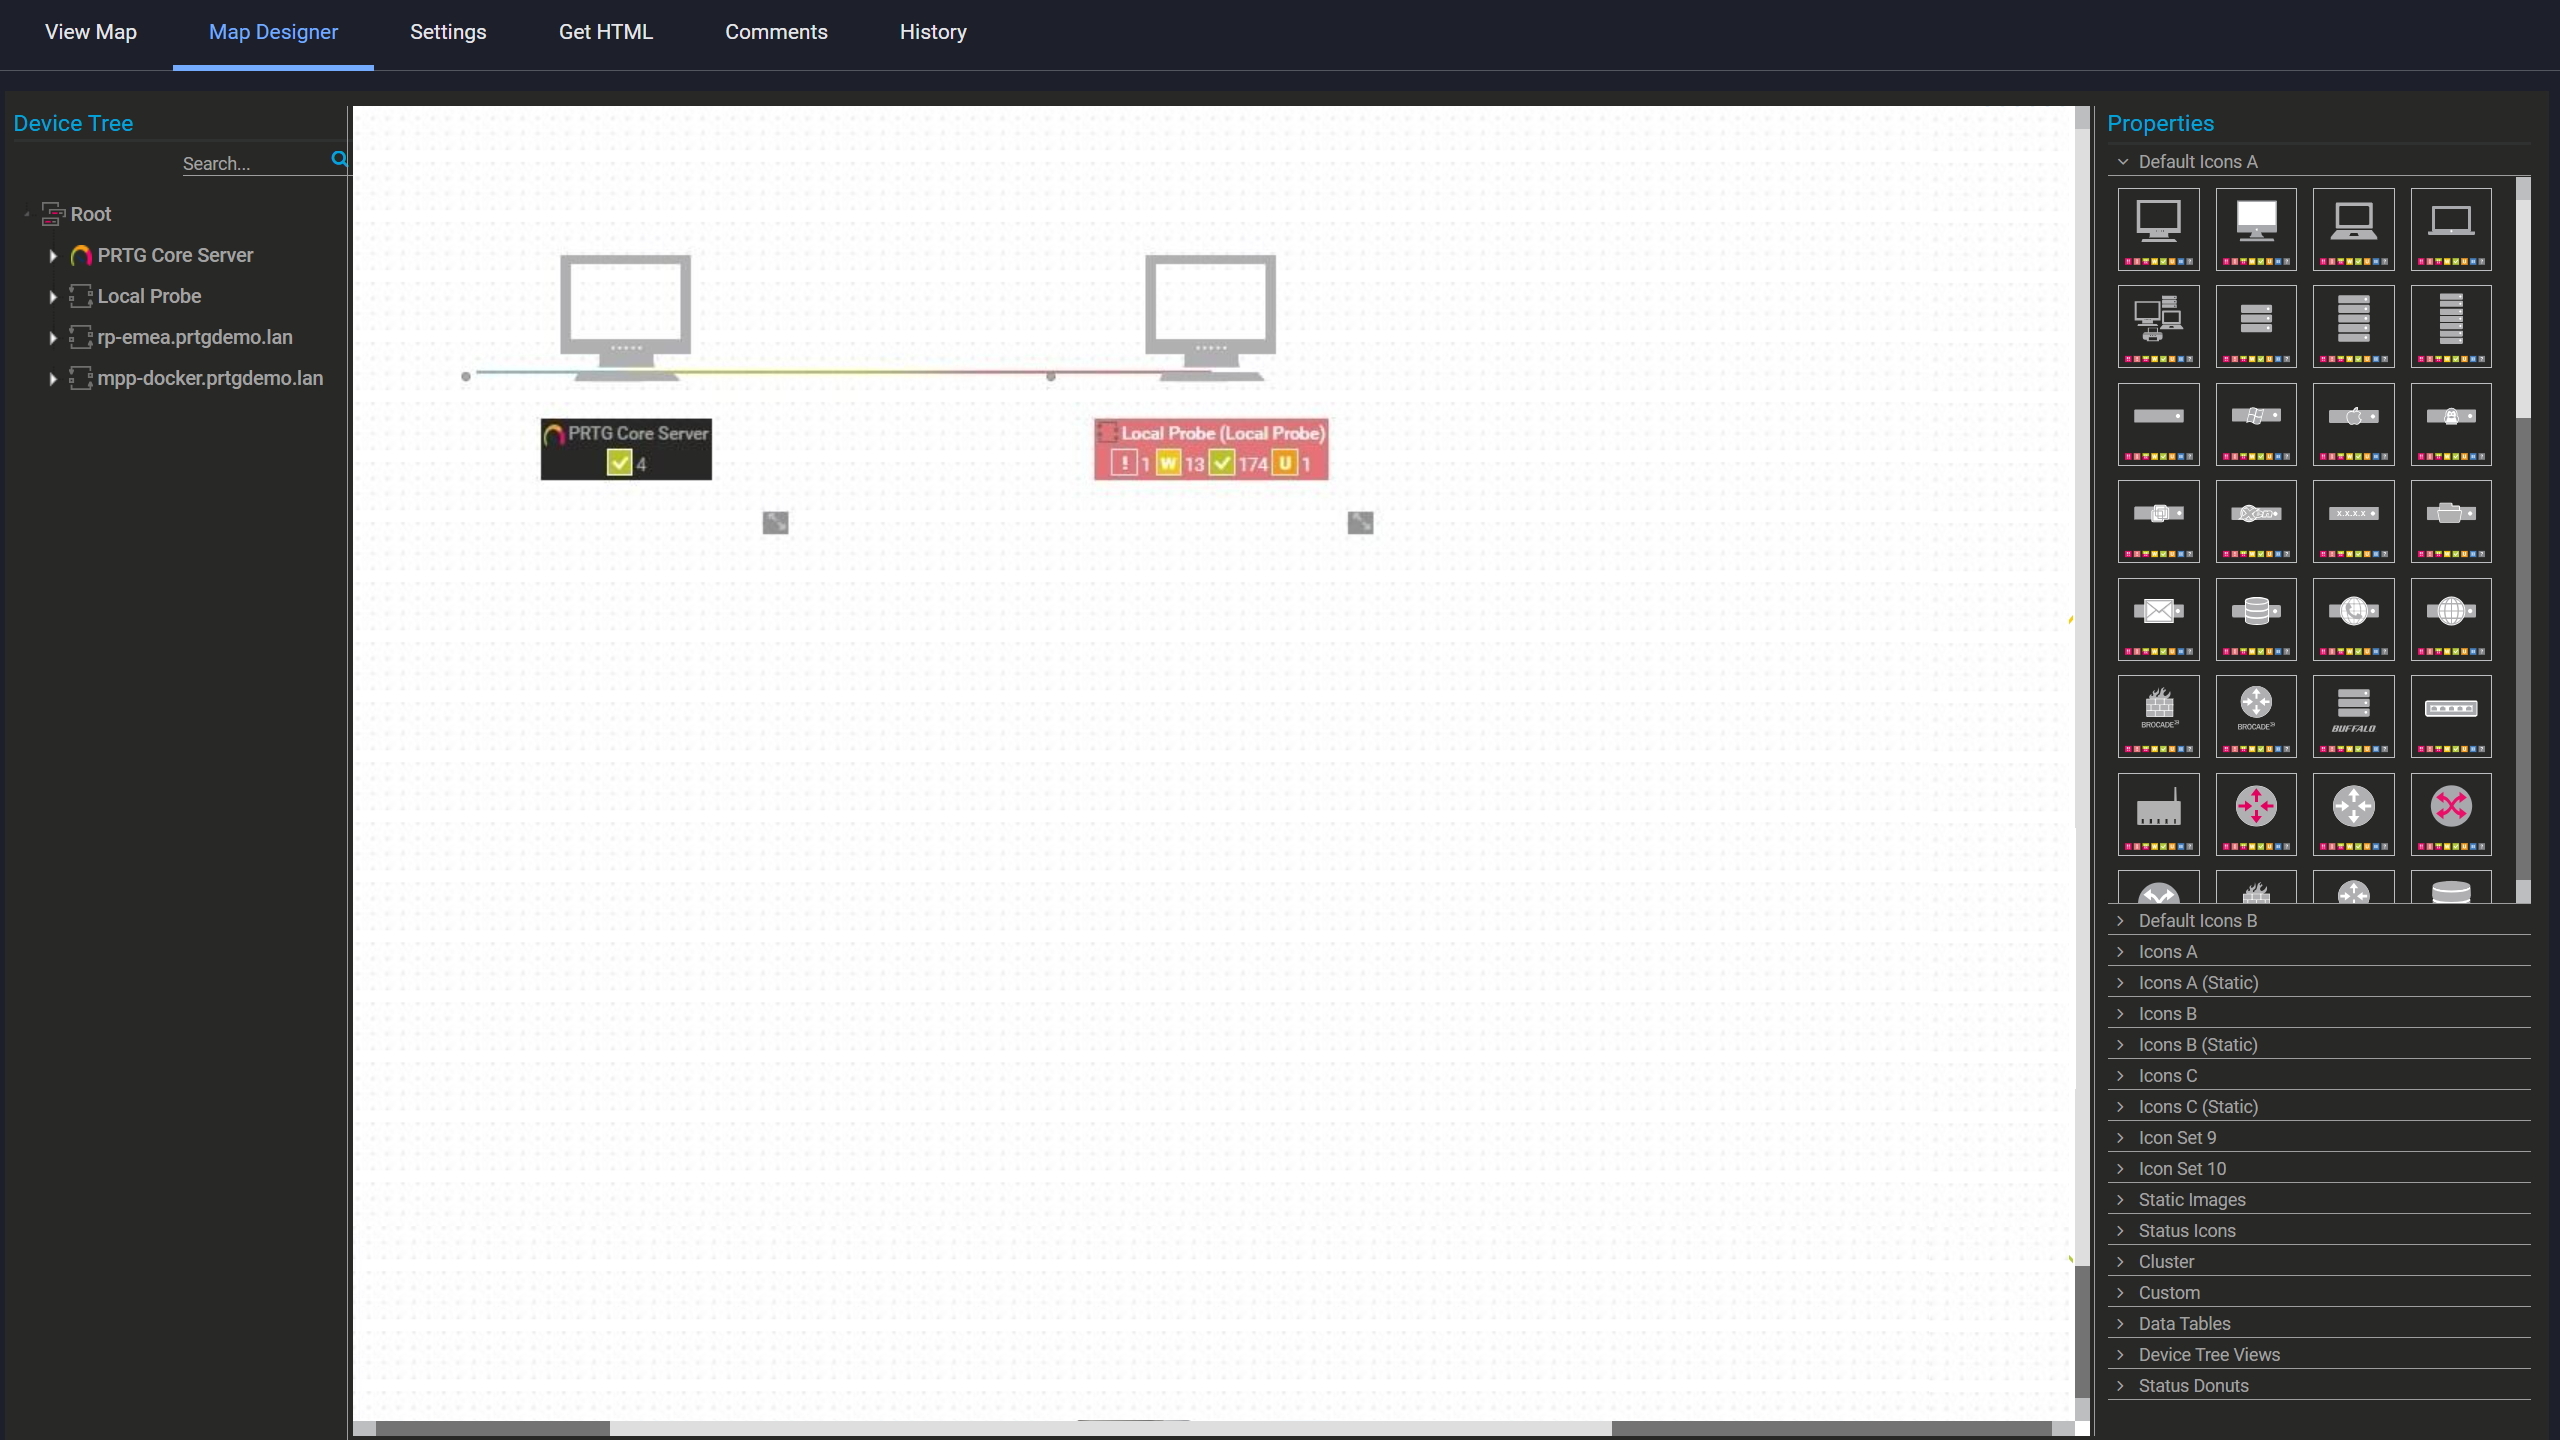
Build your own network map

PRTG reports list showing scheduled monitoring reports with run times and sensor counts

Scheduled reports, always on time

A Free Trial That Works in Your Environment

A lot of "free" monitoring tools come with a catch. They cap you at five devices. They go read-only after 14 days. They hide the features you actually need behind a paywall from the start.  

PRTG's 30-day trial gives you full, unrestricted access. No credit card. No commitment. You can test it against your actual infrastructure: your routers, your servers, your Windows machines. Not a sanitized demo environment.  

After the on-premises trial, the freeware edition is available. As your infrastructure monitoring needs grow, PRTG's sensor-based licensing scales with you. You pay for what you monitor, nothing more. And whether you're running it on-premises or prefer a hosted option, the monitoring stays the same.

  • Full 30-day trial: no credit card required, no commitment
  • Freeware edition (up to 100 sensors) available after the on-premises trial
  • Scalable sensor-based licensing: pay only for what you monitor
  • Available on-premises (Windows) with a 30-day trial, or as PRTG Hosted Monitor (10-day trial)

How PRTG Monitors Your Network

PRTG uses multiple protocols simultaneously, each suited to different device types and data sources. Here's what each method collects and where it applies.

SNMP (v1, v2c, v3)

Routers, switches, firewalls, printers: if it speaks SNMP, PRTG can query it. OID values come back covering interface status, traffic counters, CPU utilization, memory, and error rates. No agent needed on the target device.  

SNMP does need to be enabled and configured on each device before any of that works, but that's a one-time step per device type. All three versions are supported. Most environments run v2c and that's the default, though v3 is there when you need authentication and encryption.

ICMP / Ping Availability

The Ping v2 sensor sends ICMP echo requests at configurable intervals and tracks response time, packet loss, and reachability. Works on any IP-connected device, no protocol support required on the target side.  

This is your baseline check. Is it up or down and how fast is it responding. Everything else builds from there.

Flow Traffic Analysis

PRTG receives flow exports from routers and switches via NetFlow (v5/v9), sFlow, jFlow, or IPFIX and breaks the data into Top Talkers, Top Connections, and Top Protocols. Network traffic patterns get graphed over time so you can see what's consuming bandwidth and when it started.  

One thing to know upfront: flow export has to be enabled on the source device. That's a configuration step on your router or switch, not something PRTG handles automatically. Once the device side is configured PRTG receives and visualizes the data without further setup.

WMI Monitoring

WMI gives PRTG access to Windows internals without installing anything on the monitored machine. CPU load, memory usage, disk space, running services, Windows Event Log entries. Covers your Microsoft infrastructure from domain controllers to file servers.  

Worth being clear about the scope though: WMI is Windows Environments-only. Linux and other systems need a different approach, SSH-based sensors or SNMP depending on what's available on the target.

free downLoad

Free Network Monitoring with PRTG vs. Without

Task

Without a dedicated tool

Without a dedicated tool

With PRTG

With PRTG

Device inventory

Without a dedicated tool
not included

Manual spreadsheet or periodic scans

With PRTG
included

Automated network discovery across IP ranges

Availability monitoring

Without a dedicated tool
not included

Manual ping commands, no history

With PRTG
included

Continuous ICMP checks with threshold alerts

Traffic analysis

Without a dedicated tool
not included

CLI queries per device, no visualization

With PRTG
included

NetFlow/sFlow dashboards with Top Talkers, so you can optimize bandwidth allocation

Windows server health

Without a dedicated tool
not included

RDP into each machine individually

With PRTG
included

WMI-based collection across all monitored servers

Outage notification

Without a dedicated tool
not included

User complaint or helpdesk ticket 

With PRTG
included

Email/push alert at the moment of breach

free downLoad

”Adopting PRTG has been like going from being in the dark to being in the light. Before, we had limited visibility into what was happening in the infrastructure and in the network. Now, however, thanks to the comprehensive dashboard and real-time notifications, we receive constant updates on the status of facilities and services, and our way of working has gone from passive to proactive.”

Luca Meneghesso, Senior IT infrastructure and Security Specialist
Banca Profilo

”GESAC increasingly focuses on innovation to improve the quality of services offered and the experience of passengers handled every day by Naples Airport. Thanks to PRTG, we finally have unified, automatic, and continuous monitoring of the airport network and can guarantee quick and timely interventions.”

Domenico Ciervo, GESAC ICT Manager
Naples International Airport

”As an international company, PRTG is ideal for us. If something went down half way across the world, we wouldn’t be woken up – we can rely on PRTG to identify the problem and alert us before it occurs – enabling the right person, in the right time zone to resolve the problem. At the end of the day, if we’re to provide an internal network experience for our employees that meets expectations, we need a tool like PRTG to be successful.”

Barry Kelly, Systems Engineer
Skyscanner

Paessler PRTG Network Monitor licenses & pricing

Choose the PRTG Network Monitor subscription that's best for you.

License NameLicense descriptionPriceLicense DetailsGet startedPricing Details
PRTG 500$200per month paid annuallyBuy nowBuy now

Enough to monitor multiple aspects of 50 devices

PRTG 1000$358per month paid annuallyBuy nowBuy now

Enough to monitor multiple aspects of 100 devices

PRTG 2500$742per month paid annuallyBuy nowBuy now

Enough to monitor multiple aspects of 250 devices

PRTG 5000$1,300per month paid annuallyBuy nowBuy now

Enough to monitor multiple aspects of 500 devices

PRTG 10000$1,642per month paid annuallyBuy nowBuy now

Enough to monitor multiple aspects of 1000 devices

Over 100,000 Customers Worldwide Love Paessler  

customer success stories

Free Network Monitoring with PRTG: Frequently Asked Questions


What does PRTG's free network monitoring actually include?

Full access during the 30-day trial. All sensor types, alerting, dashboards, historical data, no artificial limits.  

After that an on-premises freeware edition stays available with up to 100 sensors, which is enough for a small environment or keeping basic monitoring running while you figure out whether you actually need more. One thing to note: PRTG Hosted Monitor has a 10-day trial and no freeware edition after. The free tier is on-premises only.

How is PRTG different from open source tools like Nagios or Zabbix?

Setup time, mostly. Nagios Core runs on Linux and needs manual plugin installation before it monitors anything. Zabbix requires trigger logic and item configuration upfront. Both are capable tools, but they assume someone on your team has time and inclination to do that work.  

PRTG ships with a guided setup wizard, pre-configured device templates, and runs on Windows. Most environments are producing real data within the first day. Whether that matters depends on your team honestly, and how that initial setup time gets valued against everything else competing for it.

Does PRTG support NetFlow and SNMP monitoring in the free version?

Yes, both. SNMP and flow-based monitoring (NetFlow, sFlow, jFlow, IPFIX) are available in the trial and the freeware edition. The 100-sensor limit in the freeware edition applies across everything, so coverage depends on how many sensors your specific devices need. During the 30-day trial none of that applies.

How many network devices can I monitor with PRTG for free?

During the trial, no limits at all.  

After that the freeware edition gives you 100 sensors and the practical device count varies quite a bit depending on how you use them. A router with one interface check is very different from a Windows server monitored for CPU, memory, disk and running services. That second one can consume eight to ten sensors on its own. Map out what your environment actually needs before the trial ends, as the ceiling lands in different places for different setups.

Does PRTG run on Linux or macOS, or only on Windows?

The on-premises installation runs on Windows. No Linux environment needed to run PRTG itself, which is a practical difference from Nagios Core that sometimes gets overlooked when people are comparing tools.  

Monitored targets are a different question. Linux, macOS, network devices, cloud services, all covered. And if maintaining a Windows server installation isn't something your team wants to own, PRTG Hosted Monitor takes that off the table.

When does it make sense to move from the freeware edition to a paid license?

Usually when the environment grows past 100 sensors, or when you need remote probes for distributed monitoring, more reporting depth or support. Sometimes just support on its own is enough.  

Pricing scales with sensor count, so there's no cliff between free and paid. Most teams notice the limit when they start wanting more interface coverage per device or bring a new site in. The per-sensor model means you add what you need, not a tier that includes things you don't.

Paessler PRTG

Paessler PRTG

Network Monitoring Software – Version 26.1.116.1532 (February 9th, 2026)

Hosting icon

Hosting

Download for Windows and cloud-based version PRTG Hosted Monitor available

Languages icon

Languages

English, German, Spanish, French, Portuguese, Dutch, Russian, Japanese, and Simplified Chinese

test

Monitor everything

Network devices, bandwidth, servers, applications, virtual environments, remote systems, IoT, and more

test

Pricing

Choose the PRTG Network Monitor subscription that's best for you

Discover more monitoring insights and stories

Content illustration

Powerful stories from the monitoring world

  • The Dude Abides. But He's Not The Only Free Network Tool Out There.
  • Free vs Paid Network Monitoring Tools: What IT Teams Actually ...
  • Free live webinars about Paessler PRTG
Support illustration

Resources to master your monitoring challenges

  • PRTG Manual: PRTG Apps for Mobile Network Monitoring - Paessler
  • monitor free disk space in a mapped network location
  • PRTG Manual: Share Disk Free Sensor - Paessler
Solution illustration

Solutions for all your monitoring needs

  • Free Network Monitoring software with PRTG - Paessler
  • PRTG network monitoring tool - Paessler
  • Free Network Monitoring
PRTG Logo

Start Monitoring with PRTG and see how it can make your network more reliable and your job easier.

Free download
PRODUCT OVERVIEW

Products

  • Paessler PRTG
    Paessler PRTGMonitor your whole IT infrastructure
    • PRTG Network Monitor
    • PRTG Enterprise Monitor
    • PRTG Hosted Monitor
    • PRTG UVexplorer
    • PRTG extensions
      Extensions for Paessler PRTGExtend your monitoring to a new level
  • Icon Features
    FeaturesExplore all monitoring features

Monitoring with PRTG

  • Network monitoring
  • Bandwidth monitoring
  • SNMP monitoring
  • Network mapping
  • Wi-Fi monitoring
  • Server monitoring
  • Network traffic analyzer
  • NetFlow monitoring
  • Syslog server

Useful Links

  • PRTG Manual
  • Knowledge Base
  • Customer Success Stories
  • About Paessler
  • Subscribe to newsletter
  • PRTG Support
  • PRTG Consulting
  • PRTG Feedback & Roadmap

Contact

Paessler GmbH
Thurn-und-Taxis-Str. 14, 
90411 Nuremberg 
Germany

[email protected]

+49 911 93775-0

  • Contact us
©2026 Paessler GmbHTerms & ConditionsPrivacy PolicyImprintReport VulnerabilityDownload & InstallSitemap
Cyngor Gwynedd Council Cyngor Gwynedd Council Cyngor Gwynedd Council