Custom alerts and data visualization let you quickly identify and prevent troublesome network speed and latency issues.
Keep your organization on track and your network rock-steady when you leverage our response time monitoring tool. Paessler PRTG focuses on maintaining optimal performance across your servers, websites, and databases by closely monitoring their response times and informing you of any changes immediately, in multiple ways.
Get insight into the response times of all your critical network components from a single dashboard. Monitor, for example, the loading time of your website, web server, and web applications from all over the world, the amount of time needed to execute database queries, or the read and write speed of your hard disks.
Go beyond surface-level monitoring with PRTG's capability for long-term response time analyses. Uncover trends and patterns in your network performance over extended time periods with a deep dive into your response time data.
Stay informed with instant alerts from PRTG in the event of performance degradation. Sudden spikes in response time or gradual declines in server efficiency will be easy to spot, giving you the tools to quickly mitigate these issues.
Pinpoint and address bottlenecks in your network with PRTG. A growing network doesn’t have to be a pain point. By identifying areas of congestion or delay, you can make informed decisions about network upgrades or configuration changes to enhance overall performance.
Diagnose network issues by continuously tracking device, application, and server response time. Show peak response times, average response times, and other key performance metrics in real time. Visualize monitoring data in clear graphs and dashboards to identify problems more easily. Gain the visibility you need to troubleshoot slow network speed and other network performance issues.

Live traffic data graph in PRTG

Device tree view of the complete monitoring setup

Custom PRTG dashboard for keeping an eye on the entire IT infrastructure
Live traffic data graph in PRTG
Device tree view of the complete monitoring setup
“All-around winning
network monitor”
“The real beauty of PRTG is the endless possibilities it offers”
“PRTG Network Monitor
is very hard to beat”
PRTG comes with more than 250 native sensor types for monitoring your entire on-premises, cloud, and hybrid cloud environment out of the box. Check out some examples below!
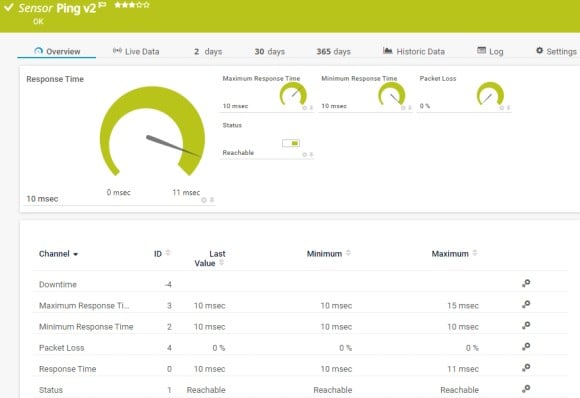
The Ping v2 sensor sends an Internet Control Message Protocol (ICMP) echo request ("ping") from the probe system to the parent device to monitor its availability. It can show the following:
• Response time
• Packet loss
• Target status
• Minimum and maximum ping time
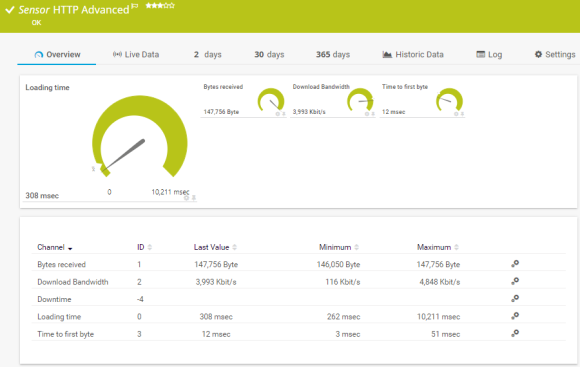
The HTTP Advanced sensor monitors the source code of a web page using HTTP. It supports authentication, content checks, and other advanced parameters. It can show the following:
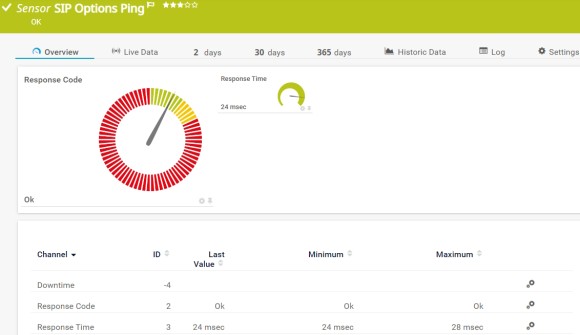
The SIP Options Ping sensor monitors the connectivity to a Session Initiation Protocol (SIP) server using SIP options "ping". The sensor sends auth and options requests to the SIP server. It can show the following:
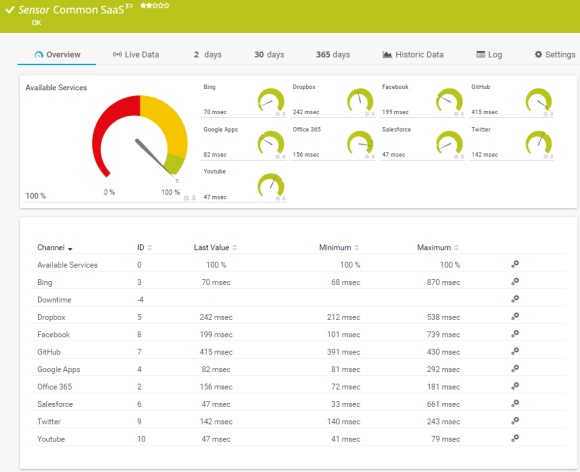
The Common SaaS sensor monitors the availability of several Software-as-a-Service (SaaS) providers. It can show the following:
See the PRTG Manual for a list of all available sensor types.

Custom alerts and data visualization let you quickly identify and prevent troublesome network speed and latency issues.
PRTG is set up in a matter of minutes and can be used on a wide variety of mobile devices.

Partnering with innovative IT vendors, Paessler unleashes synergies to create
new and additional benefits for joined customers.

Combining PRTG’s broad monitoring feature set with IP Fabric’s automated network assurance creates a new level of network visibility and reliability.

Siemon and Paessler bring together intelligent building technology and advanced monitoring and make your vision of intelligent buildings and data centers become reality.

UVexplorer integrates tightly with PRTG to bring fast and accurate network discovery, detailed device inventory, and automatic network mapping to the PRTG platform.
Real-time notifications mean faster troubleshooting so that you can act before more serious issues occur.
Network Monitoring Software – Version 24.4.102.1351 (November 12th, 2024)
Download for Windows and cloud-based version PRTG Hosted Monitor available
English, German, Spanish, French, Portuguese, Dutch, Russian, Japanese, and Simplified Chinese
Network devices, bandwidth, servers, applications, virtual environments, remote systems, IoT, and more
Choose the PRTG Network Monitor subscription that's best for you

Response time monitoring is a performance measurement practice that assesses the time it takes for a system or application to respond to a user's request. It involves tracking the duration between the initiation of a request and the receipt of the corresponding response.
Monitoring response times is crucial for identifying performance bottlenecks, optimizing system efficiency, and ensuring a positive user experience as faster response times lead to improved satisfaction and engagement and reduce downtime and disruptions of business operations.
Absolutely, PRTG is capable of monitoring the response times of various applications in addition to network devices, providing a holistic view of your network's performance.
Yes, PRTG can monitor the response times of cloud-based services, ensuring comprehensive coverage of both on-premises and cloud environments.
PRTG identifies the root causes of slow response times, such as high CPU load or bandwidth bottlenecks, enabling targeted actions to optimize network performance.
Yes, you can customize the threshold values for alerts in PRTG, allowing you to define what constitutes an abnormal response time for your specific network environment.
In PRTG, “sensors” are the basic monitoring elements. One sensor usually monitors one measured value in your network, for example the traffic of a switch port, the CPU load of a server, or the free space on a disk drive. On average, you need about 5-10 sensors per device or one sensor per switch port.
Paessler conducted trials in over 600 IT departments worldwide to tune its network monitoring software closer to the needs of sysadmins. The result of the survey: over 95% of the participants would recommend PRTG – or already have.

Paessler PRTG is used by companies of all sizes. Sysadmins love PRTG because it makes their job a whole lot easier.
Bandwidth, servers, virtual environments, websites, VoIP services – PRTG keeps an eye on your entire network.
Everyone has different monitoring needs. That’s why we let you try PRTG for free.