Custom alerts and data visualizations let you quickly identify and prevent traffic bottlenecks, packet loss, and other network performance issues.
If you're running a busy network, monitoring traffic flow data can feel like trying to count every single car passing through an intersection at high-speed during rush hour. Chances are, instead of helping it work more efficiently, the juice you need to power your monitoring software might end up contributing to it crashing.
Paessler PRTG's sFlow monitoring packs the depth of capabilities you'd expect from a top-of-the-range tool in a low-resource, easy-to-use, scalable solution. Keep an eye on network performance stats, use traffic analysis, troubleshoot issues, and make sure traffic keeps flowing freely, without straining your already limited resources.

No more fiddling about with standalone sFlow collectors, viewers, and analyzers. PRTG is your comprehensive network monitoring tool, giving you a single, unified view.
Plus, it works with any sFlow-compatible device, including devices made by Alcatel-Lucent Enterprise, Cisco, Dell, HPE, and Netgear.
Keep an eye on your network 24 hours a day, 7 days a week. PRTG doesn't take holidays, sick days, or sleep breaks.
Which means you can do so, safe in the knowledge PRTG automatically alerts you about network problems and protocol errors by email, push notification, SMS, and other methods – often before costly failures occur.
Keeping your network in top shape has never been easier. PRTG puts key performance stats at your fingertips, empowering you to allocate resources more efficiently, improve security, and make short work of any issues that are draining your resources.
Easily detect, for example, bandwidth bottlenecks, reduce unnecessary traffic, and accelerate business processes and maximize service availability through bandwidth optimization.
Diagnose network issues by continuously tracking bandwidth usage, data traffic, and other network activities. Show bandwidth eaters by IP address (IPv4 or IPv6) or port number, dropped sFlow packets, corrupted packet headers, and other key metrics in real time. Visualize monitoring data in clear graphs and dashboards to identify problems more easily. Gain the overview you need to troubleshoot performance problems and routing issues, and optimize your network.

Live traffic data graph in PRTG

Device tree view of the complete monitoring setup

Custom PRTG dashboard for keeping an eye on the entire IT infrastructure
Live traffic data graph in PRTG
Device tree view of the complete monitoring setup
“All-around winning
network monitor”
“The real beauty of PRTG is the endless possibilities it offers”
“PRTG Network Monitor
is very hard to beat”
PRTG comes with more than 250 native sensor types for monitoring your entire on-premises, cloud, and hybrid cloud environment out of the box. Check out some examples below!
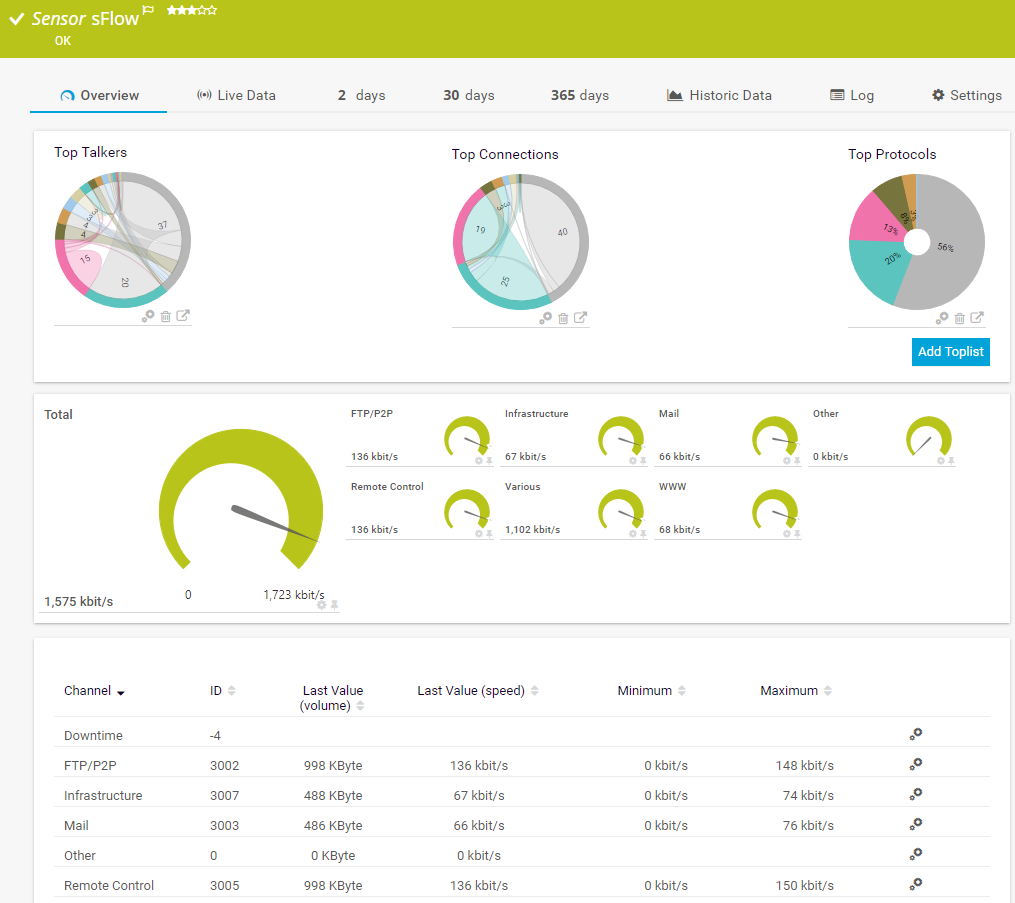
The sFlow sensor receives traffic data from an sFlow v5-compatible device and shows the traffic by type. This sensor has several filter options to divide traffic into different channels. It can show the following and more:
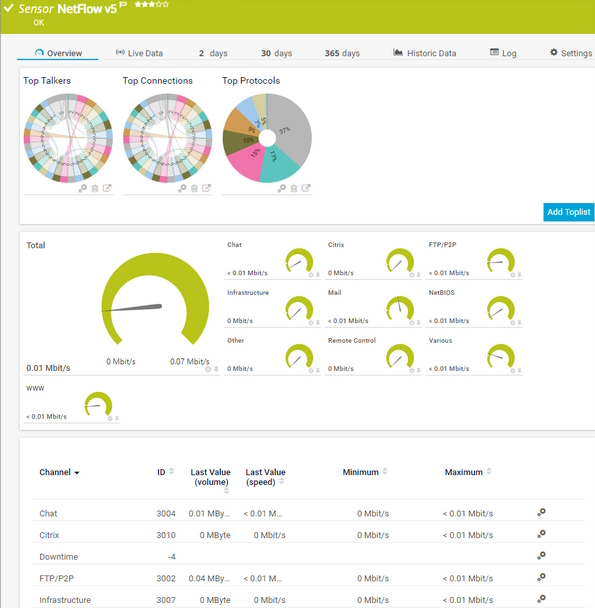
The NetFlow v5 sensor receives traffic data from a NetFlow v5-compatible device and shows the traffic by type. This sensor has several filter options to divide traffic into different channels. It can show the following and more:
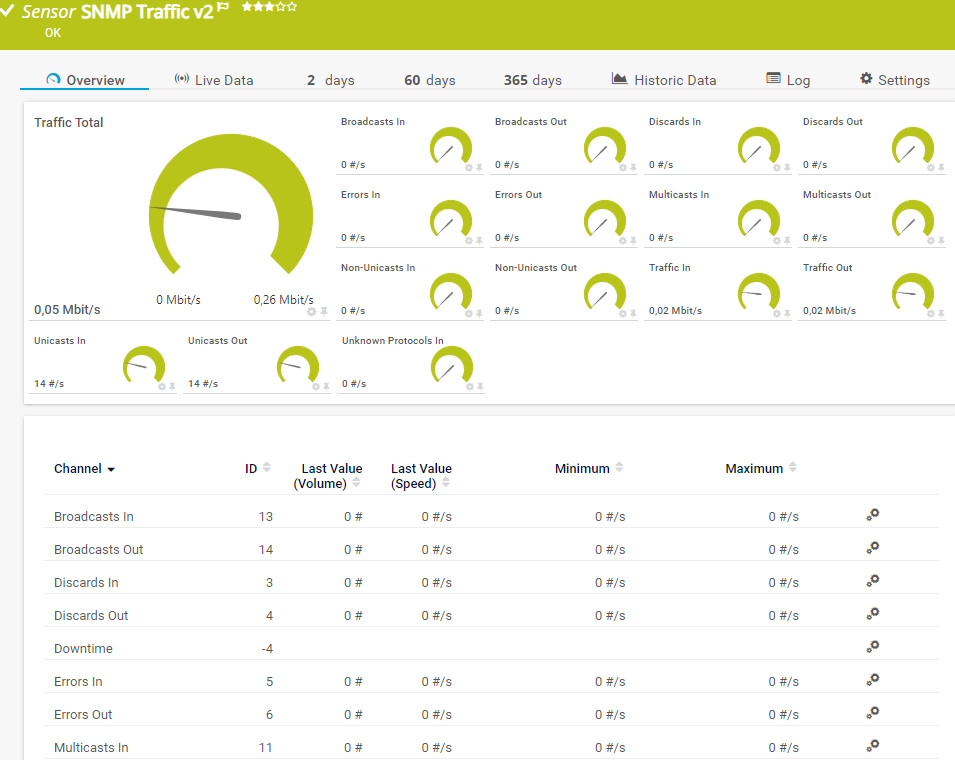
The SNMP Traffic v2 sensor monitors bandwidth and traffic on a device. It can show the following:
See the PRTG Manual for a list of all available sensor types.

Real-time notifications mean faster troubleshooting so that you can act before more serious issues occur.
PRTG is set up in a matter of minutes and can be used on a wide variety of mobile devices.


“Excellent tool for detailed monitoring. Alarms and notifications work greatly. Equipment addition is straight forward and server initial setup is very easy. ...feel safe to purchase it if you intend to monitor a large networking landscape.”
Partnering with innovative IT vendors, Paessler unleashes synergies to create
new and additional benefits for joined customers.

Combining PRTG’s broad monitoring feature set with IP Fabric’s automated network assurance creates a new level of network visibility and reliability.

Rhebo and PRTG offer a comprehensive monitoring solution for IT and OT environments: from condition monitoring through to anomaly and threat detection.

UVexplorer integrates tightly with PRTG to bring fast and accurate network discovery, detailed device inventory, and automatic network mapping to the PRTG platform.
Custom alerts and data visualizations let you quickly identify and prevent traffic bottlenecks, packet loss, and other network performance issues.
Network Monitoring Software – Version 24.4.102.1351 (November 12th, 2024)
Download for Windows and cloud-based version PRTG Hosted Monitor available
English, German, Spanish, French, Portuguese, Dutch, Russian, Japanese, and Simplified Chinese
Network devices, bandwidth, servers, applications, virtual environments, remote systems, IoT, and more
Choose the PRTG Network Monitor subscription that's best for you

sFlow is a sampling technology for network monitoring invented by InMon. It works similarly to Cisco’s NetFlow and was first introduced by HPE in 2001. It stands for “sampled flow,” and uses statistical samples of data traffic to ensure scalability for interfaces with large amounts of data.
sFlow is designed to monitor network traffic with minimal impact on scarce resources. It does this by analyzing random samples of traffic (sFlow sampling) instead of capturing every packet. sFlow's default sampling rate is 8192, but we recommend adjusting it to suit your network's requirements. The lower the sampling rate, the lighter the load (and vice versa, of course).
sFlow consists of several key components that work together to provide scalable network traffic monitoring. These components include:
sFlow monitoring is a network monitoring technology used to capture and analyze traffic data in real-time. It operates by sampling packets flowing through network devices, such as switches and routers, to provide insights into network traffic patterns and performance. Unlike traditional methods that inspect every packet, sFlow uses statistical sampling to efficiently monitor network traffic without overwhelming the monitoring system.
It collects key information about network traffic, including source and destination IP addresses, protocols, and traffic volumes, enabling network administrators to identify anomalies, troubleshoot issues, and optimize network performance. sFlow is widely used in large-scale networks for its scalability and low overhead.
The biggest benefit of sFlow monitoring is that it keeps CPU load, bandwidth use, and memory utilization to an absolute minimum – great if your resources are limited or you operate in a sensitive environment. Of course, sFlow monitoring also has other compelling benefits. Having real-time visibility into your network's health makes it easier to allocate resources effectively, troubleshoot issues, and keep everything running smoothly.
sFlow is based on NetFlow, but differs from it in two key ways. First, it's an open standard. And, second, it monitors random samples of data, while NetFlow monitors every packet. IPFIX is also an open standard based on NetFlow. But, where sFlow uses sampling, IPFIX is template-based (though it can be configured to work with random samples, too).
Whether your network has sFlow, NetFlow, or IPFIX-compatible devices (or a mix of all three), PRTG has you covered!
In PRTG, “sensors” are the basic monitoring elements. One sensor usually monitors one measured value in your network, for example the traffic of a switch port, the CPU load of a server, or the free space on a disk drive. On average, you need about 5-10 sensors per device or one sensor per switch port.
Paessler conducted trials in over 600 IT departments worldwide to tune its network monitoring software closer to the needs of sysadmins. The result of the survey: over 95% of the participants would recommend PRTG – or already have.

Paessler PRTG is used by companies of all sizes. Sysadmins love PRTG because it makes their job a whole lot easier.
Bandwidth, servers, virtual environments, websites, VoIP services – PRTG keeps an eye on your entire network.
Everyone has different monitoring needs. That’s why we let you try PRTG for free.