• Company
    • About Us
    • Case Studies
    • Press Center
    • Careers
    • Blog
    • Contact us
  • Contact us
  • Login
 
  • English
    • Deutsch
    • Español
    • Français
    • Italiano
    • Português
Paessler
                    - The Monitoring Experts
  • Products
    • Paessler PRTG
      Paessler PRTGMonitor your whole IT infrastructure
      • PRTG Network Monitor
      • PRTG Enterprise Monitor
      • PRTG Hosted Monitor
      • PRTG UVexplorer
      • PRTG extensionsExtensions for Paessler PRTGExtend your monitoring to a new level
    • Icon Features
      FeaturesExplore all monitoring features
      • Maps & dashboards
      • Alerts & notifications
      • Multiple user interfaces
      • Distributed monitoring
      • Customizable reporting
  • Solutions
    • Industries
      IndustriesMonitor various industry sectors
      • Industrial
      • Healthcare
      • Data Center
      • Education
      • Finance
      • Government
    • IT Topics
      IT TopicsMonitor all areas of IT
      • Network Monitoring
      • Bandwidth Monitoring
      • SNMP Monitor
      • Network Mapping
      • WiFi Monitoring
      • Server Monitoring
  • Pricing
  • Resources
    • Getting Started
      Getting StartedModules for self-paced learning
    • How-to Guides
      How-to GuidesGet the most out of PRTG
    • Videos & Webinars
      Videos & WebinarsLearn from Paessler experts
    • IT  Knowledge
      IT KnowledgeExpand your IT knowledge
    • PRTG Manual
      PRTG ManualFull documentation
    • Knowledge Base
      Knowledge BaseShare community knowledge
    • PRTG Sensor Hub
      PRTG Sensor HubGet sensors, scripts & templates
    • Trainings
      PRTG TrainingLearn how to work with PRTG
  • Partners
    • Icon Handshake
      Become a PartnerFor resellers and channel partners
    • Icon MSP
      Become an MSPDeliver monitoring as a managed service
    • icon partner
      Partner PortalLog in to your partner account
    • Deal Registration
      Deal RegistrationRegister your sales opportunities
    • icon search
      Find a PartnerFind partners selling Paessler products
    • icon technology
      Technology AlliancesSee Paessler technology partnerships
    • Partner HubTools for Your Success
  • Company
    • About Us
    • Case Studies
    • Press Center
    • Careers
    • Blog
    • Contact us
  • Contact us
  • Login
  • English
    • Deutsch
    • Español
    • Français
    • Italiano
    • Português
  • Get a quote
  • Free trial
  1. Home>
  2. IT Topics>
  3. Application>
  4. Linux Network Monitoring

Linux Network Monitoring with PRTG

Keep your Linux system stable and secure

  • Monitor network connections, server load, hardware health, and other network statistics
  • Spot and fix performance bottlenecks in your Linux environment
  • Compatible with most Linux distributions and other Unix-based systems
Free download
PRODUCT OVERVIEW

Our Users Give Top Ratings for Monitoring With Paessler PRTG

Gartner peer insights
spiceworks
G2
Capterra

PRTG Linux network monitoring: What you will find on this page

Table of content

    PRTG makes maintaining your Linux network's health as easy as it gets

    Custom alerts and data visualization let you quickly identify and prevent Linux server and network performance issues.

    Free download
    PRODUCT OVERVIEW

    Introducing: fuss-free Linux network monitoring software

    Running a Linux/Unix network?

    Now, you can keep an eye on key metrics like network traffic, bandwidth usage, system and device status, and time synchronization via NTP, optimize performance, and troubleshoot issues without having to install or modify anything on your monitored devices themselves.

    Simple to set up and use, but extremely powerful and highly customizable, our Linux network monitoring tool Paessler PRTG uses SNMP and SSH protocols, as well as custom scripts to securely send data to your PRTG servers, where you can keep track of your network's health and get alerted as soon as something's about to go wrong.

    Table of content

    You know PRTG only as a Windows-based monitoring system? Check again! 

    PRTG now lets you monitor the health and performance of your Linux system – from your Linux system. How? With our multi-platform probe, the new PRTG remote probe for non-Windows environments (Ubuntu, Debian, CentOS, ARM, and many others). Find out more 

    What Linux network monitoring looks like in PRTG

    Diagnose network issues by continuously tracking your Linux operating system and network devices. Show server capacity, network bandwidth, free memory, and other performance monitoring metrics in real time. Visualize monitoring data in clear graphs and dashboards to identify problems more easily. Gain the overview you need to troubleshoot bottlenecks and maximize performance.

    PRTG Screenshot map aws linux windows services

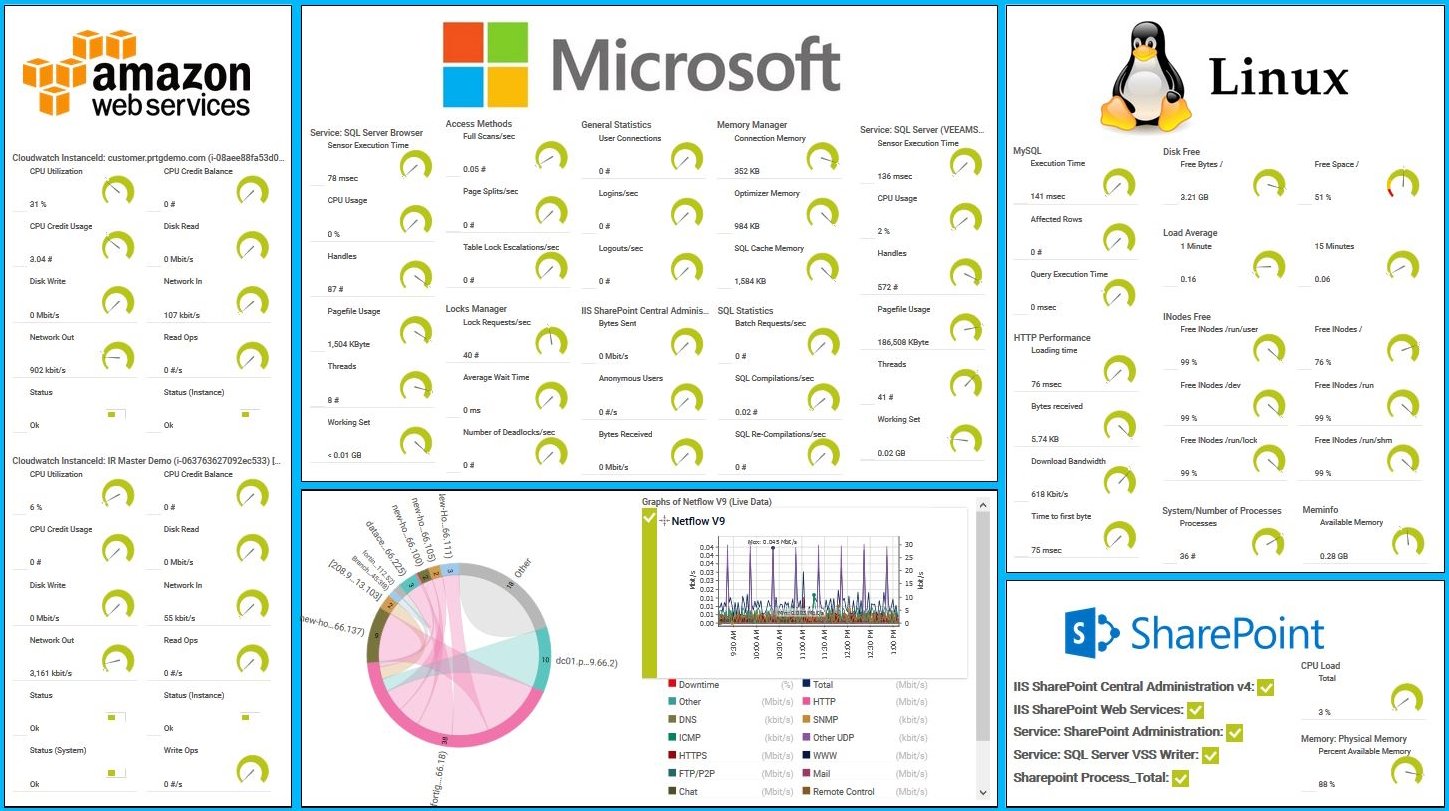
    Custom PRTG dashboard for different services

    PRTG Screenshot device tree view

    Device tree view of the complete monitoring setup

    PRTG screenshot map entire it infrastructure

    Custom PRTG dashboard for keeping an eye on the entire IT infrastructure

    PRTG screenshot graph live data traffic

    Live traffic data graph in PRTG

    Start monitoring your Linux network with PRTG and see how it can make your network more reliable and your job easier.

    Free download
    PRODUCT OVERVIEW

    IT experts agree: Paessler PRTG is a great solution for IT infrastructure monitoring

    PCMag

    “All-around winning
     network monitor”

    IT Brief

    “The real beauty of PRTG is the endless possibilities it offers”

    ITPro

    “PRTG Network Monitor 
    is very hard to beat”

    4 reasons to use PRTG as your Linux network management tool

    Icon configuration

    Super simple setup

    So easy you could do it in your sleep. The setup assistant will walk you through the process in the graphical web interface, and the auto-discovery detects Linux devices by IP address or DNS name in your LAN. Once you're up and running, you can customize the monitoring environment to suit your requirements.

    Icon alarm

    Real-time alerts

    Pick your preferred Linux server performance thresholds and get notified the second your Linux network usage is at risk of going under or exceeding them, so you can fix issues before they cause disruptions (and leave the office at a reasonable hour).

    Icon smartphone

    Complete visibility

    A thorough view of your Linux network, at your fingertips. Whether you need to check real-time server capacity, free hard disk space, RAM, or other key network health stats, PRTG's customizable maps and dashboards make the process quick and easy.

    Icon maps

    Better results

    Secure and optimize your Linux network with bandwidth monitoring, while reducing your workload. Need we say more? With PRTG working in the background 24/7,  you'll save time, be proactive, and have the peace of mind that nothing will fall through the cracks.

    Explore our preconfigured PRTG sensors for linux network monitoring

    PRTG comes with more than 250 native sensor types for monitoring your entire on-premises, cloud, and hybrid cloud environment out of the box. Check out some examples below!

    SNMP Linux Meminfo

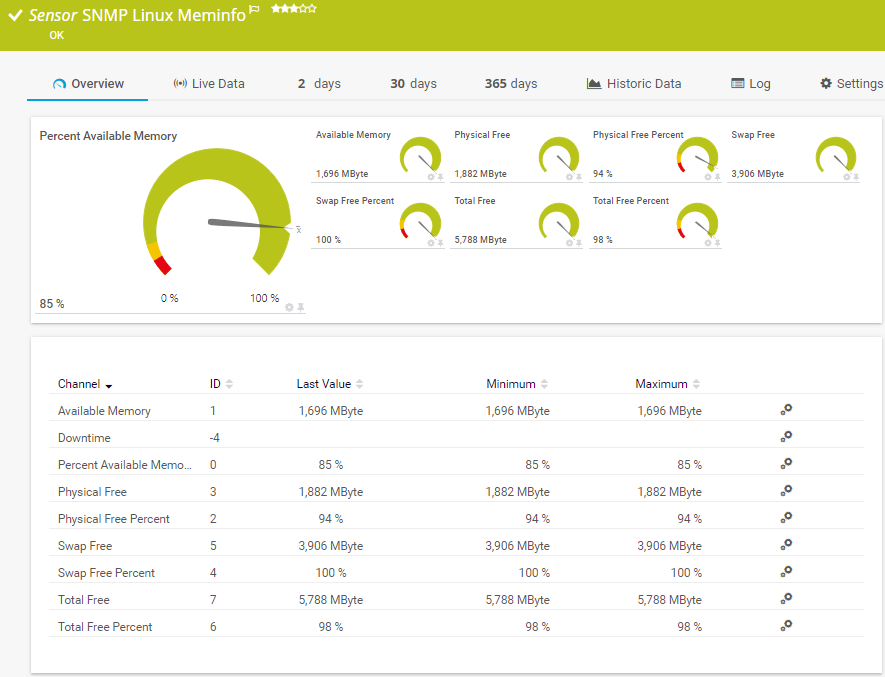
    The SNMP Linux Meminfo sensor monitors the memory usage of a Linux/Unix system. It can show the following:

    • Available memory
    • Free physical memory
    • Free swap memory
    • Total free memory
    SNMP Linux Meminfo
    SNMP Linux Meminfo

    SNMP Linux Load Average

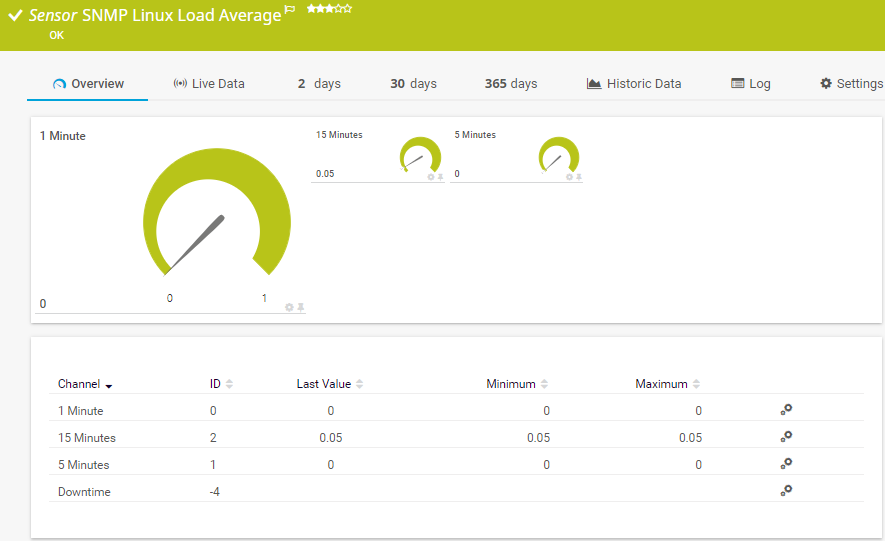
    The SNMP Linux Load Average sensor monitors the system load average of a Linux/Unix system. It can show the following:

    • Average system load within a 1-minute interval
    • Average system load within a 5-minute interval
    • Average system load within a 15-minute interval
    SNMP Linux Load Average
    SNMP Linux Load Average

    SSH Disk Free

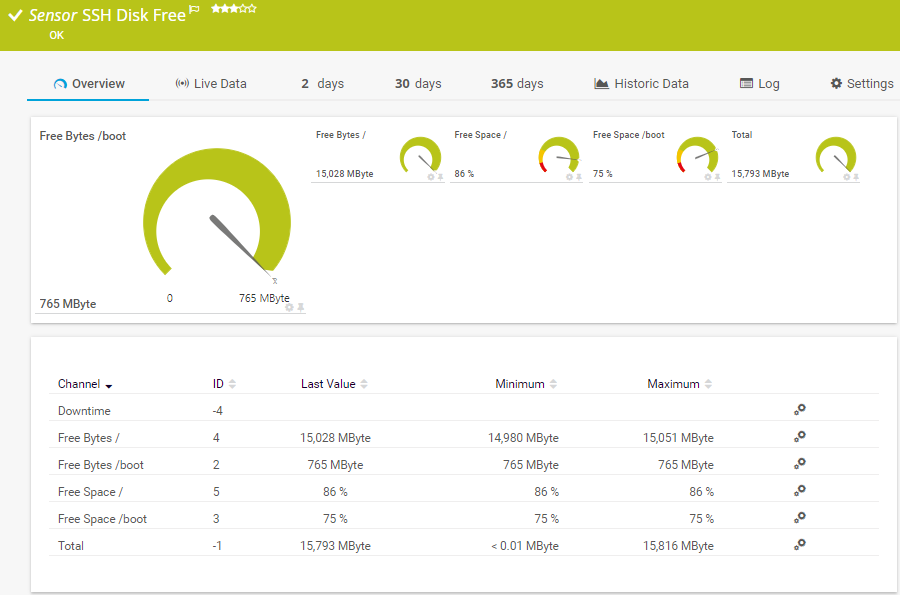
    The SSH Disk Free sensor monitors the free space on disks of a Linux/Unix system using Secure Shell (SSH). It can show the following:

    • Free space
    • Total space
    SSH Disk Free
    SSH Disk Free

    SSH Script Advanced

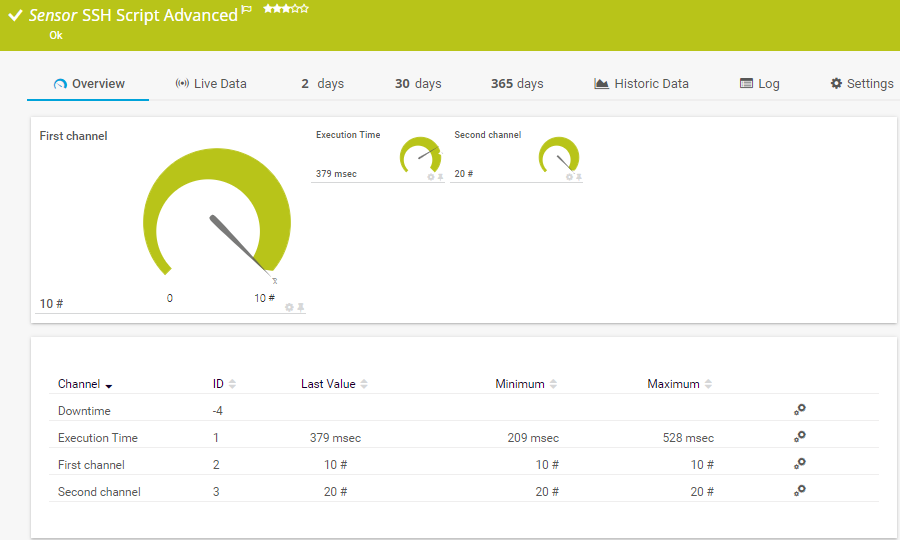
    The SSH Script Advanced sensor connects to a Linux/Unix system via Secure Shell (SSH) and executes a script file that is located on the target system. This option is available as part of the PRTG API. It can show the following:

    • Execution time
    • Values that the script file returns in several channels
    SSH Script Advanced
    SSH Script Advanced

    See the PRTG Manual for a list of all available sensor types.

    PRTG Is Compatible With All Major Vendors, Products, and Systems

    compatible with all major vendors, products, and systems

    Find the root cause of the problem with our PRTG Linux network monitoring solution

    Real-time notifications mean faster troubleshooting so that you can act before more serious issues occur.

    Free download
    PRODUCT OVERVIEW

    “Since using PRTG, we have matured how we report out overall application uptime, maintenance, and mean time between failure for all critical applications to our board of directors. PRTG allows us to not just look at a single event, but to leverage historical data to prevent future failures and to measure how we are making improve­ments over time.”

    Bill Sorrells, CTO
    Dayton Children's Hospital

    “We have found these sophisticated levels of monitoring to be highly effective, improving the end user’s experience of the systems and applications in use, giving us the opportunity to provide a proactive resolution rather than having the end user raise issues.”

    Saif Akil, Head of Service Management
    Acurus

    “Before PRTG, applications and hardware all gave messages, but all separately, so we had to search through hundreds of e-mails to find the problem. It was always only afterwards that we saw that something was going on within the infrastructure. To mitigate the issue, we also considered other software. PRTG stood out because of its user-friendliness, flexibility and minimal consultancy investment.”

    Wim Vandenberghe, ICT Manager
    Soenen Golfkarton

    Your Linux network analyzer at a glance – even on the go

    Set up PRTG in minutes and use it on almost any mobile device.

    device overview
    Gartner peer insights

    “Excellent tool for detailed monitoring. Alarms and notifications work greatly. Equipment addition is straight forward and server initial setup is very easy. ...feel safe to purchase it if you intend to monitor a large networking landscape.”

    Read the complete review at Gartner Peer Insights

    Create innovative solutions with Paessler’s IT partners

    Partnering with innovative IT vendors, Paessler unleashes synergies to create
    new and additional benefits for joined customers.

    IP Fabric

    IP Fabric

    Combining PRTG’s broad monitoring feature set with IP Fabric’s automated network assurance creates a new level of network visibility and reliability.

    Read more
    ScriptRunner

    ScriptRunner

    With ScriptRunner Paessler integrates a powerful event automation platform into PRTG Network Monitor.

    Read more
    UVnetworks

    UVnetworks

    UVexplorer integrates tightly with PRTG to bring fast and accurate network discovery, detailed device inventory, and automatic network mapping to the PRTG platform.

    Read more

    PRTG makes maintaining your Linux network's health as easy as it gets

    Custom alerts and data visualization let you quickly identify and prevent Linux server and network performance issues.

    Free download
    PRODUCT OVERVIEW
    Paessler PRTG

    Paessler PRTG

    Network Monitoring Software – Version 26.1.116.1532 (February 9th, 2026)

    Hosting icon

    Hosting

    Download for Windows and cloud-based version PRTG Hosted Monitor available

    Languages icon

    Languages

    English, German, Spanish, French, Portuguese, Dutch, Russian, Japanese, and Simplified Chinese

    test

    Monitor everything

    Network devices, bandwidth, servers, applications, virtual environments, remote systems, IoT, and more

    test

    Pricing

    Choose the PRTG Network Monitor subscription that's best for you

    Discover more monitoring insights and stories

    Content illustration

    Powerful stories from the monitoring world

    • Video: PRTG Network Monitor – Smart Setup
    • Monitoring FortiGate Firewalls with Paessler PRTG
    • Easy ways to quickly test your bandwidth
    Support illustration

    Resources to master your monitoring challenges

    • PRTG Manual: Available Sensor Types - Paessler
    • Application Monitoring LINUX,Windows based,MAC OS with PRTG ...
    • PRTG Manual: SNMP Linux Load Average v2 Sensor - Paessler
    Solution illustration

    Solutions for all your monitoring needs

    • Bandwidth Monitoring
    • NetFlow Monitoring
    • CPU Monitoring

    Linux Network Monitoring: FAQ


    What is PRTG Linux network monitoring?

    Linux monitoring involves the continuous observation and analysis of system performance, resource utilization, and application behavior on Linux-based operating systems. It includes tracking various metrics such as CPU usage, memory usage, disk I/O, and network activity to ensure optimal system operation. 

    Linux monitoring tools like Paessler PRTG provide real-time insights into system health, identify potential issues or bottlenecks, and enable proactive maintenance and troubleshooting.

    Can I install Paessler PRTG on Linux?

    Yes and no. If you use PRTG Network Monitor or PRTG Enterprise Monitor, the central PRTG server can only be installed on a Windows server. But, once you've installed the PRTG server, you can use the brand-new multi-platform probe that also runs on Linux. With this probe, you can monitor and manage your complete IT infrastructure from your Linux system. If you use PRTG Hosted Monitor, you do not need a dedicated Windows server at all.

    How much does PRTG Linux network monitoring cost?

    We're so confident you'll love PRTG that it comes with a free, no-obligation 30-day trial. Should you decide to keep using it, you can choose from:

    • An on-premises, subscription-based PRTG Network Monitor license – ideal for small to medium-sized organizations
    • A cloud-based PRTG Hosted Monitor subscription
    • An on-premises, subscription-based PRTG Enterprise Monitor license that supports unlimited devices – ideal for large enterprises
    What is a sensor in PRTG?

    In PRTG, “sensors” are the basic monitoring elements. One sensor usually monitors one measured value in your network, for example the traffic of a switch port, the CPU load of a server, or the free space on a disk drive. On average, you need about 5-10 sensors per device or one sensor per switch port.

    We asked: would you recommend PRTG? Over 95% of our customers say yes!

    Paessler conducted trials in over 600 IT departments worldwide to tune its network monitoring software closer to the needs of sysadmins. The result of the survey: over 95% of the participants would recommend PRTG – or already have.

    recommendation

    Still not convinced?

    Love

    More than 500,000 sysadmins love PRTG

    Paessler PRTG is used by companies of all sizes. Sysadmins love PRTG because it makes their job a whole lot easier.

    PRTG

    Monitor your entire IT infrastructure

    Bandwidth, servers, virtual environments, websites, VoIP services – PRTG keeps an eye on your entire network.

    test

    Try Paessler PRTG for free

    Everyone has different monitoring needs. That’s why we let you try PRTG for free.

    PRTG Logo

    Start monitoring your Linux network with PRTG and see how it can make your network more reliable and your job easier.

    Free download
    PRODUCT OVERVIEW

    Products

    • Paessler PRTG
      Paessler PRTGMonitor your whole IT infrastructure
      • PRTG Network Monitor
      • PRTG Enterprise Monitor
      • PRTG Hosted Monitor
      • PRTG UVexplorer
      • PRTG extensions
        Extensions for Paessler PRTGExtend your monitoring to a new level
    • Icon Features
      FeaturesExplore all monitoring features

    Monitoring with PRTG

    • Network monitoring
    • Bandwidth monitoring
    • SNMP monitoring
    • Network mapping
    • Wi-Fi monitoring
    • Server monitoring
    • Network traffic analyzer
    • NetFlow monitoring
    • Syslog server

    Useful Links

    • PRTG Manual
    • Knowledge Base
    • Customer Success Stories
    • About Paessler
    • Subscribe to newsletter
    • PRTG Support
    • PRTG Consulting
    • PRTG Feedback & Roadmap

    Contact

    Paessler GmbH
    Thurn-und-Taxis-Str. 14, 
    90411 Nuremberg 
    Germany

    [email protected]

    +49 911 93775-0

    • Contact us
    ©2026 Paessler GmbHTerms & ConditionsPrivacy PolicyImprintReport VulnerabilityDownload & InstallSitemap
    PRTG Network Monitor PRTG Network Monitor PRTG Network Monitor