Custom alerts and data visualization let you quickly identify and prevent server performance issues.
Paessler PRTG offers a comprehensive, all-in-one solution for Microsoft Windows server performance monitoring. It provides IT professionals with the tools they need to ensure optimal performance and uptime of their Windows server environment. PRTG goes beyond basic monitoring, offering real-time insights into every aspect of your Windows infrastructure.
Whether you're managing Windows servers for a small business network or a large enterprise environment, PRTG adapts to your needs, offering scalable monitoring solutions that grow with your organization. By centralizing your monitoring efforts, the Windows server monitoring software PRTG helps improve IT operations, reduce downtime, and increase overall efficiency in managing servers and related services.

PRTG provides in-depth insights into your Microsoft Windows server performance. It tracks CPU usage, memory utilization, disk space, and I/O performance in real-time. PRTG monitors Windows services, event logs, Active Directory health, and performance of IIS and SQL Server. Instant alerts keep you informed of critical changes, ensuring your entire Windows ecosystem runs smoothly.
Stay ahead of potential Windows server issues with advanced real-time alerting. Set custom thresholds for various Windows server performance metrics and receive instant notifications through multiple channels. PRTG can trigger notifications and execute scripts in response to detected issues, reducing the time to initiate problem-solving.
PRTG adapts to your infrastructure needs, offering versatile deployment options. Monitor on-premises Microsoft Windows servers, track cloud-based servers in Azure, or manage hybrid environments - all from a single, unified interface.
Diagnose network issues by continuously tracking server health and performance. Show CPU usage, memory utilization, disk space, and other key metrics in real time. Visualize monitoring data in clear graphs and dashboards to identify problems more easily. Gain the overview you need to troubleshoot bottlenecks, service failures, and resource constraints.

Live traffic data graph in PRTG
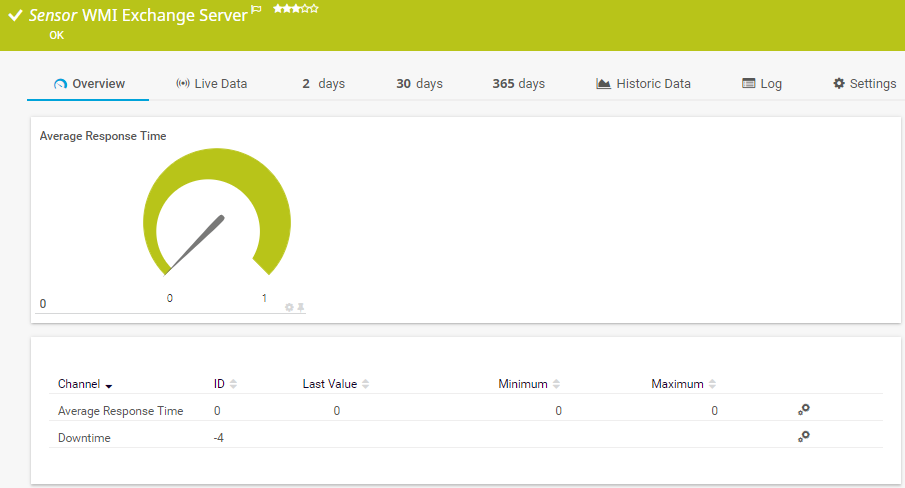
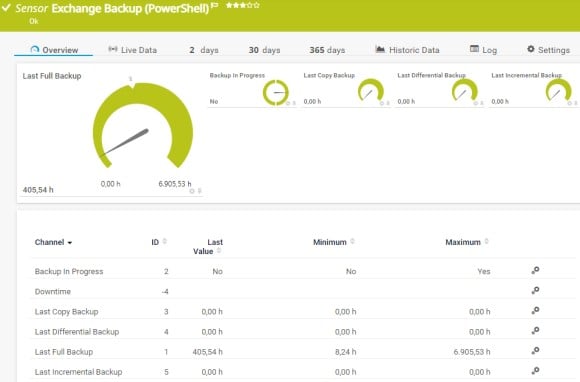
Detail view with our WMI exchange sensor

Device tree view of the complete monitoring setup

Custom PRTG dashboard for keeping an eye on the entire IT infrastructure
Live traffic data graph in PRTG
Detail view with our WMI exchange sensor
“All-around winning
network monitor”
“The real beauty of PRTG is the endless possibilities it offers”
“PRTG Network Monitor
is very hard to beat”
Get started quickly with PRTG thanks to its user-friendly interface. The auto-discovery feature finds Windows servers automatically, while pre-configured sensors and templates allow for rapid deployment of real-time monitoring solutions.
Create personalized dashboards and generate detailed reports on Windows server performance and uptime. Check performance data at a glance and access historical information for trend analysis and data-driven decision-making, helping you identify potential issues before they affect performance.
PRTG works well with your existing tools, offering API access for integration with other systems. It supports real-time monitoring of virtual machines, containers, and even Linux servers alongside Windows for complete infrastructure visibility.
PRTG comes with more than 250 native sensor types for monitoring your entire on-premises, cloud, and hybrid cloud environment out of the box. Check out some examples below!
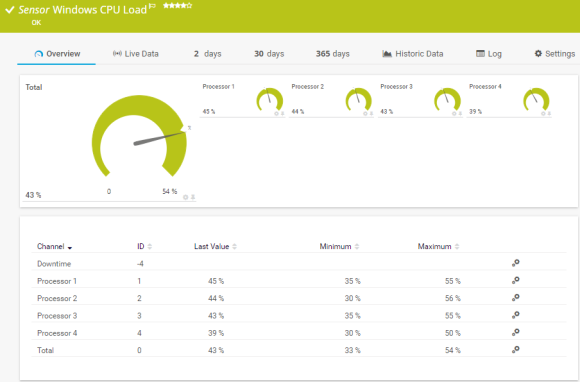
The Windows CPU Load sensor monitors the CPU load on a system via Windows Management Instrumentation (WMI) or Windows performance counters. It can show the following:
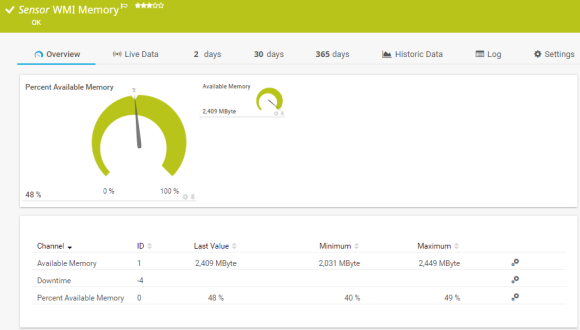
The WMI Memory sensor monitors available (free) system memory on Windows systems. It can show the following:
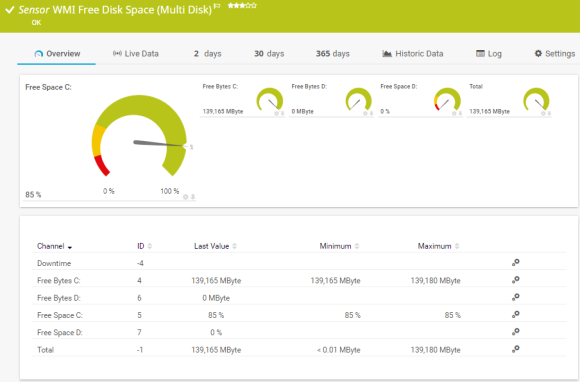
The WMI Free Disk Space (Multi Disk) sensor monitors the free disk space of one or more drives. It can show the following:
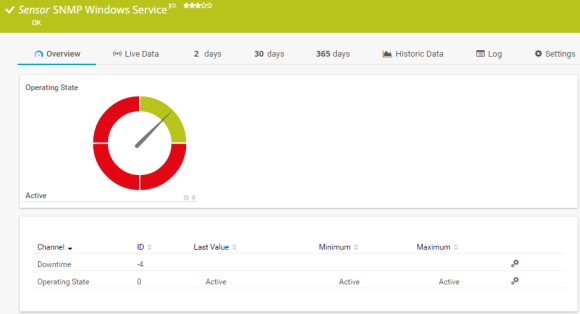
The SNMP Windows Service sensor monitors a Windows service. It can show the following:
The Event Log (Windows API) sensor monitors event log entries via the Windows API. It can show the following:
See the PRTG Manual for a list of all available sensor types.

Custom alerts and data visualization let you quickly identify and prevent server performance issues.
PRTG is set up in a matter of minutes and can be used on a wide variety of mobile devices.

Partnering with innovative IT vendors, Paessler unleashes synergies to create
new and additional benefits for joined customers.
A combination of Orchestra and PRTG provides the ideal solution to monitor the traditional IT Infrastructure as well as the central communication server in hospitals and industrial environments.

Paessler and Plixer provide a complete solution adding flow and metadata analysis to a powerful network monitoring tool.
PATLITE, as a manufacturer of visual and audible signaling devices, uses Paessler PRTG to ensure smooth plant operations.
Real-time notifications mean faster troubleshooting so that you can act before more serious issues occur.
Network Monitoring Software – Version 24.4.102.1351 (November 12th, 2024)
Download for Windows and cloud-based version PRTG Hosted Monitor available
English, German, Spanish, French, Portuguese, Dutch, Russian, Japanese, and Simplified Chinese
Network devices, bandwidth, servers, applications, virtual environments, remote systems, IoT, and more
Choose the PRTG Network Monitor subscription that's best for you
PRTG supports various authentication methods, including Active Directory integration, ensuring secure access to your Microsoft Windows servers. It can use domain credentials, local Windows accounts, or specific service accounts for monitoring.
PRTG also supports multi-factor authentication for added security, and its rights management system allows you to control access to sensitive monitoring data, aligning with your organization's security policies.
Yes, PRTG can monitor a wide range of Windows performance counters, allowing for detailed insights into server health and performance. It can track system-level counters like CPU usage, memory, and disk utilization, as well as application-specific counters for services like IIS, SQL Server, and Exchange.
If you use, for example the PRTG WMI sensor, you can access thousands of performance counters, and you can easily create custom sensors to monitor specific counters relevant to your environment.
Absolutely! PRTG allows you to create custom sensors using PowerShell or other scripting languages to monitor unique aspects of your Windows server environment. This flexibility lets you monitor proprietary applications, custom services, or specific business processes.
PRTG provides extensive documentation and examples to help you develop custom sensors, and its active user community often shares scripts and best practices for unique monitoring scenarios.
PRTG offers flexible, transparent pricing based on the number of sensors needed, covering both on-premises and cloud environments like Azure. All functionalities, including Windows server monitoring and Azure integration, are included in every license.
PRTG provides comprehensive monitoring for Windows Servers hosted in Azure, giving you a unified view of your entire infrastructure. Paessler offers various license sizes to suit organizations of all sizes, whether monitoring local servers, cloud resources, or hybrid setups.
With detailed Windows server monitoring, historical performance data analysis, and customizable alerting system PRTG can be essential for quickly identifying and resolving server issues, minimizing downtime, and optimizing overall performance.
Its comprehensive sensor data helps identify the root cause of issues, while historical performance graphs allow you to spot trends and potential problems before they become critical. The alerting system ensures you're notified of issues quickly, and its reporting features help in post-incident analysis and capacity planning.
Yes, PRTG fully supports monitoring of Windows Server clusters. It can track the health and performance of cluster nodes, shared storage, and clustered roles or services. Cluster sensors provide insights into failover events, resource allocation, and overall cluster stability, ensuring high availability of your critical Windows server infrastructure.
Absolutely. PRTG includes powerful event log monitoring capabilities for Windows servers. You can configure sensors to watch for specific events or patterns in Windows event logs, including system, application, and security logs.
PRTG can generate alerts based on these events, allowing you to respond quickly to critical issues, security incidents, or application errors logged in the Windows event system.
In PRTG, “sensors” are the basic monitoring elements. One sensor usually monitors one measured value in your network, for example the traffic of a switch port, the CPU load of a server, or the free space on a disk drive. On average, you need about 5-10 sensors per device or one sensor per switch port.
Paessler conducted trials in over 600 IT departments worldwide to tune its network monitoring software closer to the needs of sysadmins. The result of the survey: over 95% of the participants would recommend PRTG – or already have.

Paessler PRTG is used by companies of all sizes. Sysadmins love PRTG because it makes their job a whole lot easier.
Bandwidth, servers, virtual environments, websites, VoIP services – PRTG keeps an eye on your entire network.
Everyone has different monitoring needs. That’s why we let you try PRTG for free.