![]()
Docker container monitoring with PRTG
One solution to reliably monitor Docker containers and manage containerized applications
- Deploy ready-to-use Docker container sensors for detailed Docker stats
- Show an overview of your containers on customizable dashboards
- Make container monitoring easy with alarms & reports functionality
Our users give top ratings for monitoring with Paessler PRTG


PRTG Docker container monitoring: What you'll find on this page
PRTG makes Docker monitoring as easy as it gets
Custom alerts and data visualization let you quickly identify and prevent performance issues while running containers.
The three challenges in container management
![]()
Containers are short-lived and difficult to track
Containers can be quickly provisioned, moved between hosts, or destroyed, in which case their data disappears with them. By nature, this makes it hard to track changes and monitor their status, making the real time collection of data and the auto-discovery of new instances a desired, even necessary, feature.
![]()
Monitoring resource usage and allocation is crucial
Resources are shared between the host and all containers, but each container can have its own limits for resources like CPU or memory usage, and you need to monitor them individually. The host may not be using all the available resources, but a container may be struggling against its own constraints, which will lead to poor performance.
![]()
Log collection and management is essential
Container logs are sent to the default output and error streams of the host operating system. Those streams need to be collected, adequately processed, and tagged with metadata like the container name and ID for later processing. And this needs to be done for each and every container running in your network.
IT experts agree: Paessler PRTG is a great solution for IT infrastructure monitoring

“All-around winning
network monitor”

“The real beauty of PRTG is the endless possibilities it offers”

“PRTG Network Monitor
is very hard to beat”
What Docker container observability looks like in PRTG
Diagnose network issues by continuously tracking the status, availability, and uptime of your containers. Show CPU usage, application performance, data traffic, memory usage, and other key container metrics in real time. Visualize monitoring data in clear graphs and dashboards to identify problems more easily. Gain the overview you need to troubleshoot all kinds of issues with your Docker environment.
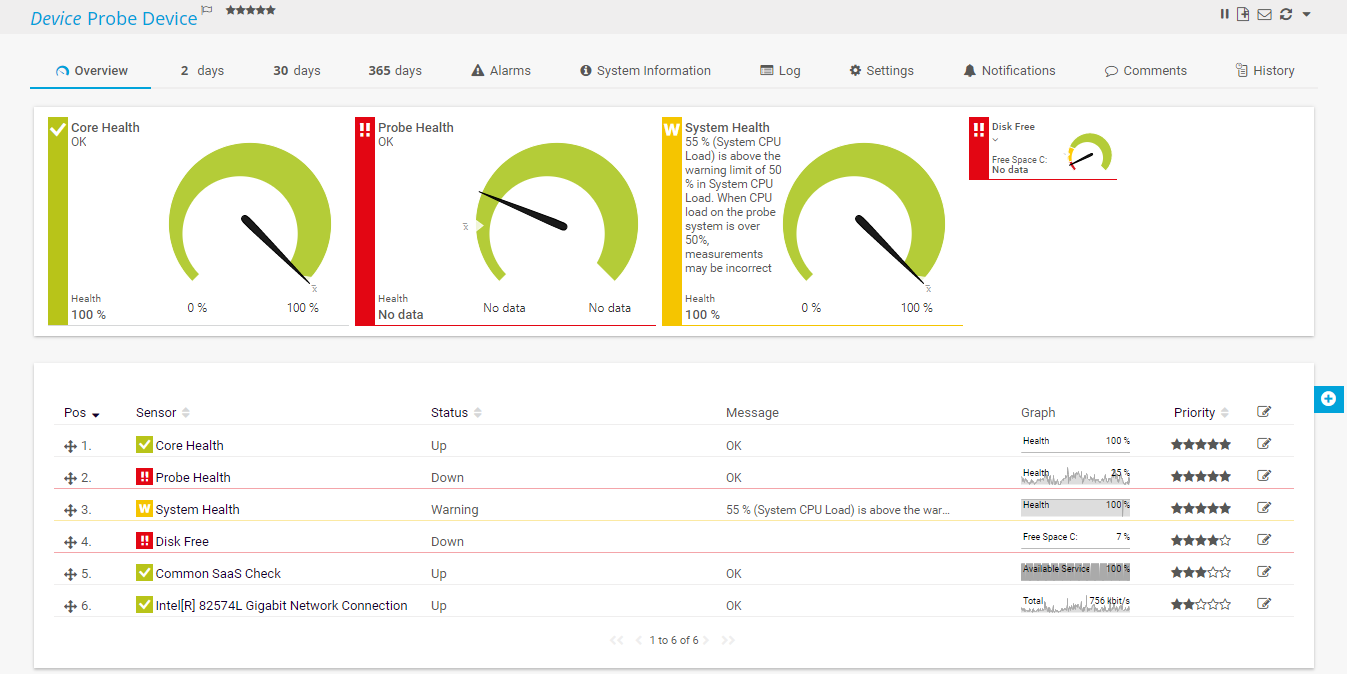
Device overview
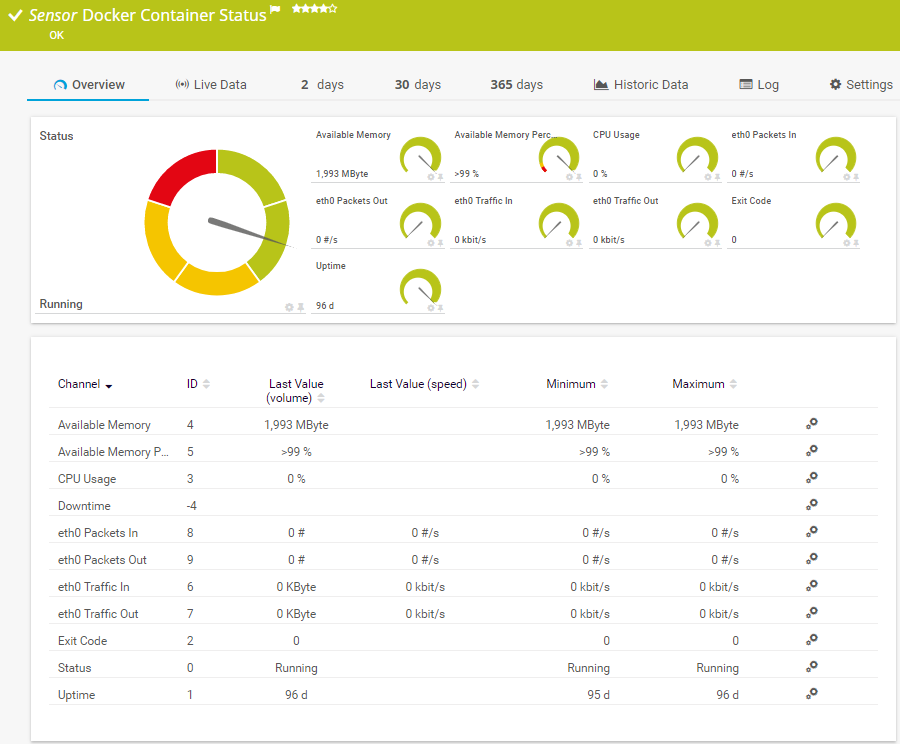
Docker Container Status sensor
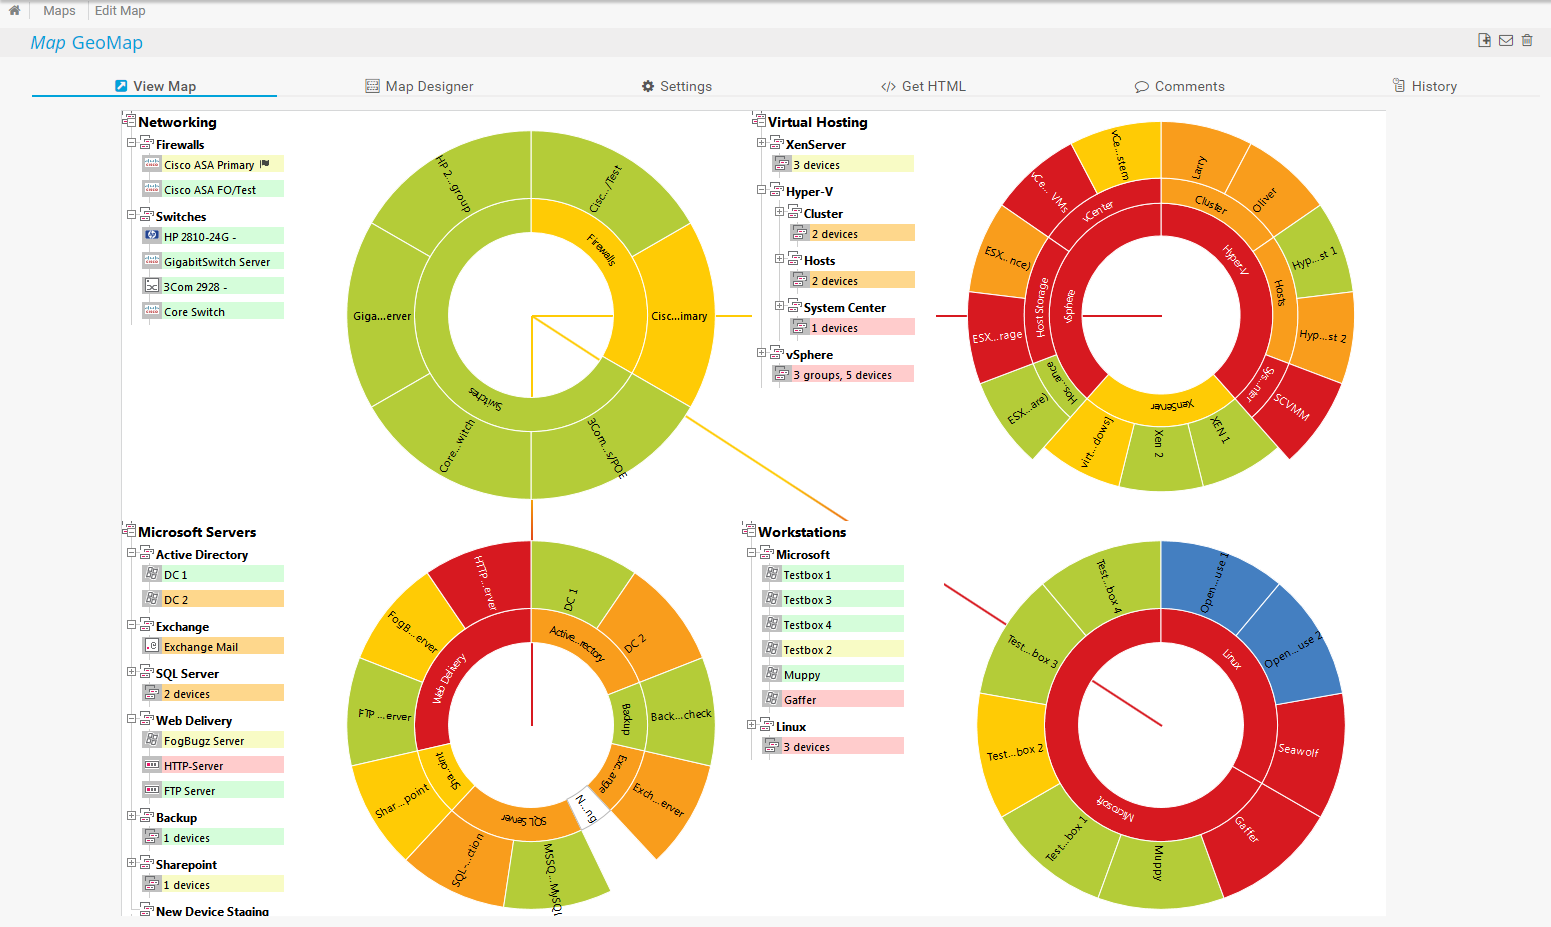
Your network at a glance
Start monitoring Docker containers with PRTG and see how it can make your IT infrastructure more reliable and your job easier.
PRTG is compatible with all major vendors and manufacturers
![]()
How PRTG can help you with Docker container monitoring
![]()
User-defined performance metrics
The Docker Container Status sensor uses lookups to determine the status values of one or more sensor channels. The possible states are defined in the corresponding lookup file, and you can always customize the behavior of the respective sensor channel by editing the file.
![]()
Preconfigured sensor included
To monitor your Docker containers with PRTG, you can use the Docker Container Status Sensor. This sensor supports the IPv4 protocol and has a low impact on performance.
![]()
Secure connection
To establish a connection between the Docker Container Status sensor and your container, you need to provide certificates and private keys. Follow the steps in our Knowledge Base Article.
3 reasons why PRTG is the perfect Docker container monitoring tool
![]()
One tool to monitor them all
PRTG is an all-in-one IT infrastructure monitoring tool that includes a special built-in sensor for monitoring your Docker environments. That means you can do away with having to rely on a variety of individualized solutions, which can carry potential risks such as incompatibility with your current workflow and even security issues.
![]()
Your containers at a glance
PRTG features an easy-to-read main dashboard with an overview of all your containers (as well as other endpoints) and their data at a glance. And with the auto-discovery, PRTG can automatically track new containers as they are deployed.
You can customize dashboards to your needs and share them via a unique URL that that can be used for internal or external access. Publish the dashboard internally for colleagues or the management team, or show it on network operation center screens, for example.
![]()
Sound the alarm
PRTG automatically triggers configurable alerts based on metrics defined by you. As soon as performance or reliability issues arise, you will be informed by SMS, email, push notification, and more.
You can also schedule automated reports that PRTG aggregates and exports for you to send them, for example, to the management team.
Your Docker container monitor at a glance – even on the go
Set up PRTG in minutes and use it on almost any mobile device.


Find the root cause of the problem with our PRTG Docker monitoring solution
Real-time notifications mean faster troubleshooting so that you can act before more serious issues occur.
Create innovative solutions with Paessler’s partners
Partnering with innovative vendors, Paessler unleashes synergies to create
new and additional benefits for joined customers.


ScriptRunner
With ScriptRunner, Paessler integrates a powerful event automation platform into PRTG Network Monitor.
PRTG makes Docker monitoring as easy as it gets
Custom alerts and data visualization let you quickly identify and prevent performance issues while running containers.

PRTG: The multi-tool for sysadmins
Adapt PRTG individually and dynamically to your needs and rely on a strong API:- HTTP API: Access monitoring data and manipulate monitoring objects via HTTP requests
- Custom sensors: Create your own PRTG sensors for customized monitoring
- Custom notifications: Create your own notifications and send action triggers to external systems
- REST Custom sensor: Monitor almost everything that provides data in XML or JSON format
![]()
“For us, PRTG Network Monitor is the most effective tool for monitoring our IT infrastructure in the long run.”
Oliver Jähn, IT Manager at the University of Bonn
We asked: would you recommend PRTG?
Over 95% of our customers say yes!
Paessler conducted trials in over 600 IT departments worldwide to tune its network monitoring software closer to the needs of sysadmins.
The result of the survey: over 95% of the participants would recommend PRTG – or already have.

Still not convinced?
More than 500,000
sysadmins love PRTG
Paessler PRTG is used by companies of all sizes. Sysadmins love PRTG because it makes their job a whole lot easier.
Monitor your entire IT infrastructure
Bandwidth, servers, virtual environments, websites, VoIP services – PRTG keeps an eye on your entire network.
![]()
Start Docker container monitoring with PRTG and see how it can make your IT infrastructure more reliable and your job easier.
|
PRTG |
Network Monitoring Software - Version 25.1.104.1961 (April 7th, 2025) |
|
Hosting |
Download for Windows and cloud-based version PRTG Hosted Monitor available |
Languages |
English, German, Spanish, French, Portuguese, Dutch, Russian, Japanese, and Simplified Chinese |
Pricing |
Up to 100 sensors for free (Price List) |
Unified Monitoring |
Network devices, bandwidth, servers, applications, virtual environments, remote systems, IoT, and more |
Supported Vendors & Applications |
|
Discover more monitoring insights and stories

Solutions for all your monitoring needs

Powerful stories from the monitoring world

Combining the broad monitoring feature set of PRTG with IP Fabric’s automated network assurance creates a new level of network visibility and reliability.