![]()
Windows process monitoring with PRTG
Track any process, stop any threat to your Windows system
- Monitor Windows process activity, attributes, and other key metrics in real time
- Proactively detect potential issues and prevent disruption
- Boost your network's performance and accurately forecast future capacity
Our users give top ratings for monitoring with Paessler PRTG


PRTG Windows process monitoring: What you’ll find on this page

So many processes, so little time
Rogue Windows processes drain precious network resources, create security vulnerabilities, and disrupt your organization.
But how do you keep track of them all when a single Windows application can run dozens of processes? And when there are multiple metrics to monitor for each process?
With Paessler PRTG, it's all done for you.
Our sophisticated sensors collect mission-critical real-time and historical data in one place for effortless troubleshooting and pinpoint-accurate resource optimization and capacity planning. And, with powerful alert automations running in the background, you'll never miss a potentially serious performance issue or security threat.
PRTG makes Windows process monitoring as easy as it gets
Custom alerts and data visualization let you quickly identify and prevent congestion, server overload, security vulnerabilities, and other network issues.
3 reasons why to choose PRTG as your Windows process monitoring tool
Monitor Windows processes easily
Install and configure PRTG in minutes. Its automatic network discovery discovers all Windows devices and processes in your IT infrastructure and automatically adds them to your monitoring setup.
What’s more: PRTG has a simple and intuitive user interface that makes it easy to learn how to use it, even for people that have no deep technical knowledge.
View data in one centralized system
You don't need to monitor the performance indicators of different Windows processes manually – PRTG collects monitoring data from various sources and stores and visualizes it in a central system.
View all your Windows process data in a single pane of glass via charts, graphs, and dashboards that you can easily customize using our built-in drag-and-drop editor.
Create flexible, customizable reports
PRTG offers a large list of preconfigured report templates that you can use to view monitoring data for a day, a month, or any time period you choose.
Edit templates and ready-made reports, configure the report generation period, select the required sensors, create reports on demand, or set a schedule for automatic report generation.
What Windows process monitoring looks like in PRTG
Diagnose network issues by continuously tracking Windows process and network activity, file systems, and other Windows process information. Show active processes, CPU usage and memory load, hidden, orphaned, and unsigned or suspicious processes, network connections, bandwidth, and other key metrics in real time. Visualize monitoring data in clear graphs and dashboards to identify problems more easily. Gain the overview you need to troubleshoot congestion, Windows server overload, and other network issues.

Device tree view of the complete monitoring setup
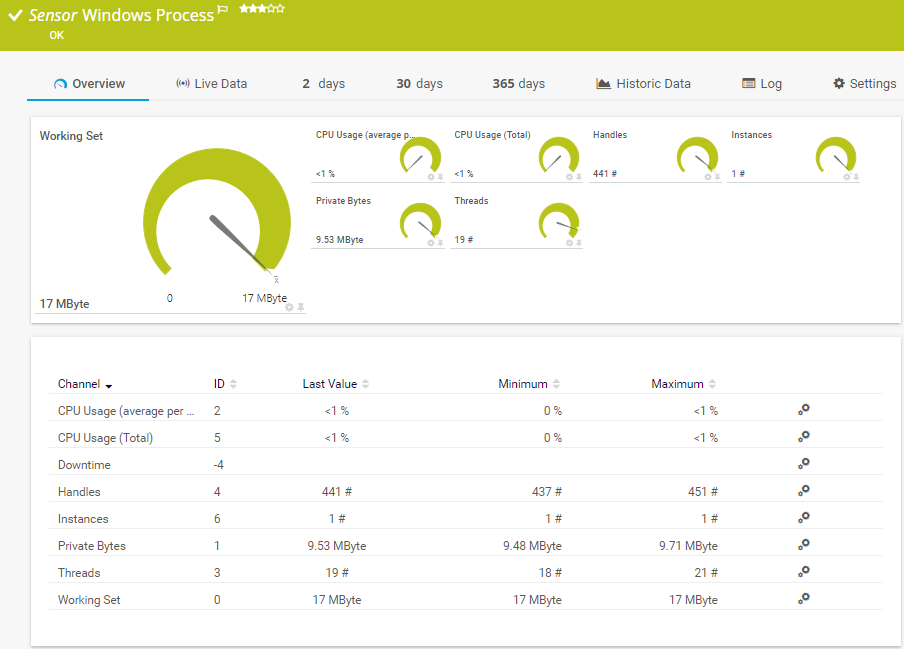
Preconfigured Windows Process sensor in PRTG

Custom PRTG dashboard for keeping an eye on the entire IT infrastructure
Start monitoring Windows processes with PRTG and see how it can make your network more reliable and your job easier.
IT experts agree: Paessler PRTG is a great solution for IT infrastructure monitoring

“All-around winning
network monitor”

“The real beauty of PRTG is the endless possibilities it offers”

“PRTG Network Monitor
is very hard to beat”
Full confidence in your network’s performance and security, with PRTG
Effortless setup
Minimal manual intervention and zero specialist knowledge required. Download PRTG, key in an IP address range, and the Auto-Discovery will track down every Windows device and process on your network, assign the appropriate sensors, and start monitoring. Job done.
Real-time monitoring
See how many (and which) Windows processes are running at any point throughout the day and optimize your network on the fly. PRTG also stores historical process data, making it easy to see how memory usage, loads, and other metrics change over time, and plan accordingly.
Uncompromising security
Is it a legitimate process, or malware? Built-in alerts tell you when there’s an issue, so you can nip it in the bud. Plus, PRTG monitors firewalls, operating systems, and other network components, encrypts connections, and uses secure protocols to keep your data safe.
Complete customization
Why make do with procmon and other Windows sysinternals’ interfaces, when you can tailor your monitoring environment to suit? With the ability to create your own dashboards, alert thresholds, and reporting templates, PRTG gives you the flexibility you need, and then some.
Your Windows process monitor at a glance – even on the go
Set up PRTG in minutes and use it on almost any mobile device.


Explore our preconfigured PRTG sensors for Windows process monitoring
PRTG comes with more than 250 native sensor types for monitoring your entire on-premises, cloud, and hybrid cloud environment out of the box. Check out some examples below!
Find the root cause of the problem with our PRTG Windows process monitoring solution
Real-time notifications mean faster troubleshooting so that you can act before more serious issues occur.
PRTG is compatible with all major vendors, products, and systems
![]()
Create innovative solutions with Paessler’s partners
Partnering with innovative vendors, Paessler unleashes synergies to create
new and additional benefits for joined customers.


KnowledgeRiver
Combining their tools to a powerful solution for advanced analysis and automation, KnowledgeRiver and Paessler enable IT teams to ensure best performance for their infrastructure and networks.

“Excellent tool for detailed monitoring. Alarms and notifications work greatly. Equipment addition is straight forward and server initial setup is very easy. ...feel safe to purchase it if you intend to monitor a large networking landscape.”
Infrastructure and Operations Engineer in the Communications Industry, firm size 10B - 30B USD
PRTG makes Windows process monitoring as easy as it gets
Custom alerts and data visualization let you quickly identify and prevent congestion, server overload, security vulnerabilities, and other network issues.

PRTG: The multi-tool for sysadmins
Adapt PRTG individually and dynamically to your needs and rely on a strong API:- HTTP API: Access monitoring data and manipulate monitoring objects via HTTP requests
- Custom sensors: Create your own PRTG sensors for customized monitoring
- Custom notifications: Create your own notifications and send action triggers to external systems
- REST Custom sensor: Monitor almost everything that provides data in XML or JSON format
We asked: would you recommend PRTG?
Over 95% of our customers say yes!
Paessler conducted trials in over 600 IT departments worldwide to tune its network monitoring software closer to the needs of sysadmins.
The result of the survey: over 95% of the participants would recommend PRTG – or already have.

Still not convinced?
![]()
More than 500,000
sysadmins love PRTG
Paessler PRTG is used by companies of all sizes. Sysadmins love PRTG because it makes their job a whole lot easier.
![]()
Monitor your entire IT infrastructure
Bandwidth, servers, virtual environments, websites, VoIP services – PRTG keeps an eye on your entire network.
![]()
Try Paessler PRTG
for free
Everyone has different monitoring needs. That’s why we let you try PRTG for free.
![]()
Start monitoring Windows processes with PRTG and see how it can make your network more reliable and your job easier.
|
PRTG |
Network Monitoring Software - Version 25.1.104.1961 (April 7th, 2025) |
|
Hosting |
Download for Windows and cloud-based version PRTG Hosted Monitor available |
Languages |
English, German, Spanish, French, Portuguese, Dutch, Russian, Japanese, and Simplified Chinese |
Pricing |
Up to 100 sensors for free (Price List) |
Unified Monitoring |
Network devices, bandwidth, servers, applications, virtual environments, remote systems, IoT, and more |
Supported Vendors & Applications |
|
Discover more monitoring insights and stories

Solutions for all your monitoring needs

Powerful stories from the monitoring world

Combining the broad monitoring feature set of PRTG with IP Fabric’s automated network assurance creates a new level of network visibility and reliability.