![]()
PostgreSQL monitoring with PRTG
Put an end to issues that negatively affect your PostgreSQL database operations
- Improve the performance of your Postgres databases
- Collect historical data to manage database resources more efficiently
- Stop issues with your database servers before they escalate
Our users give top ratings for monitoring with Paessler PRTG


PRTG PostgreSQL monitoring: What you’ll find on this page

PRTG makes PostgreSQL monitoring as easy as it gets
Custom alerts and data visualization let you quickly identify and prevent issues with database operations.
Get comprehensive PostgreSQL management and monitoring insights
For system admins, troubleshooting large databases can seem never-ending. On Linux and macOS systems, database management is often synonymous with PostgreSQL database systems. These preconfigured systems often fail to meet the specific requirements of an organization’s IT infrastructure. This is where Paessler PRTG PostgreSQL performance monitoring shines.
Track legacy settings that slow database queries
As PostgreSQL-based database systems are preconfigured, many sysadmins run into problems when using these PostgreSQL servers for the first time due to incorrect database queries hat do not fit their network requirements.
PRTG helps you find and fix the settings responsible for slow database queries, database errors resulting in incorrect read and write values, and other vulnerabilities.
Monitor PostgreSQL databases with a few klicks
Setting up your PostgreSQL database monitoring is easy. PRTG comes with a preconfigured PostgreSQL sensor out of the box. This sensor can keep an eye on the following metrics:
- The number of affected rows that were addressed by the query (including SELECT statements if you process data tables)
- The execution time of the entire request (including connection buildup, query execution, transaction handling, disconnection)
- The execution time of the specified query
Protect the integrity and reliability of your data
Having a single source of truth is imperative for business continuity, as is making sure that source is available 24/7/365.
PostgreSQL monitoring with PRTG guards your replication and backup tasks, as well as the logs for those actions. Mission-critical applications stay online, and data remains intact. What’s more: PRTG also tracks unauthorized access attempts, helping you maintain data security.
Get the notifications you need wherever you are
No admin wants to be overwhelmed with false positives or notifications that mean nothing and go nowhere. PRTG has a highly customizable alerting system that allows you to set the warning and error thresholds for your alerts and use various notification templates.
Alerts get sent to the teams you choose on the platform you want, whether Teams, Slack, email, SMS, or push notification.
Resolve issues before they are issues
With real-time alerts, in-depth analytics, and historical data, you can proactively address potential issues before they become noticeable.
PRTG PostgreSQL monitoring helps with disaster recovery preparedness, detecting excessive load, database configuration issues, problems with database size, read and write processes which are way too slow, and inefficient indexes.
What PostgreSQL monitoring looks like in PRTG
Diagnose network issues by continuously tracking the availability, health, and performance of your PostgreSQL database systems. Show latency, workloads, the number of running queries and affected rows, and other performance metrics in real time. Visualize monitoring data in clear graphs and dashboards to identify problems more easily. Gain the overview you need to troubleshoot slow queries and other PostgreSQL database errors.
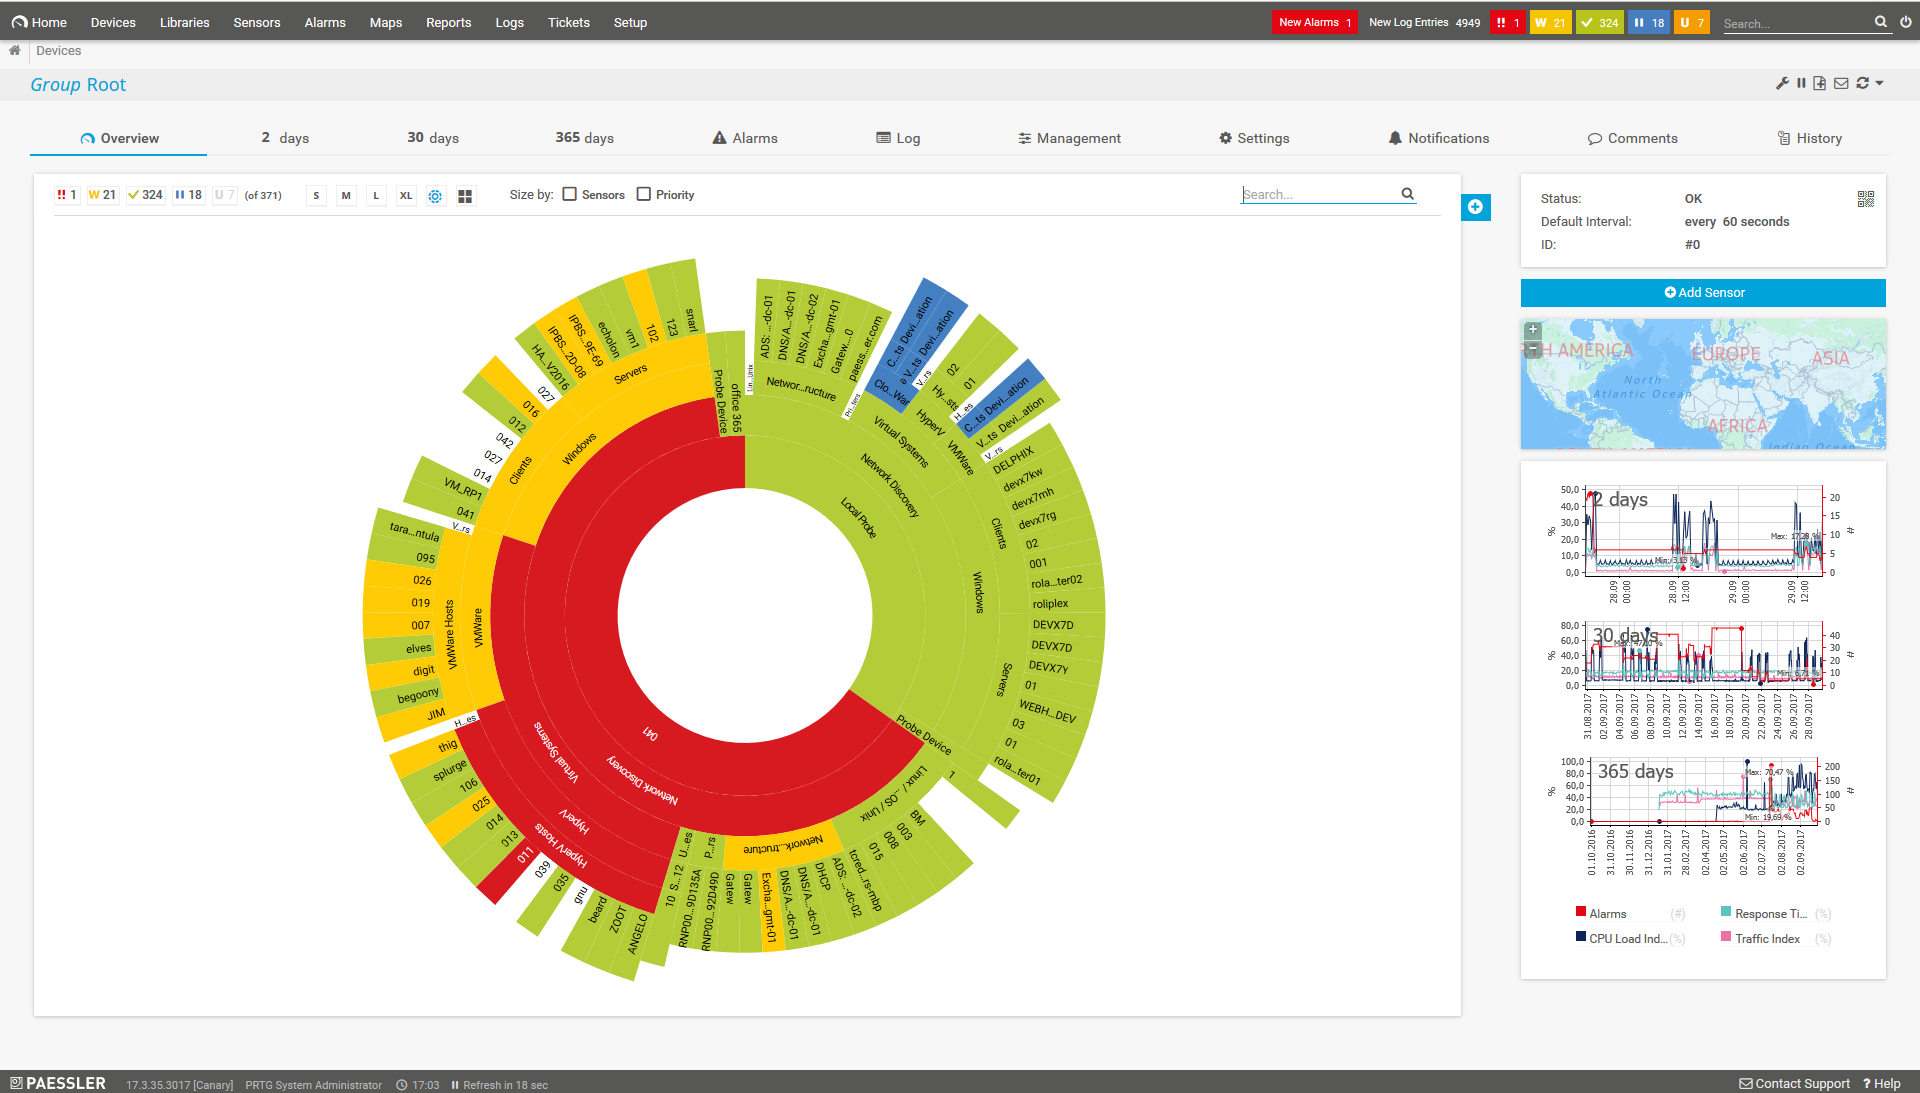
Sunburst view of the entire monitoring setup
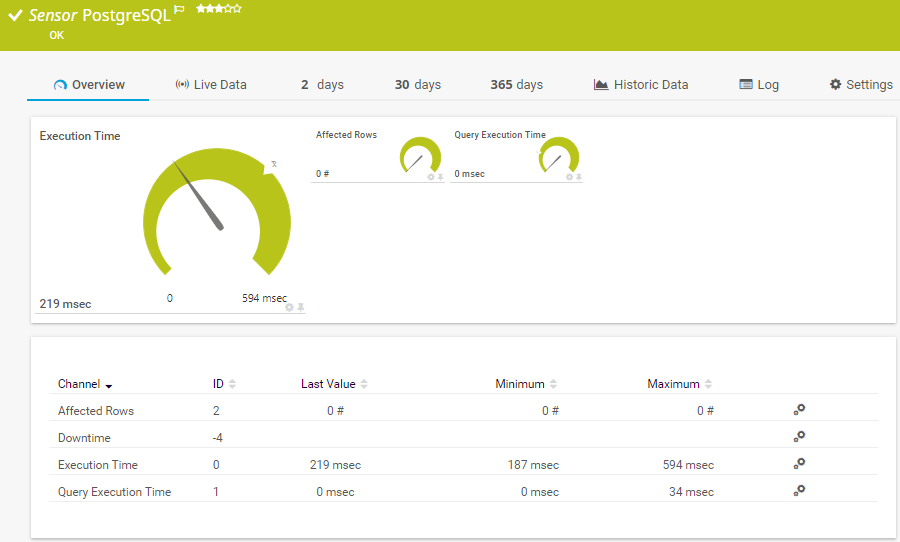
PostgreSQL sensor in PRTG
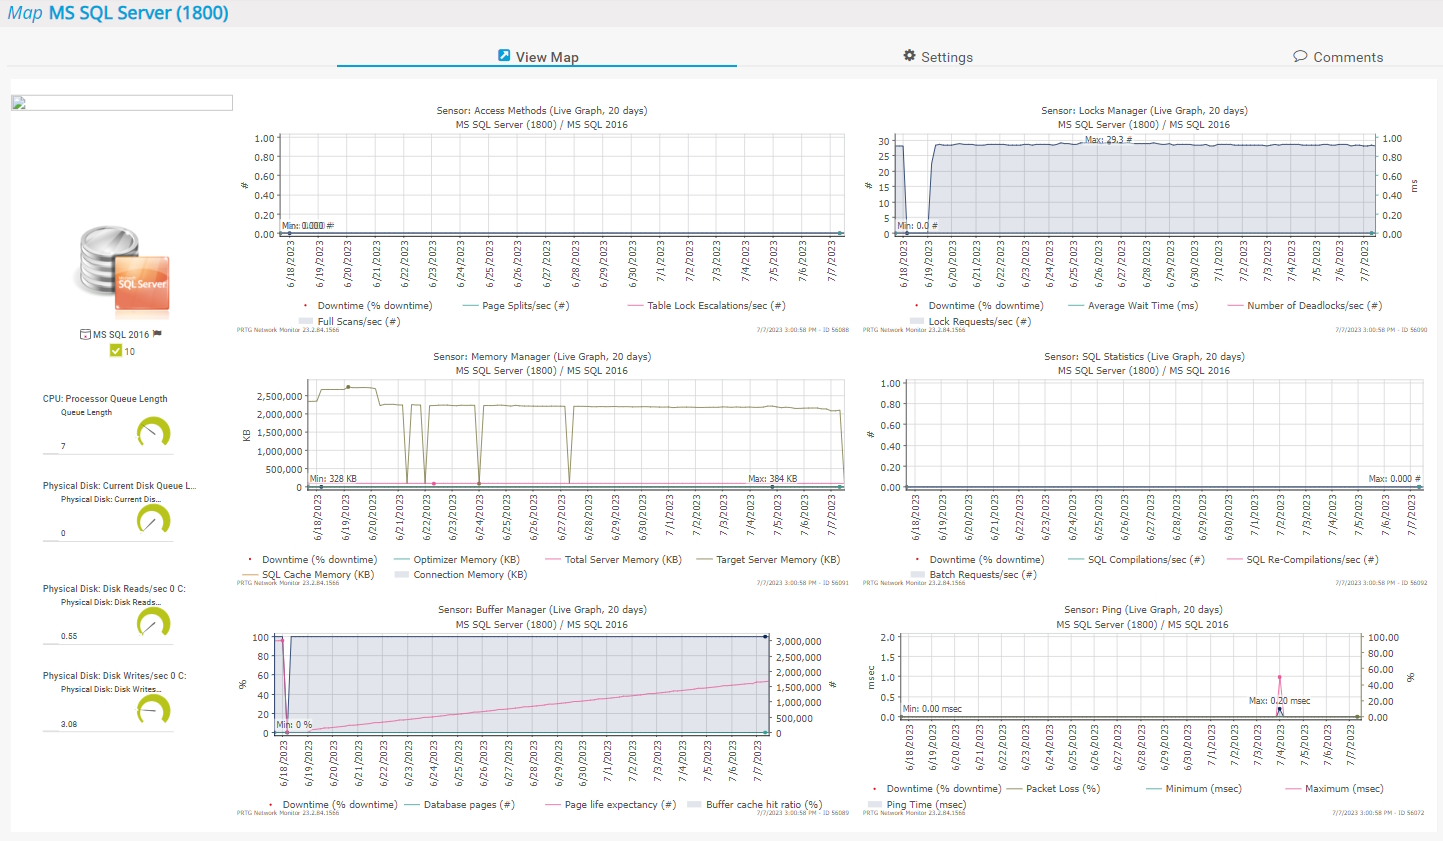
Custom PRTG map for MS SQL monitoring
Start monitoring PostgreSQL metrics with PRTG and see how it can make your network more reliable and your job easier.
IT experts agree: Paessler PRTG is a great solution for IT infrastructure monitoring

“All-around winning
network monitor”

“The real beauty of PRTG is the endless possibilities it offers”

“PRTG Network Monitor
is very hard to beat”
5 reasons to choose PRTG as your PostgreSQL monitoring tool
Easy setup & deployment
Setting up monitoring software can be complex and time-consuming – not with PRTG. Our PostgreSQL monitoring software can be set up and running in just a few hours. Quick to install, fast to deploy, and easy to use, PRTG keeps your downtime to a minimum during implementation.
Long-term statistics
PRTG monitors and correlates the performance of your PostgreSQL databases so you can rest assured that everything is working correctly. Historical data, PostgreSQL logs, and in-depth reports provide the metrics you need for optimizing database operations.
A single point of truth
PRTG presents data in a single dashboard that can drill down to the device and sensor level. Get insights into database performance for better capacity planning and resource management. From an executive overview to granular-level reporting, you see just the information you need at the time you need it.
Tailored monitoring
PRTG’s monitoring sensors allow for flexible configuration, letting you execute specific SQL queries to provide in-depth analysis. Customizing these sensors via the PRTG API provides tailored monitoring, so you can get basic performance monitoring and complex diagnostics for your environment.
All-in-one network monitoring
PRTG brings over 250 preconfigured sensors to the table for comprehensive network monitoring. These help you track and analyze all kinds of network components, including switches, routers, firewalls, and other devices. This versatility is a powerful tool in your sysadmin toolbox to help maintain network performance.
Bring your monitoring experience to the next level with our PRTG product extensions
Enhance the functionality of Paessler PRTG & benefit from an extended feature set for data export and advanced database monitoring.
Data extraction for easier monitoring data analysis
- Export raw monitoring data from PRTG & store it in your relational database – no programming skills needed
- Have all important data available in a single database
- Generate your own analyses & reporting using third-party tools
Database monitoring with extended database support
- Monitor the health & performance of databases that go beyond the standard PRTG set
- Use predefined SQL queries for easier setup of your database monitoring
- Manage and test database queries & share them in your team
Your PostgreSQL stats at a glance – even on the go
Set up PRTG in minutes and use it on almost any mobile device.


Find the root cause of the problem with our PRTG PostgreSQL monitoring solution
Real-time notifications mean faster troubleshooting so that you can act before more serious issues occur.
PRTG is compatible with all major vendors, products, and systems
![]()
Create innovative solutions with Paessler’s partners
Partnering with innovative vendors, Paessler unleashes synergies to create
new and additional benefits for joined customers.


ScriptRunner
With ScriptRunner, Paessler integrates a powerful event automation platform into PRTG Network Monitor.
“Excellent tool for detailed monitoring. Alarms and notifications work greatly. Equipment addition is straight forward and server initial setup is very easy. ...feel safe to purchase it if you intend to monitor a large networking landscape.”
Infrastructure and Operations Engineer in the Communications Industry, firm size 10B - 30B USD
More than just a monitoring tool:
Reasons our customers love PRTG


PRTG: The multi-tool for sysadmins
Adapt PRTG individually and dynamically to your needs and rely on a strong API:- HTTP API: Access monitoring data and manipulate monitoring objects via HTTP requests
- Custom sensors: Create your own PRTG sensors for customized monitoring
- Custom notifications: Create your own notifications and send action triggers to external systems
- REST Custom sensor: Monitor almost everything that provides data in XML or JSON format
Still not convinced?
![]()
More than 500,000
sysadmins love PRTG
Paessler PRTG is used by companies of all sizes. Sysadmins love PRTG because it makes their job a whole lot easier.
![]()
Monitor your entire IT infrastructure
Bandwidth, servers, virtual environments, websites, VoIP services – PRTG keeps an eye on your entire network.
![]()
Try Paessler PRTG
for free
Everyone has different monitoring needs. That’s why we let you try PRTG for free.
![]()
Start monitoring your PostgreSQL database with PRTG and see how it can make your network more reliable and your job easier.
|
PRTG |
Network Monitoring Software - Version 25.1.104.1961 (April 7th, 2025) |
|
Hosting |
Download for Windows and cloud-based version PRTG Hosted Monitor available |
Languages |
English, German, Spanish, French, Portuguese, Dutch, Russian, Japanese, and Simplified Chinese |
Pricing |
Up to 100 sensors for free (Price List) |
Unified Monitoring |
Network devices, bandwidth, servers, applications, virtual environments, remote systems, IoT, and more |
Supported Vendors & Applications |
|
Discover more monitoring insights and stories

Solutions for all your monitoring needs

Powerful stories from the monitoring world
