![]()
MQTT monitoring with PRTG
Maximize IIoT efficiency & prevent failures in your production processes
- Avoid malfunctions or failures during the production process
- Get a combined overview of your IT and OT networks
- Identify bottlenecks in your production or building automation
Our users give top ratings for monitoring with Paessler PRTG


PRTG MQTT monitoring: What you’ll find on this page

PRTG makes MQTT broker monitoring as easy as it gets
Custom alerts and data visualization let you quickly identify and prevent MQTT traffic and other performance issues.
5 reasons why to choose PRTG as your MQTT monitoring tool
As Message Queuing Telemetry Transport (MQTT) has become one of the most important protocols in the IIoT and IoT world, it should also be a key component of your monitoring concept. The solution: Paessler PRTG, your all-in-one monitoring tool that combines IT, industrial IoT, and OT network monitoring in a single pane of glass.
View from a central dashboard
Do away with checking IT and IoT devices with multiple tools and on multiple dashboards. With MQTT integration in PRTG, you get a combined overview of your classic IT and MQTT devices – all in one place.
What’s more: The PRTG Map Editor functionality lets you easily create custom dashboards using drag and drop so that you have the status of all your critical devices and applications at a glance.
Monitor converged IT/OT networks
In industrial IT environments, many OT network components such as PLCs, industrial PCs, SCADA systems, HMIs, or MES cannot be monitored with traditional IT monitoring protocols.
PRTG’s MQTT monitoring, in combination with your smart industrial gateways, easily brings OT network data into your IT monitoring concept.
Benefit from out-of-the-box integrations
Beyond support for all classic IT standards, PRTG offers a RESTful API, JSON, and MQTT support out of the box.
Not to mention OPC UA and SCADA integration to easily monitor shop floors, IoT devices, and other IT devices, applications, and services that don't use common IT technologies.
Get full MQTT server monitoring
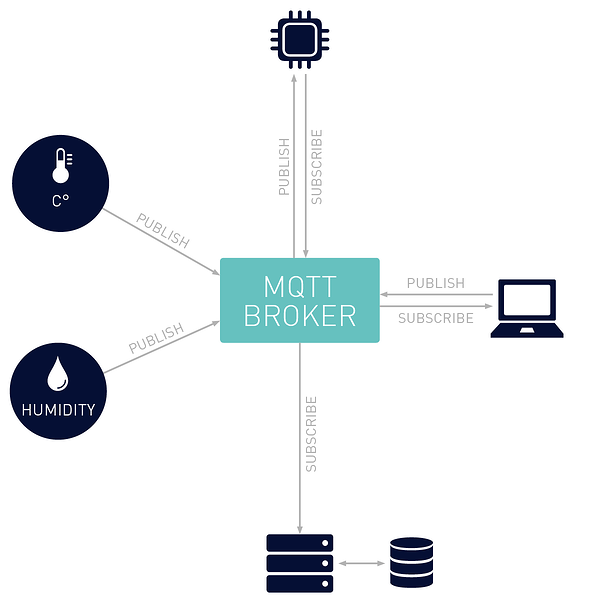
No need to worry whether a connection to the MQTT broker – or server – can be established, or if it accepts messages or forwards them to a matching subscriber at all.
With PRTG’s preconfigured sensor types for monitoring MQTT, you can keep an eye on the availability and connection time of your MQTT broker 24/7.
Receive custom alerts & notifications
Set it – that is, thresholds – and forget it. With PRTG’s real-time alerts and customizable notification templates, you’re always notified in time if there is an issue in your infrastructure.
Use MQTT notifications, for example, to forward alerts, warnings, or any other information to a third-party system of your choice that can subscribe to MQTT topics.
What MQTT monitoring looks like in PRTG
Diagnose network issues by continuously tracking your industrial IT and OT networks. Show MQTT connection status and quality, message throughput and latency, topic and resource usage, and other key metrics in real time. Visualize monitoring data in clear graphs and dashboards to identify problems more easily. Gain the overview you need to troubleshoot all kinds of MQTT traffic, health, and performance issues.

Device tree view of the complete monitoring setup
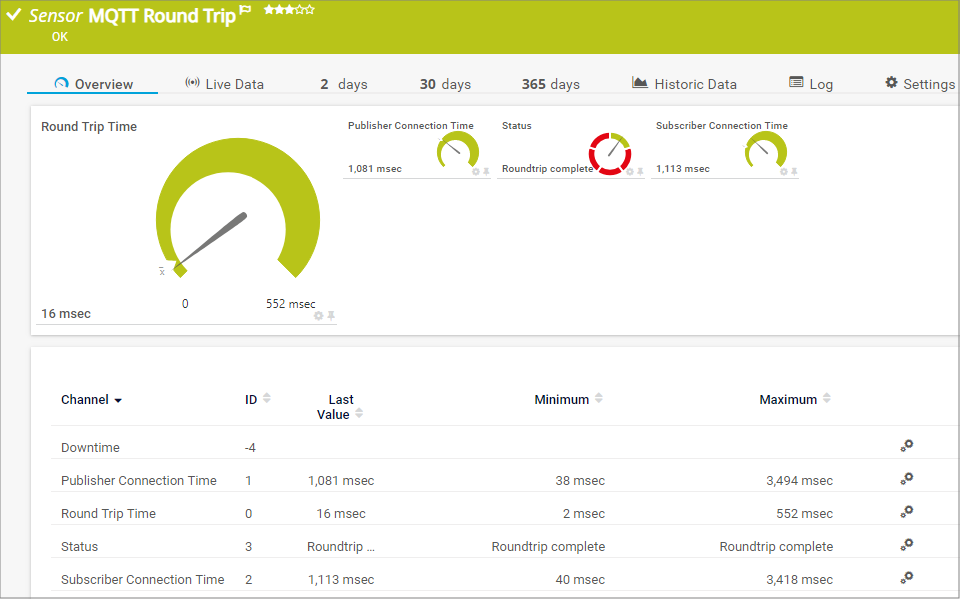
Preconfigured MQTT Round Trip sensor in PRTG
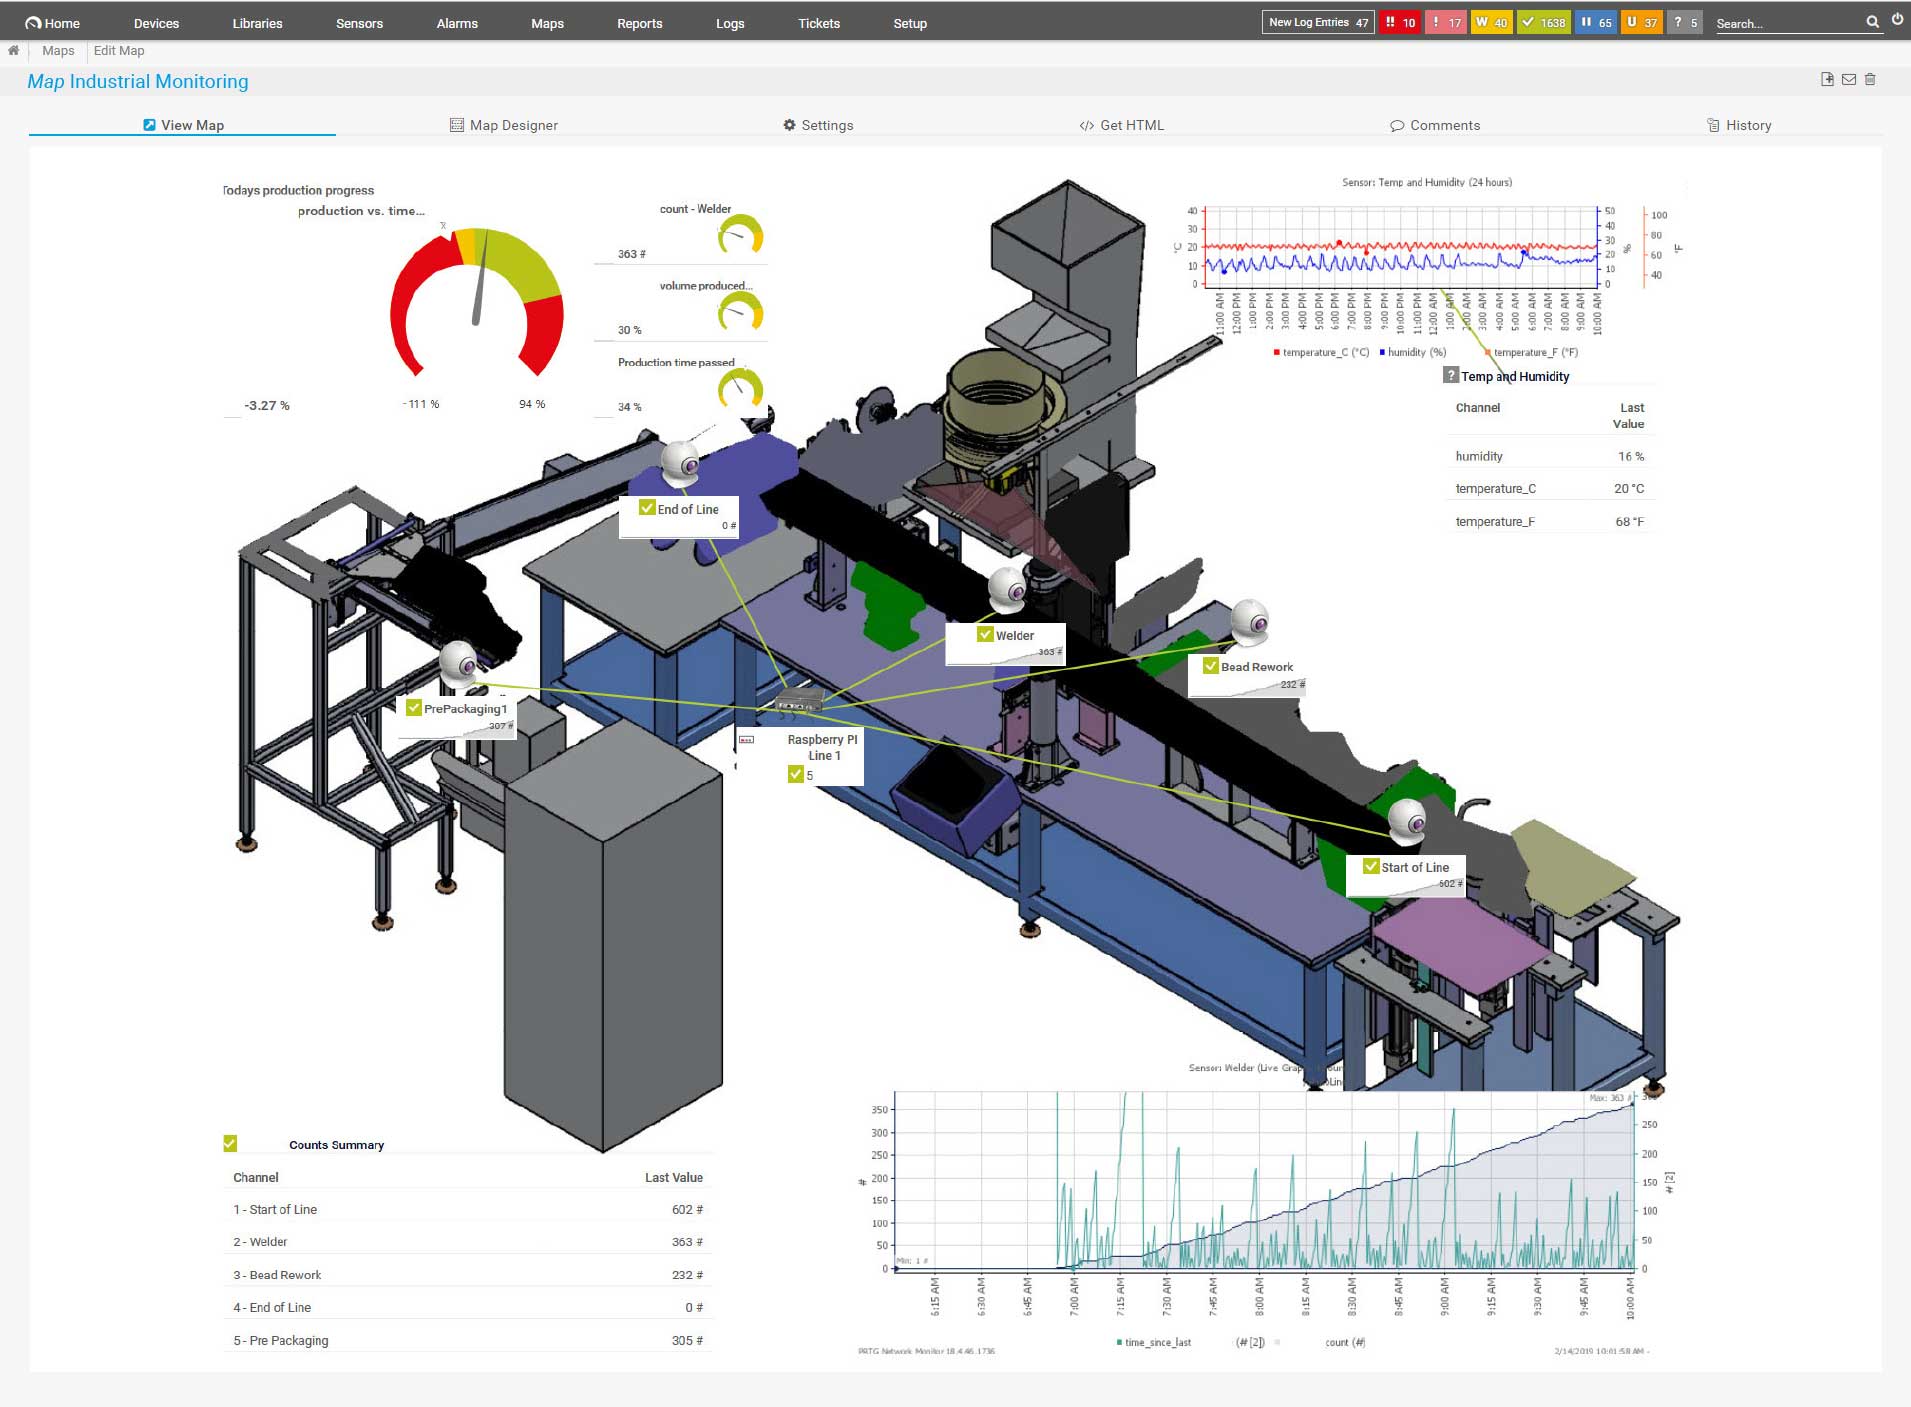
Custom PRTG dashboard for monitoring a manufacturing process
Start monitoring using the MQTT protocol with PRTG and see how it can make your network more reliable and your job easier.
IT experts agree: Paessler PRTG is a great solution for IT infrastructure monitoring

“All-around winning
network monitor”

“The real beauty of PRTG is the endless possibilities it offers”

“PRTG Network Monitor
is very hard to beat”
How MQTT monitoring with PRTG works
PRTG comes with more than 250 preconfigured sensor types out of the box for monitoring your IT, OT, and IoT infrastructures on all levels – from hardware to applications, from on-prem installations to cloud and virtual environments. For MQTT monitoring, there are 3 native sensors that allow you to monitor everything that communicates via MQTT.
MQTT Round Trip
The MQTT Round Trip sensor monitors the availability of an MQTT broker, connects to the broker as a publishing and subscribing client, and sends the data packets using a predefined topic. It can show the following:
- The time it takes the publisher to connect
- The RTT of the message (after both publisher and subscriber connect)
- Round trip status
- The time it takes the subscriber to connect
MQTT Statistics
The MQTT Statistics sensor monitors an MQTT topic. It can show the following:
- Number of active MQTT topics
- Number of messages received since the last scan
- Received payload
MQTT Subscribe Custom
The MQTT Subscribe Custom sensor subscribes to an MQTT topic and monitors up to ten custom numeric values from the received JSON data. It can show the following (examples only):
- Temperature
- Humidity
- Illuminance
- Pressure
Discover our new product extension
Paessler PRTG OPC UA Server
![]()
Do you want to have a full overview of your OT environment in your supervisory and control systems – including traditional IT network components like routers, switches, firewalls, and more?
PRTG OPC UA Server consolidates monitoring data from your OT network and the IIoT in your control system. View all your data in one place for centralized monitoring and alarms.
Your MQTT monitor at a glance – even on the go
Set up PRTG in minutes and use it on almost any mobile device.


Find the root cause of the problem with our PRTG MQTT monitoring solution
Real-time notifications mean faster troubleshooting so that you can act before more serious issues occur.
PRTG is compatible with all major vendors, products, and systems
![]()
Create innovative solutions with Paessler’s partners
Partnering with innovative vendors, Paessler unleashes synergies to create
new and additional benefits for joined customers.


ScriptRunner
With ScriptRunner, Paessler integrates a powerful event automation platform into PRTG Network Monitor.
“Excellent tool for detailed monitoring. Alarms and notifications work greatly. Equipment addition is straight forward and server initial setup is very easy. ...feel safe to purchase it if you intend to monitor a large networking landscape.”
Infrastructure and Operations Engineer in the Communications Industry, firm size 10B - 30B USD
Get your free white papers
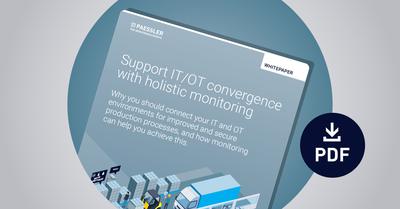
White paper I
In modern industrial IT, the right teams need the right data. Our guide shows how to implement holistic monitoring that brings elements from IT, OT and IIoT into your dashboards.

White paper II
Our second guide gives you inspiration and ideas for dashboards that feature IT, OT and IIoT data – all in one place. We show you what truly convergent industrial dashboards look like!
PRTG makes MQTT broker monitoring as easy as it gets
Custom alerts and data visualization let you quickly identify and prevent MQTT traffic and other performance issues.

PRTG: The multi-tool for sysadmins
Adapt PRTG individually and dynamically to your needs and rely on a strong API:- HTTP API: Access monitoring data and manipulate monitoring objects via HTTP requests
- Custom sensors: Create your own PRTG sensors for customized monitoring
- Custom notifications: Create your own notifications and send action triggers to external systems
- REST Custom sensor: Monitor almost everything that provides data in XML or JSON format
More than just a monitoring tool:
Reasons our customers love PRTG


Still not convinced?
![]()
More than 500,000
sysadmins love PRTG
Paessler PRTG is used by companies of all sizes. Sysadmins love PRTG because it makes their job a whole lot easier.
![]()
Monitor your entire IT infrastructure
Bandwidth, servers, virtual environments, websites, VoIP services – PRTG keeps an eye on your entire network.
![]()
Try Paessler PRTG
for free
Everyone has different monitoring needs. That’s why we let you try PRTG for free.
![]()
Start monitoring using the MQTT protocol with PRTG and see how it can make your network more reliable and your job easier.
|
PRTG |
Network Monitoring Software - Version 25.1.104.1961 (April 7th, 2025) |
|
Hosting |
Download for Windows and cloud-based version PRTG Hosted Monitor available |
Languages |
English, German, Spanish, French, Portuguese, Dutch, Russian, Japanese, and Simplified Chinese |
Pricing |
Up to 100 sensors for free (Price List) |
Unified Monitoring |
Network devices, bandwidth, servers, applications, virtual environments, remote systems, IoT, and more |
Supported Vendors & Applications |
|