Paessler PRTG

SCADA integration with PRTG

Watch the watcher & keep your SCADA system stable and reliable


  • Collect real-time data from your IT as well as your OT network
  • Keep an eye on the availability and health of the SCADA system hardware
  • Receive custom alerts and notifications for proactive troubleshooting
 

Our users give top ratings for monitoring with Paessler PRTG


Ensure your SCADA systems are up and running, with PRTG


SCADA systems play a crucial role in OT networks that rely heavily on industrial automation. If they go down, the results will be costly.

However, while SCADA systems provide data about OT and production systems, this is only part of the picture. What about the hardware that supports the SCADA system? Or the status of Industrial PCs that are used in the industrial environment?

Paessler PRTG is comprehensive monitoring software that provides a holistic overview of your IT and OT – all in one place. Use it alongside control and execution systems (MES, DCS, Historian, BMS) to provide even more value for operators, engineers, and technicians.


PRTG makes SCADA system integration easy

Custom alerts and data visualization make it easy to monitor, identify, and prevent industrial IT and OT network issues.


3 reasons why PRTG is the SCADA monitoring tool of your choice

Get the full picture of your converged IT and OT

In addition to OT metrics collected by SCADA systems, there are many other data points that are important for understanding an industrial environment.

PRTG collects real-time data from many areas of your infrastructure, for example:


Monitor the condition of your SCADA hardware

It’s also vital that you keep an eye on the availability and health of the hardware that your SCADA system runs on to make sure it works smoothly and efficiently.

PRTG lets you monitor SCADA data such as the CPU load, memory, storage space, performance, related databases and other metrics from the environment that your SCADA runs in.

Using SNMP, PRTG can also ensure that the systems themselves are up and running and provide alerts in the case of issues.

Receive custom alerts at different escalation levels

While a SCADA system already provides you with alarms when things go wrong in your OT network, PRTG can add a different level of alerting to ensure that nothing gets missed – such as warnings about the servers that the SCADA system runs on.

With PRTG, you can set thresholds so you’re alerted when conditions deviate from what is considered “normal”.

PRTG can also notify the right teams with targeted escalation notifications using various methods such as SMS, email, in-app push messages, and more.


What SCADA system monitoring looks like in PRTG

Diagnose network issues by continuously monitoring your IT and OT networks. Show SCADA system status, health, and performance in real time and visualize data in graphic maps & dashboards to identify problems more easily. Gain the visibility you need to troubleshoot issues on the production floor.
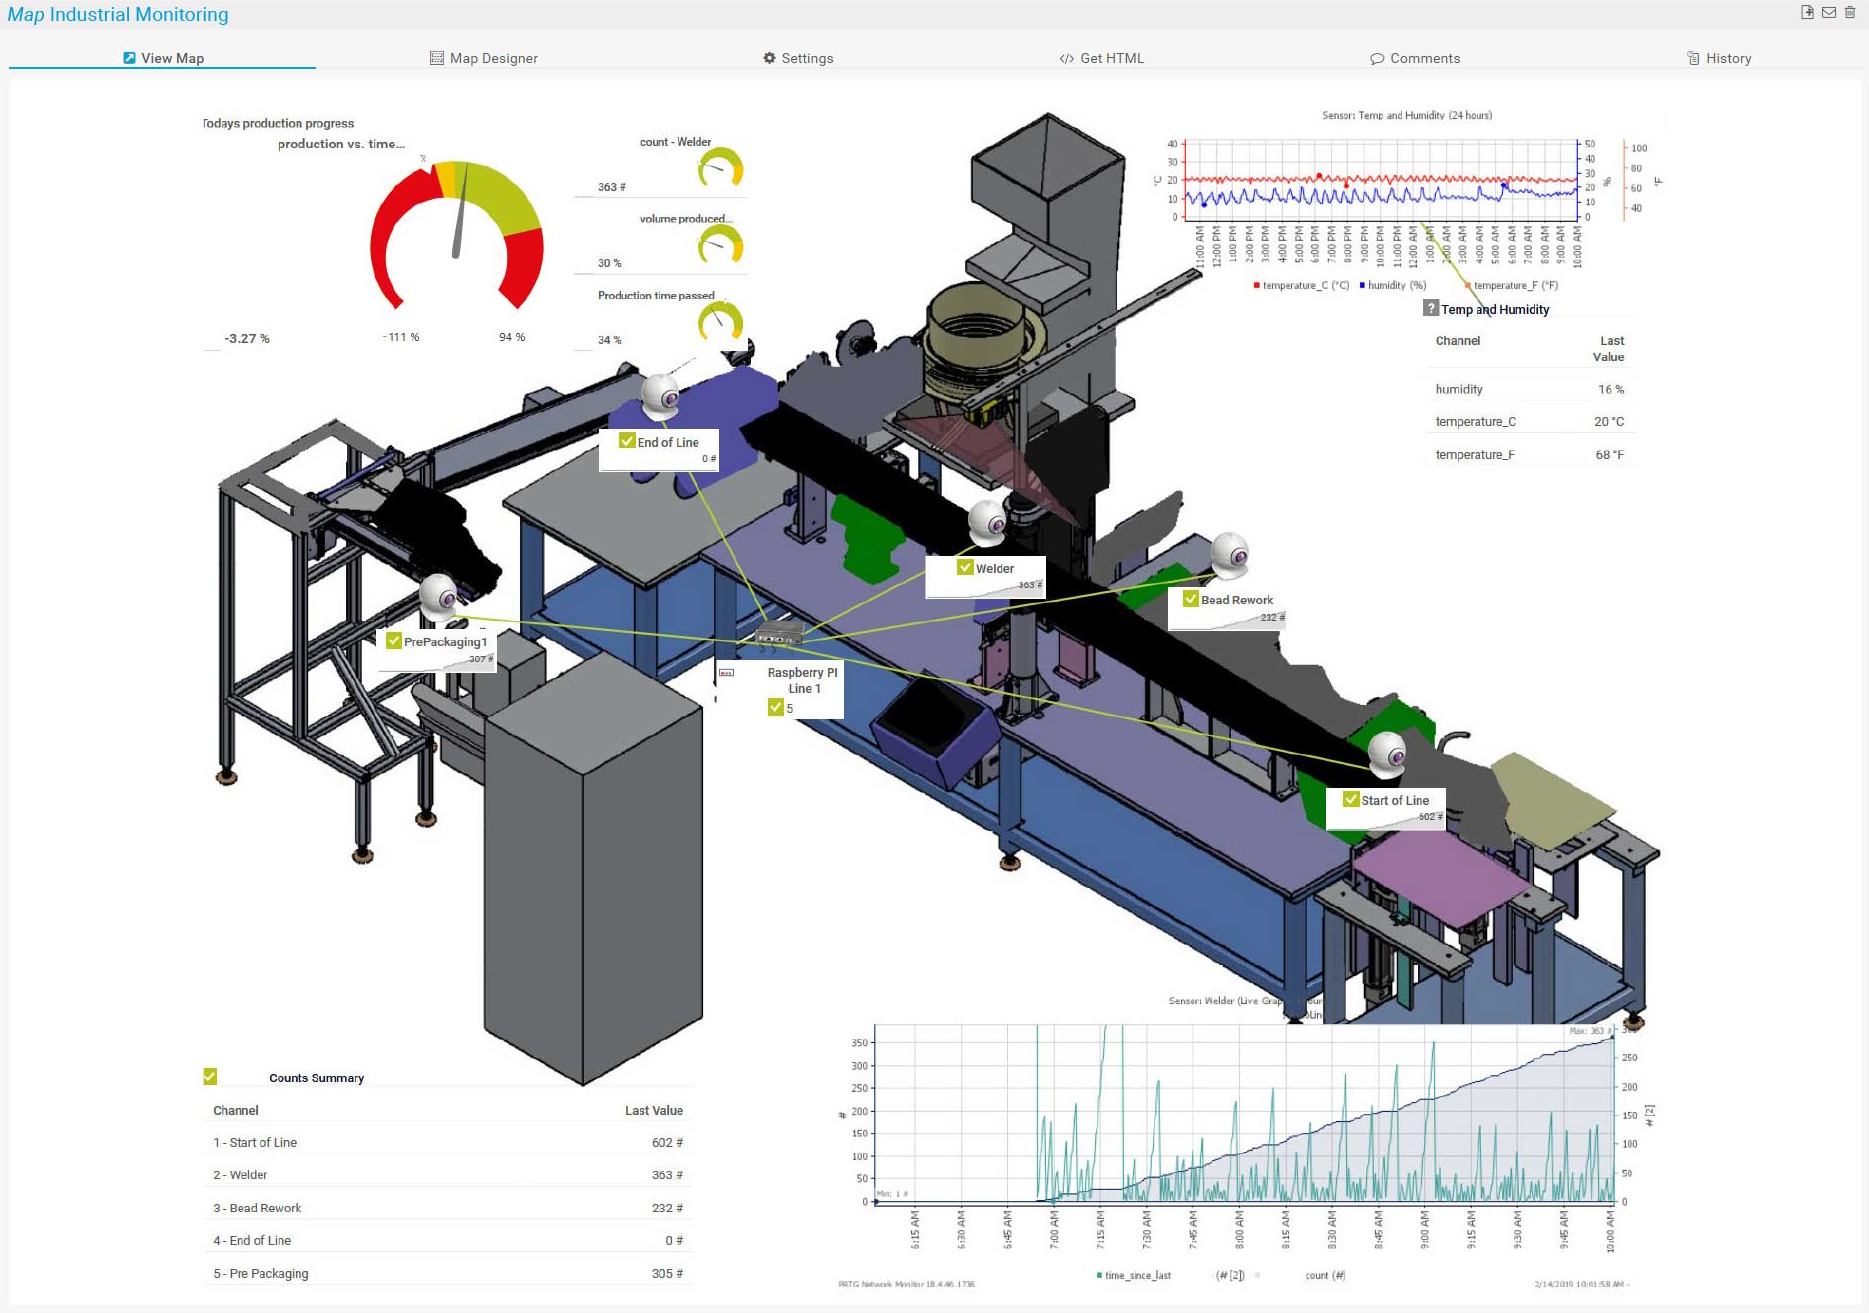
 

Start monitoring SCADA systems with PRTG and see how it can make your network more reliable and your job easier.


IT experts agree: Paessler PRTG is a great solution for IT infrastructure monitoring

logo

“All-around winning
network monitor”

logo it brief

“The real beauty of PRTG is the endless possibilities it offers”

logo

“PRTG Network Monitor
is very hard to beat”


The PRTG advantage: Preconfigured sensors for monitoring your industrial environment

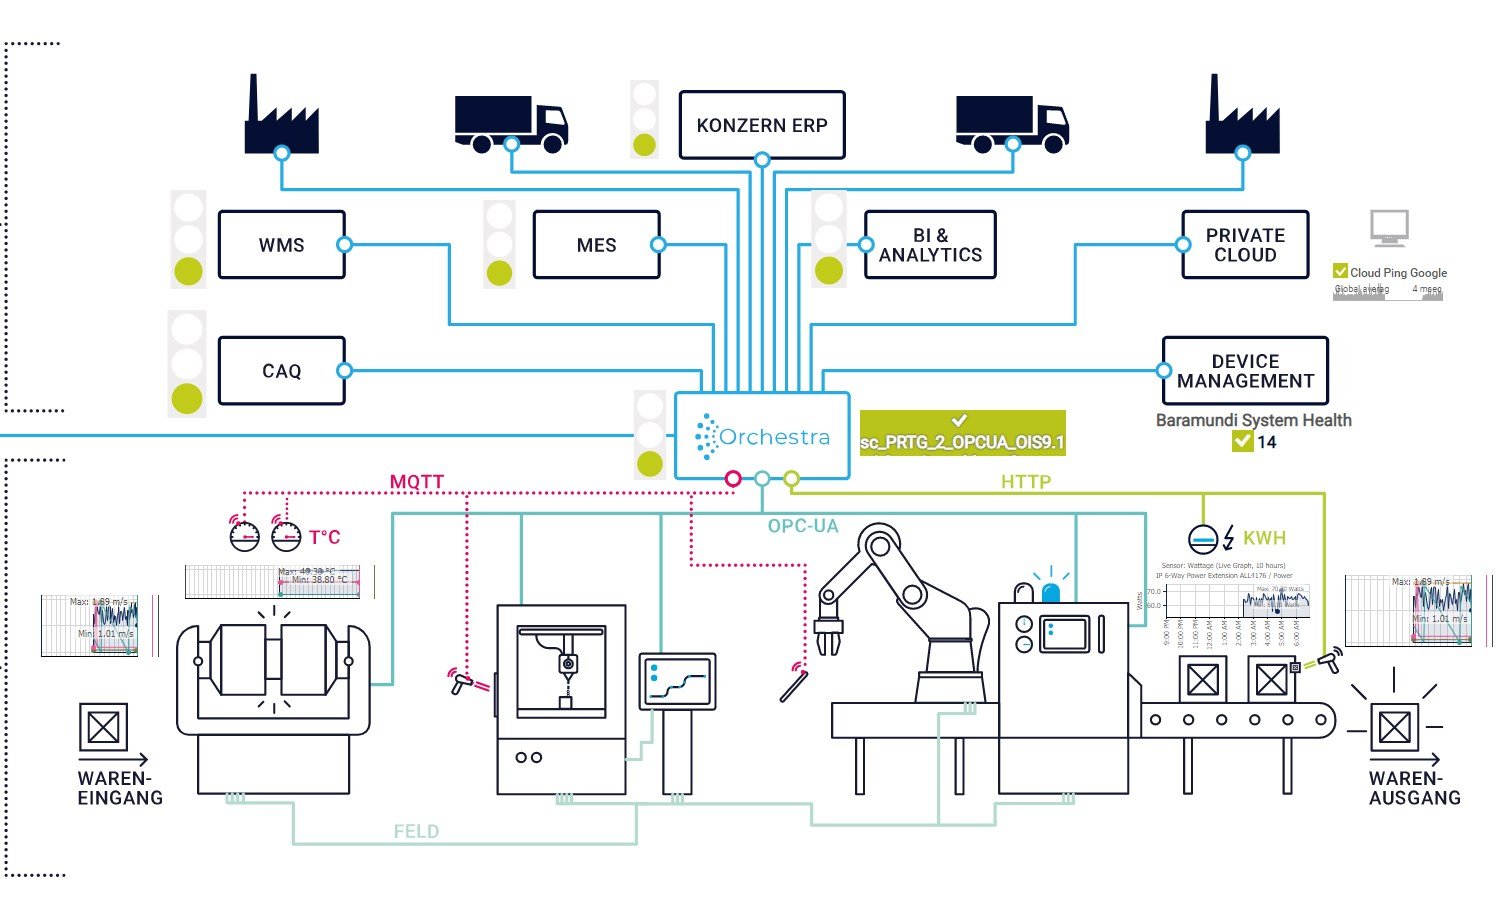
PRTG works well together with SCADA systems, but that’s not all it does; it’s the ideal monitoring tool for all areas of your industrial infrastructure. OT network components and systems, industrial Ethernet devices, industrial gateways, IIoT devices, classic IT hardware: PRTG understands it all. And, with its preconfigured sensors that use common industrial technologies like OPC UA, Modbus, and MQTT, you get a holistic monitoring solution – all in one place.

MQTT sensors


MQTT Round Trip

MQTT Round Trip sensor

The sensor MQTT Round Trip monitors the availability of an MQTT broker (server). The sensor connects to the broker as a publishing and subscribing client and sends the data packets using a predefined topic. It can show the following parameters:

  • Publisher connection time
  • Round trip time
  • Round trip status
  • Subscription connection time

MQTT Statistics

MQTT Statistics Sensor

The sensor MQTT Statistics monitors an MQTT topic. The sensor can show the following parameters:

  • Active topics
  • Number of received messages
  • Received payload

MQTT Subscribe Custom

MQTT Subscribe Custom

The sensor MQTT Subscribe Custom monitors numeric values returned by an MQTT topic that the sensor subscribed to. The sensor can show, for example, environmental parameters like temperature, humidity, illuminance, or pressure.

Modbus sensors


Modbus RTU Custom

Modbus RTU Custom Sensor

The sensor Modbus RTU Custom monitors custom numeric values returned by a Modbus Remote Terminal Unit (RTU). The sensor can show, for example, temperature and humidity.

Modbus TCP Custom

Modbus TCP Custom Sensor

The sensor Modbus TCP Custom monitors custom numeric values returned by a Modbus Transmission Control Protocol (TCP) server. The sensor can show, for example, the available memory, voltage, and operating status.

OPC UA sensors


OPC UA Certificate

OPC UA Certificate Sensor

The sensor OPC UA Certificate monitors the certificate of an OPC UA server. The sensor can show the following parameters:

  • Days to expiration
  • Public key length
  • Self-signed certificate

OPC UA Custom

OPC UA Custom Sensor

The sensor OPC UA Custom monitors custom numeric values returned by specific OPC UA node IDs. The sensor can show, for example:

  • CPU usage
  • Available physical memory
  • Fan speed
  • Number of server messages

OPC US Server Status

OPC UA Server Status Sensor

The sensor OPC UA Server Status monitors the health status of an OPC UA server. The sensor can show the following parameters:

  • Number of rejected requests and sessions
  • Number of security-rejected requests and sessions
  • Server status
  • Number of sessions, session aborts, and session timeouts
  • Number of subscriptions
  • Uptime

Rittal sensor


SNMP Rittal CMC III Hardware Status

SNMP Rittal CMC III Hardware Status Sensor

The sensor SNMP Rittal CMC III Hardware Status monitors the overall status of Rittal data center hardware, for example Rittal Computer Multi Control version 3 (CMC III) processing units, Rittal power distribution units (PDU), or Rittal IoT Interfaces and the hardware status of every attached external sensor.

Beckhoff sensor


Beckhoff IPC System Health

Beckhoff IPC System Health Sensor

The sensor Beckhoff IPC System Health monitors the system health of Beckhoff industrial PCs. The sensor can show the following parameters:

  • Available memory
  • CPU load and temperature
  • Mainboard temperature
  • RAID controller status
 

PRTG makes SCADA system integration easy

Custom alerts and data visualization make it easy to monitor, identify, and prevent industrial IT and OT network issues.


PRTG is compatible with all major vendors, products, and systems


vendors applications blue


Customer success story: Adani Electricity and Paessler PRTG ensure uninterrupted power supply for Mumbai

A great example of how PRTG can ensure the condition of a SCADA system can be found at Adani Electricity in India. There, PRTG plays a central role in monitoring the SCADA system, which runs on an Optical Fiber Cable network across 900 kilometers of cables.

Read the Adani success story


Your SCADA integrator at a glance – even on the go

Set up PRTG in minutes and use it on almost any mobile device.


PRTG comes with all the features you need, plus more your IT infrastructure won't want to live without.


PRTG monitors these vendors and applications in one view!


vendors vm ware


Get your free white papers


White paper I

In modern industrial IT, the right teams need the right data. Our guide shows how to implement holistic monitoring that brings elements from IT, OT and IIoT into your dashboards.

Download white paper

White paper II

Our second guide gives you inspiration and ideas for dashboards that feature IT, OT and IIoT data – all in one place. We show you what truly convergent industrial dashboards look like!

Download white paper


Easily find the source of the problem with our PRTG SCADA integration solution

Real-time alerts and custom notifications make it easy to solve issues with the availability and health of your SCADA system.


Create innovative solutions with Paessler’s partners

Partnering with innovative vendors, Paessler unleashes synergies to create
new and additional benefits for joined customers.

NetBrain

Integrating monitoring results from PRTG into NetBrain maps makes the foundation for network automation.

Read more

Rittal

IT that works constitutes a business-critical basis for a company's success. Availability and security must be defined for the respective purpose and closely monitored – by OT and IT alike.

Read more

ScriptRunner

With ScriptRunner, Paessler integrates a powerful event automation platform into PRTG Network Monitor.

Read more


gartner-peer-insights-badge-color.svg

“Excellent tool for detailed monitoring. Alarms and notifications work greatly. Equipment addition is straight forward and server initial setup is very easy. ...feel safe to purchase it if you intend to monitor a large networking landscape.”

Infrastructure and Operations Engineer in the Communications Industry, firm size 10B - 30B USD

Read the entire review at Gartner Peer Insights 


PRTG makes SCADA system integration easy

Custom alerts and data visualization make it easy to monitor, identify, and prevent industrial IT and OT network issues.


Monitor integrated SCADA: FAQ


What is a SCADA system?

Supervisory Control and Data Acquisition (SCADA) systems are made up of SCADA software and hardware components that are used to supervise and control industrial processes.

SCADA systems monitor data in real time and give users a human-machine interface (HMI) for providing process commands to components such as control valves, actuators, motors, and more.

They are crucial for industrial organizations since they help to maintain efficiency, process data for smarter decisions, and communicate system issues to help mitigate downtime.

How do SCADA systems work?

SCADA systems are connected to Programmable Logic Controllers (PLCs) and Remote Terminal Units (RTUs), which in turn gather data from sensors and devices in a plant.

This gathered data can be used for automated responses (such as reducing pressure in a system when it gets too high), insights into the production process, and for triggering alarms when there is a failure.

Where are SCADA systems used?

SCADA systems are used by a wide variety of companies and organizations. They can be implemented to monitor and control power grids, water treatment plants, processes on a production floor, and more. Metrics that are monitored include everything from pressure, power utilization and production time, ,to facility processes heating, ventilation, and HVAC systems of buildings.

Which SCADA systems can I integrate with PRTG?

With PRTG, you can monitor every SCADA system itself that supports OPC UA.

To bring PRTG alarms and metrics directly into your SCADA system, you need our product extension Paessler PRTG OPC UA Server. The following integrations have already been tested:

  • Ignition
  • atvise® scada
  • SIMATIC WinCC (TIA Portal)
  • SIMATIC WinCC Open Architecture
  • AVEVA Edge
  • FactoryTalk View (SE/ME)
  • PcVue
  • GENESIS64
  • FlowChief
  • VTscada

What is a sensor in PRTG?

In PRTG, “sensors” are the basic monitoring elements. One sensor usually monitors one measured value in your network, for example the traffic of a switch port, the CPU load of a server, or the free space on a disk drive.

On average, you need about 5-10 sensors per device or one sensor per switch port.


PRTG the multi-tool

PRTG: The multi-tool for sysadmins

Adapt PRTG individually and dynamically to your needs and rely on a strong API:

  • HTTP API: Access monitoring data and manipulate monitoring objects via HTTP requests
  • Custom sensors: Create your own PRTG sensors for customized monitoring
  • Custom notifications: Create your own notifications and send action triggers to external systems
  • REST Custom sensor: Monitor almost everything that provides data in XML or JSON format


We asked: would you recommend PRTG?
Over 95% of our customers say yes!


Paessler conducted trials in over 600 IT departments worldwide to tune its network monitoring software closer to the needs of sysadmins.
The result of the survey: over 95% of the participants would recommend PRTG – or already have.


Recommend PRTG


Still not convinced?

love

More than 500,000
sysadmins love PRTG

Paessler PRTG is used by companies of all sizes. Sysadmins love PRTG because it makes their job a whole lot easier.

speed

Monitor your entire IT infrastructure

Bandwidth, servers, virtual environments, websites, VoIP services – PRTG keeps an eye on your entire network.

trial

Try Paessler PRTG
for free

Everyone has different monitoring needs. That’s why we let you try PRTG for free.


Paessler PRTG 

Start monitoring SCADA systems with PRTG and see how it can make your network more reliable and your job easier. 


PRTG

Network Monitoring Software - Version 24.4.102.1351 (November 12th, 2024)

Hosting

Download for Windows and cloud-based version PRTG Hosted Monitor available

Languages

English, German, Spanish, French, Portuguese, Dutch, Russian, Japanese, and Simplified Chinese

Pricing

Up to 100 sensors for free (Price List)

Unified Monitoring

Network devices, bandwidth, servers, applications, virtual environments, remote systems, IoT, and more

Supported Vendors & Applications

More
cisco logo grey 40 dell logo grey 40 hp logo grey 40 ibm grey40 netapp grey40 linux grey40 aws grey40 windows grey40 vmware grey40 citrix grey40 exchange grey40 apache grey40 oracle grey40